It’s an exciting week for ThoughtSpot and for the data and analytics industry as a whole! ThoughtSpot’s latest funding round of $248M and valuation of $1.95B is a clear signal that search and AI-driven insights at scale marks the next wave of disruption in the data and analytics space.
Thank you to our customers who believed in this vision for human-scale analytics early on. You took a risk and we are thrilled with your continuous success on using data to transform your business.
When I look back on the BI and analytics industry, I remember the moments that signaled significant shifts in the industry in three broad waves.
Search & AI-driven Analytics
Some are calling this latest wave as BI 3.0. When I was with Gartner, we initially called it “smart data discovery” and later referred to it as “augmented analytics.” There are a couple hallmarks to this trend:
Intelligence first. Machine learning is infused in the whole analytics workflow to find the relevant insights. ThoughtSpot recommends the best search terms and synonyms and goes a step further to deliver automated personalized insights and recommend exploration paths.
Cloud native. The industry has a lot of technical debt of on-premises BI and data warehouses. But cloud deployments make up most of the net new spend in both BI and analytical databases. Cloud and distributed processing allow for elastic scale and analyses that were simply not possible before. Multi- and hybrid-cloud is on the rise.
Consumer-grade, human-scale. Products like Facebook, YouTube, and Twitter have an ease-of-use that requires no training. Business users are craving this same degree of ease-of-use in their business apps. Some have called this overall trend the “consumerization of IT.”

How did we get here?
There have been several moments leading up to today’s announcement that signal a clear shift in the industry that search & AI analytics is becoming the new norm in data. I will remember this as a new chapter for me personally, as well as the industry, as I will be posting this blog from Chicago, coincidentally during a ThoughtSpot sales team offsite.
Many of my new coworkers come from visual data discovery and traditional BI vendors. I’d say the industry consolidations in June signaled an end of the visual based data discovery era. Vendors who first laid claim to the market via visual data discovery will have to reinvent themselves to thrive in the new search and AI era.
First generation BI
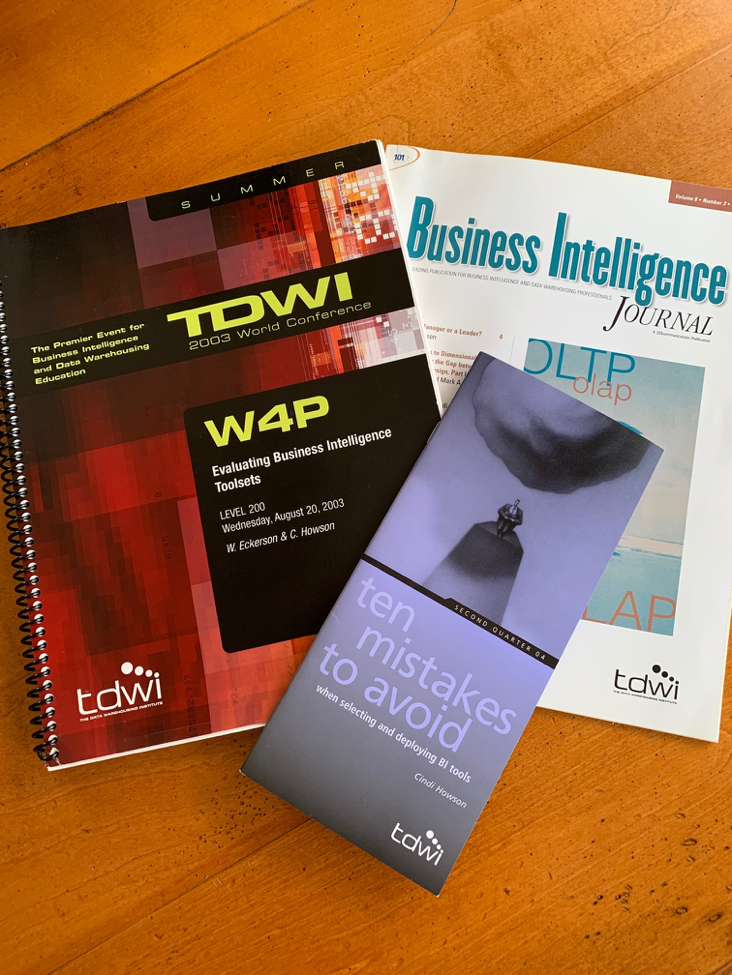
In the early 1990s, the ability to get data out of a relational database —without having to hand code SQL— was considered revolutionary. BusinessObjects pioneered this approach, although Cognos PowerPlay, with a different approach was initially more popular than Cognos Impromptu. These products started as client-server applications. It almost feels quaint that my MBA thesis in 1998 was how the Internet would reshape these BI tools. At the time, Brio and MicroStrategy were the best examples of vendors who were embracing the Web. My first BusinessObjects Complete Reference book published in 2003. There were no other such reference books on the market. Later, there would be multiple books from multiple publishers.

The moments: My daughter was born in 1996, 10 days early, after a particularly contentious tool strategy meeting about BusinessObjects versus Cognos. We also debated if we just wait until SAP or Oracle have a better BI solution over these then risky startups. So indeed, the start of this era is rather memorable.
Visual-based data discovery.
In 2002, I was trying to figure out where Spotfire fit in the BI market. At the time, they were focusing on life sciences and oil and gas industries. Then along came Qlik, also born out of Sweden (like Spotfire) making me wonder what was different about cutlure and universities there. I first touched Tableau as a Hyperion-Essbase add in back in 2004. For sure, it presented a richer visual front end to data coming from Essbase and spreadsheets in general.
I could see how these products were different from the then more popular BusinessObjects and Cognos. My original BI platform evaluation models didn’t apply well to this new breed of products, initially covering them in the Cool BI class at TDWI. They all started as desktop products. The interactive capabilities were a differentiator. Qlik and Spotfire leveraged in-memory computing, then only 32 MB on a desktop, but Tableau only added in-memory later. So, depending on when you started the clock counting, it took about 10 years for visual based data discovery to reach mainstream buying. I added visual discovery to BI Scorecard in 2011 and Gartner redefined the Magic Quadrant in 2016 to only include modern BI, removing traditional BI.

The moments: Was it Qlik’s IPO in 2010 that signaled the shift to visual based data discovery or was it Tableau’s in 2013? The rise of a new era also marked the waning of traditional BI, most notably when SAP acquired BusinessObjects in 2008. It was a sunny Sunday and I was shopping for a bed and desk for my daughter when someone from BusinessObjects called me to tell me about the pending acquisition. It was bigger news than the Oracle acquisition of Hyperion, and IBM’s acquisition of Cognos followed soon after.
Some key take-aways:
Take a look at these waves of disruption and think about how long each phase lasted.
Traditional BI took about 15 years to reach mainstream buying.
Visual-based data discovery took 10.
Augmented analytics is looking to be two to five years.
The pace of technology innovation has accelerated just as business change has. As one CIO said to me, “the last three years, we have gone through a bigger transformation than in the last 100. What worked for the last century will not help us survive.”
Change is hard. Personally and professionally. Some will mourn the end of an era while others will enthusiastically embrace the future. Don’t look back and feel like you placed the wrong bets (unless of course, you buried your head in the sand and ignored these shifts). I liken the waves of disruption in business intelligence and analytics to how the music industry keeps shifting. I once played my favorite songs from Steely Dan on a vinyl record album, that was later usurped by smaller CDs, then an iPod. And now, it’s Kenny Chesney over Alexa.
An end of an era does not mean the end of a vendor or product, although in some cases it may. Competition is good for the industry. It raises the bar for everyone. I see how natural language processing and automated insights are on most vendor’s roadmaps. Some vendors are developing these technologies while others are gaining them through acquisition. We can debate which approach yields the best results, the fastest. I know that users and analytics leaders alike will agonize over when to invest in a new provider, what to maintain and when to divest. As I've said for 20 years now, focus on the business value with a view of the right tool for the right use case.
The only knowns in this space are that innovation is a constant, the pace of change is faster, and being data driven is a matter of business survival.
You have to be a change agent - for yourself and your company. I made my own bold move in April, seeing where the market has been going. If you are only just now getting educated about this next wave of disruption, I hope you’ll come to the Beyond conference in Dallas, October 15-16. Because the best testimonials are those from our world-class customers.


