


What is business intelligence?
Business intelligence (BI) refers to the technology and processes that turn your organization’s raw data into useful insights you can act on.
But to use BI to actually hit your business goals—not just set them—you need to know:
Where do you stand today?
How far are you from where you want to be?
How could each decision shape what comes next?
These are basic questions, yet many leaders can’t answer them with confidence. According to Forbes, only 59.5% of surveyed leaders are using data to drive business innovation. That means nearly half are flying blind.
The fix? Modern business intelligence (BI) gives you the visibility you need to move forward with clarity. It helps you track performance, surface bottlenecks, flag risks, and spot new ways to grow—whether that’s through better customer experiences, stronger products, or sharper operations.
Table of contents:
- How does business intelligence work?
- What are the benefits of business intelligence?
- Business intelligence examples
- Business intelligence vs. business analytics
- What to look for in a BI platform
- Top business intelligence tools
- Business intelligence best practices
- Choose a BI platform built for the decade of data
Business intelligence starts by pulling data from everywhere your business operates—internal systems like your ERP, CRM, or POS, plus external sources like web analytics, social media, and customer feedback. These insights show up in dashboards and reports, helping you make faster, smarter decisions around pricing, inventory, campaigns, and more.
As data volumes continue to grow, spotting patterns or signals in the noise becomes harder. The role of AI in BI is increasingly important for surfacing insights and making timely decisions. That’s where BI tools come in to help you make sense of complex data, by offering a clear view of performance, whether you’re looking at high-level metrics or zooming in on specific teams, departments, or initiatives.
Take a retail company, for example.
You might combine sales data from registers, inventory data from your warehouse system, and customer info from your CRM. On their own, these data points don’t offer much, but when centralized in a data warehouse and analyzed with the right tools, they reveal trends like top-selling products, seasonal patterns, and high-value customer segments.
To scale this process, businesses are adopting the modern data stack, a cloud-based, modular approach to collecting, storing, transforming, and analyzing data. Here's how it works:
The modern data stack in action
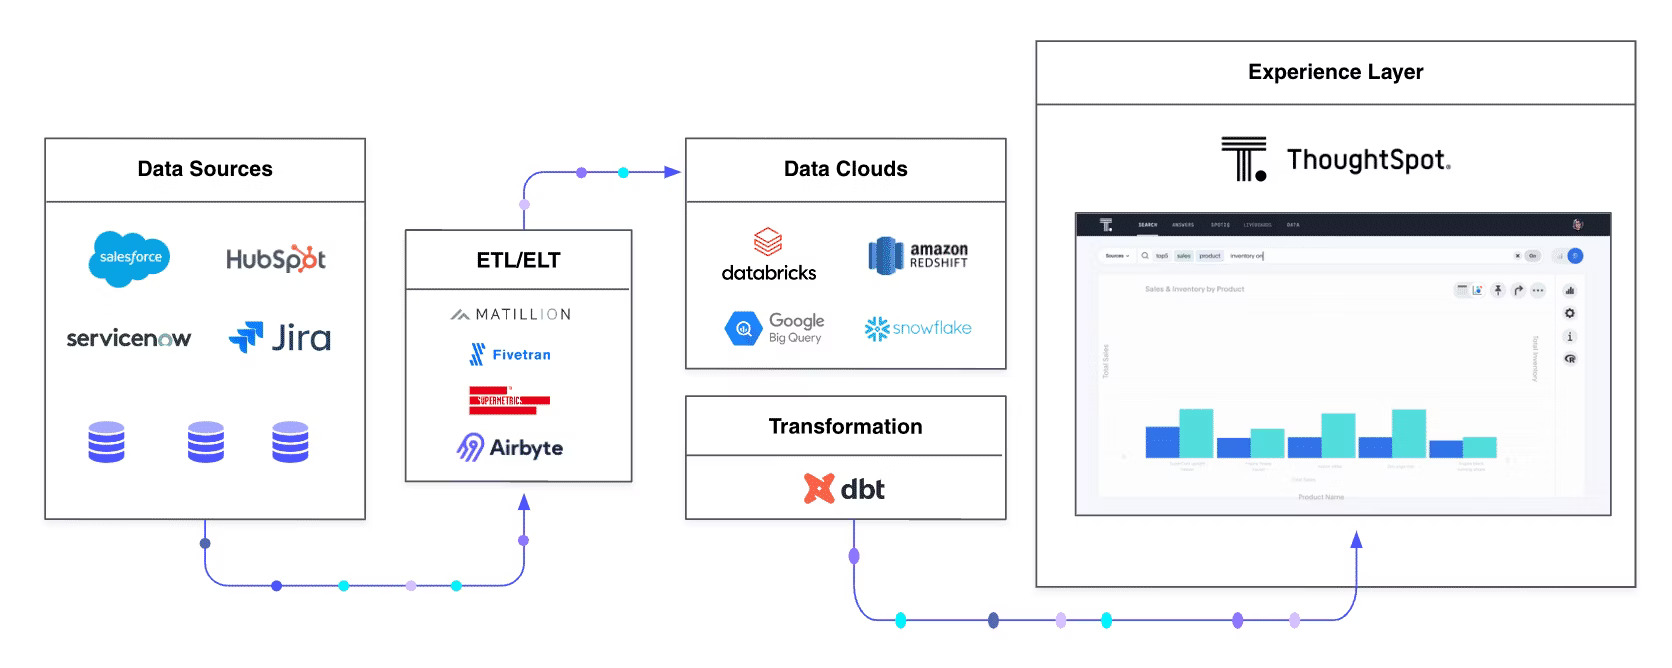
Step 1: Collect data from all your sources
Pull raw data from platforms like Salesforce, ServiceNow, and HubSpot. This could be anything from sales calls and support tickets to website activity and campaign results.
Step 2: Extract and load your data
Use tools like Fivetran, Airbyte, Supermetrics, or Matillion to extract the data and load it into your data warehouse. These tools automate the heavy lifting and keep everything up to date.
Step 3: Store it in a cloud data warehouse
Platforms like Snowflake, BigQuery, or Redshift serve as the foundation of your BI architecture, acting as a clean, scalable single source of truth for analysis.
Step 4: Transform your data for analysis
This is where tools like dbt come in. They help shape and clean your data so it’s ready for analysis, whether you’re using ETL or ELT pipelines.
Step 5: Analyze and explore
Finally, with tools like ThoughtSpot, business users can search, visualize, and drill into the data directly. BI reporting becomes easier and more interactive, helping you identify trends, track KPIs, and share insights across the org in real time.
As you might expect, there are many benefits to using business intelligence. When your business runs on clear, reliable data, you don’t just react, you lead. Here’s how business intelligence helps you stay ahead:
1. Improve your products and services
Understand what your customers love and where they’re getting stuck. BI helps you analyze usage patterns, feedback, and support data so you can refine features, fix gaps, and build what people actually want.
2. Streamline day-to-day operations
From inventory to employee workflows, BI helps you see what’s working and what’s not. You can eliminate bottlenecks, reduce waste, and automate repeatable tasks to keep things running smoothly.
3. Spot patterns, risks, and opportunities
Whether it’s a spike in customer churn or a sudden uptick in product demand, BI tools highlight trends early so you can act before they become a problem or a missed opportunity.
4. Boost efficiency across teams
When everyone’s working from the same source of truth, you waste less time aligning and more time executing. Embedded BI makes this even easier by bringing insights into the tools teams already use.
5. Build smarter, more flexible strategies
Static annual plans don’t cut it anymore. BI gives you the data agility to adjust your strategy in real time based on what the numbers are telling you, across product, marketing, finance, and beyond.
6. Keep customers happy
See how different segments behave, where satisfaction drops, and what drives loyalty. Then use those insights to personalize experiences, improve support, and increase retention.
7. Make decisions grounded in reality
When you’re facing high-stakes choices, clarity matters. BI surfaces the insights behind the numbers so you're not left making calls in the dark.
8. Stay ahead of market and industry shifts
Combine internal data with external signals to spot changes in the competitive landscape or shifts in consumer behavior. BI gives you the heads-up you need to adapt before your competitors do.
Business intelligence comes to life when you see how different teams actually use it to move faster, work smarter, and make better decisions. Here’s what that looks like across marketing, sales, and operations.
Marketing
Marketing teams lean on BI to track how campaigns are performing and adjust in real time. Imagine you're launching a weekly newsletter. Before it goes out, your team sets targets for opens, clicks, unsubscribes, and more.
With BI tools, they can monitor these KPIs week over week, test different strategies, and tie results back to pipeline impact to calculate ROI.
Tools like AI-augmented dashboards make this even easier. They’re interactive, real-time dashboards designed for collaboration, sharing, and fast decision-making.
Sales
Sales teams use BI to keep a pulse on pipeline health, tracking deal volume, meeting counts, stage progression, conversion rates, and more. Sales leaders can compare performance across quarters, adjust forecasts, or double down on strategies that are working.
You can also zoom in on your sales dashboard to see what’s driving results: which reps are performing best, which products are closing fastest, and which segments are generating the most profit.
Take Fabuwood, for example. They needed real-time visibility across their organization. With ThoughtSpot, they built a Sales Liveboard that gives the entire company access to current sales data by product, region, rep, and customer.
The result? A 2.5x increase in adoption from their legacy tool, and a 300% increase in self-service user queries.
Operations
For operations teams, BI is key to running a tight ship. They use BI dashboards to forecast demand, monitor cycle times, track downtime, and spot inefficiencies early, so deadlines don’t slip and resources stay on track.
For the Metropolitan Police, the ability to use data to make timely decisions couldn’t be more critical. Aimee Smith, Director of Data, shared her experience on the Data Chief, highlighting how the force has swapped 8 separate operational systems for one integrated cloud solution.
“I like to think of it as a utility belt—you know how cops wear their utility belt? Well, hanging on there is this ThoughtSpot tool. A sergeant invented a way to use it for planning major events, concerts, to make sure our presence is right. And now that's replicable by other people who want to do the same thing.”
Instead of digging through spreadsheets, officers and analysts now get a live view of all of their data. That means less time wrangling data, and more time to prevent crime and improve policing plans for major events like the Taylor Swift Eras tour.
⚡Learn more about other useful business intelligence examples
Business intelligence and business analytics are often mixed up with data analytics, but all three serve different roles in working with data.
|
Aspect |
Data Analytics |
Business Intelligence |
Business Analytics |
|
Main focus |
Preparing large volumes of data so it’s ready for analysis |
Understanding what’s happening now and what happened in the past |
Applying BI in a specific business context to understand outcomes and causes |
|
Key activities |
Data mining, cleaning, transforming, and applying governance |
Spotting trends, tracking performance, and making informed decisions |
Analyzing why things happen, understanding the impact of decisions |
|
Primary users |
Data analysts, data engineers |
Business users without deep technical skills |
Business analysts, analytics engineers |
|
Goal |
Make raw data usable and trustworthy |
Support day-to-day decision-making through accessible insights |
Solve targeted business problems and drive better results |
|
Time orientation |
Prepares data for any kind of analysis |
Past and present-focused |
Past, present, and future-focused (cause-and-effect, scenario planning) |
Not all BI tools are built the same. And if you’re scaling across departments or geographies, you’ll need enterprise BI capabilities. Platforms that support broad access, advanced governance, real-time data syncing, and deep integration with your existing tech stack. Choosing the right one can have a major impact on how effectively your teams use data to make decisions.
Once you’ve got the basics down, here’s what to prioritize:
Self-service access: Anyone can explore data and build dashboards.
Collaboration features: Sharing, commenting, and alerts to keep teams in sync.
Stack compatibility: Works with your cloud warehouse, business apps, and data pipelines.
Real-time syncing: Always-on, up-to-date insights without lag.
Scalability: Handles growth in data, users, and sources without slowing down.
Strong governance: Granular access controls, audit logs, and identity provider integration.
Easy to use: Clean interface, natural language search, low learning curve.
Smart insights: AI surfaces trends, anomalies, and recommendations.
Action-ready: Sends alerts, embeds insights, and triggers workflows right where work happens.
👉 Learn more about how to choose the right business intelligence (BI) solution to match your organization's needs.
Business intelligence is the underlying foundation of a solid data analytics strategy, no matter what industry your company serves. Let’s look at a few industry examples.
1. ThoughtSpot
ThoughtSpot is a modern, search-driven BI platform that turns your cloud data into business-ready insights. Ask questions in natural language, get AI-powered answers instantly, and share accessible, interactive dashboards with your team.
Features include: Spotter (your AI analyst), Analyst Studio for advanced prep, and collaborative, AI-augmented dashboards.
2. Looker
Google Cloud’s enterprise BI platform with strong data modeling and governance. Define metrics centrally with LookML, deliver consistent dashboards to teams, and integrate tightly with Google’s data stack.
3. Qlik Sense
Self-service BI with an associative engine for flexible, intuitive exploration. Lets users find insights without predefined queries, with smart visualizations and options for cloud or on-prem deployment.
🔍 Check out the 9 best business intelligence tools to consider in 2025
To get the most from your BI efforts, a solid foundation matters. Here are a few best practices to guide your approach:
Start with clear goals: Know what decisions you’re trying to support before building your dashboards. Who’s using it? What questions are they asking?
Tailor to your audience: Different teams care about different metrics. Customize dashboards based on what matters most to each group.
Make it interactive: Add filters and drill-downs to help users explore the data without having to request a new report.
Lead with what matters: Use the inverted pyramid model. Put your most important insights at the top left, followed by supporting details.
Pick the right visualizations: Bad data visualization choices, like cluttered pie charts, can distract or even distort the message. Stick to visuals that match the type of data you’re showing and make the story easy to grasp at a glance.
Always add context: Metrics alone don’t mean much. Include historical comparisons, benchmarks, or milestones so viewers can see progress at a glance.
Keep it clean: Don’t overcrowd your layout. Use whitespace well, limit color use, and aim for a clear visual hierarchy to improve readability.
As you put data at the center of your strategy, it’s not enough to pick just any BI tool. You need one designed to help you lead in the decade of data. That’s where ThoughtSpot stands out.
ThoughtSpot delivers an intuitive, search-based experience that makes data analysis accessible to you and your team. Agent-powered analytics fit naturally into your workflows, so you can easily create, share, and act on insights.
And with advanced capabilities like Spotter, you don’t just see dashboards: you find trends, catch anomalies, and discover opportunities that drive real business impact.
Want to stay ahead of the curve? Book your free demo today.


