


Data is vital for the success of any business, especially those that rely on customer information. According to Statista, by the year 2025, there will be over 24 billion interconnected devices globally—all generating continuous flows of data filled with critical consumer information. Delays in decision-making and operations could cost your business.
To keep up with growing demand, you need a real-time, accessible, and, reliable business intelligence solution. That’s why many businesses are turning to live dashboards.
Live dashboards, as we call them Liveboards, are essential for understanding data, sharing insights, and making data-backed decisions. This article explores why live dashboards are becoming more popular and the crucial role they play in extracting value from data.
Table of contents:
Live dashboards offer real-time visual representations of your data. They often provide a comprehensive and interactive overview of an organization's data, allowing you to monitor, analyze, and respond to changes as they occur. These business dashboards are often web-based, accessible from multiple devices, and can be customized to display relevant metrics and key performance indicators.
Real-time decision-making: Live dashboards allow you to respond promptly to changing conditions. They’re also called real-time dashboards. Whether it's monitoring website traffic, sales performance, or operational efficiency, up-to-the-minute insights facilitate data-driven decisions.
Improved visibility: These real-time dashboards offer a comprehensive view of your organization's performance. With increased visibility, stakeholders at all levels stay informed and aligned with strategic goals.
Enhanced collaboration: Live dashboards promote collaboration by providing a shared platform for teams to analyze and discuss data. This collaborative environment fosters a data-driven culture within an organization.
Increased accountability: With live dashboards, accountability becomes more transparent. Teams can track their progress and individuals are held accountable for their performance metrics.
Customer satisfaction monitoring: Using a real-time dashboard, you can track customer interactions, feedback, and satisfaction to calculate the net promoter score (NPS). This enables quick response to customer issues, leading to improved satisfaction and customer loyalty.
Now that you have a foundational understanding of live dashboards, let's explore the real-world impact of these dynamic tools.
Northmill's data team was spending endless hours with its legacy BI tool building reports. Looking to leverage the full power of their customer data, they started their search for a robust, futureproof modern data stack and self-service analytics platform. Today, Northmill uses ThoughtSpot to develop Liveboards for users across finance, marketing, products, and customer service.
Here’s what Tobias Ritzé, CFO of Northmill Bank has to say about ThoughtSpot-
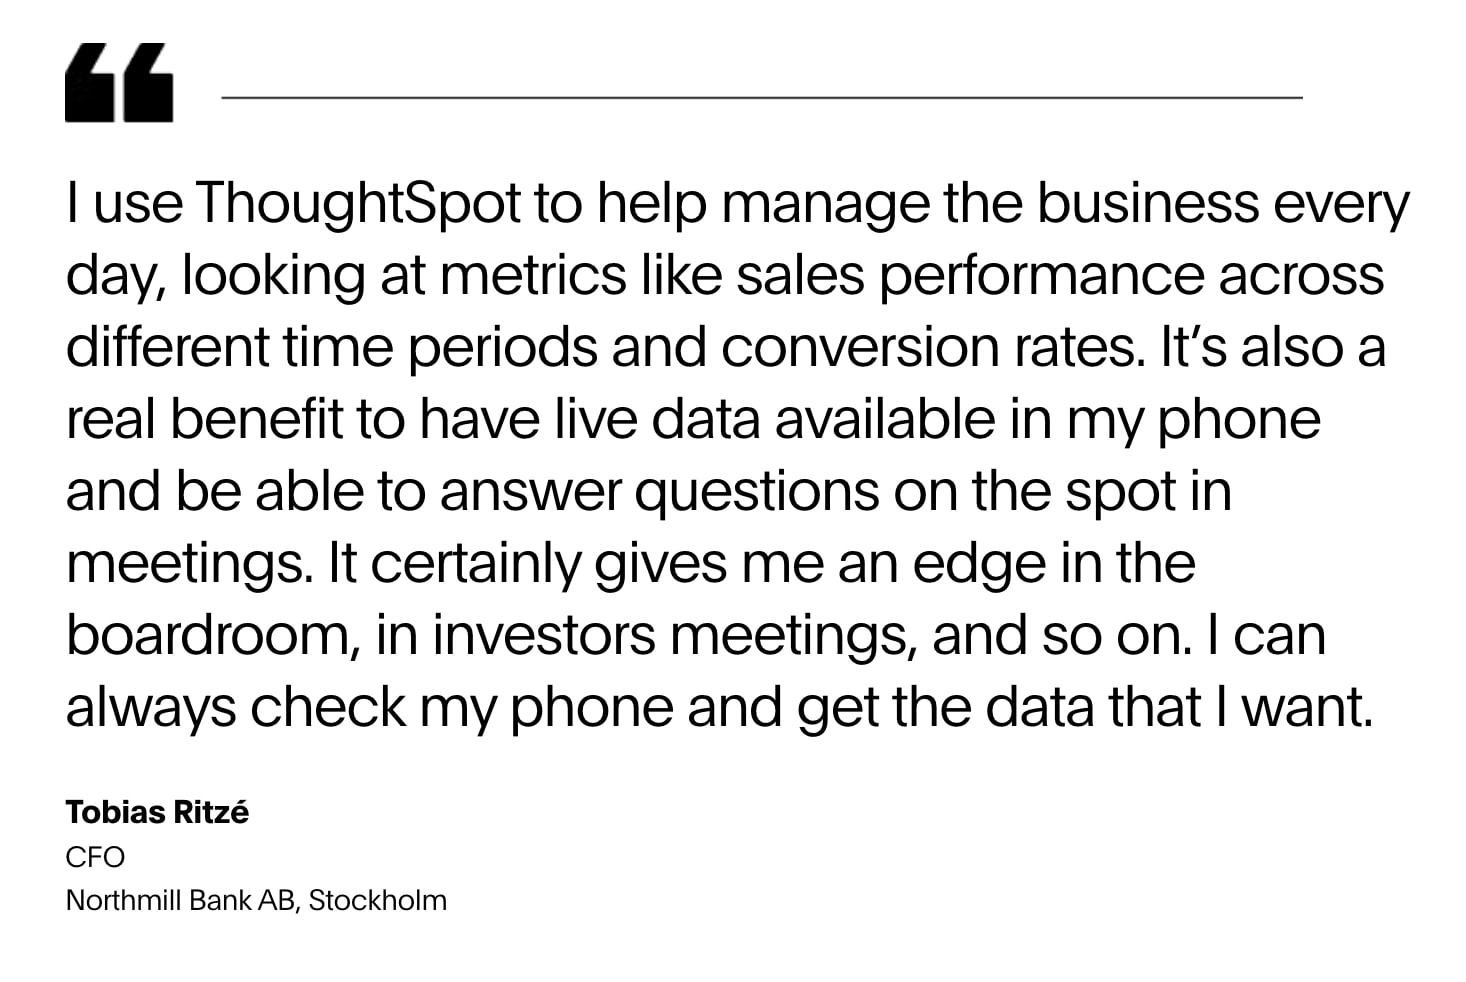
By using the insights generated from ThoughtSpot’s Liveboards, Northmill has boosted onboarding conversion rates by a whopping 30 percent.
1. Financial live dashboards
At its essence, a financial Liveboard is a graphical representation of essential financial information. This allows for a quick understanding of your organization's financial health, covering elements like expenses, sales, and profits. Using formats like charts, graphs, and widgets, the financial Liveboard transforms complex financial information into easily comprehensible visual elements.
Features of financial Liveboards
Real-time data updates: Your financial Liveboard ensures you have the most up-to-date information at your fingertips, with real-time data updates that reflect the current state of your financial affairs.
Income analysis: Gain insights into your income sources and patterns. Track the performance of various income streams over time to make strategic financial decisions.
Budget monitoring: Set, track, and manage your budgets seamlessly. Your Liveboard provides a consolidated view of budgetary performance. This will help you stay on track and avoid overspending.
Key performance indicators: You can use financial Liveboards to track financial metrics like revenue, expenses, profitability, and cash flow. By tracking this, you can assess your financial performance and identify areas that need attention.
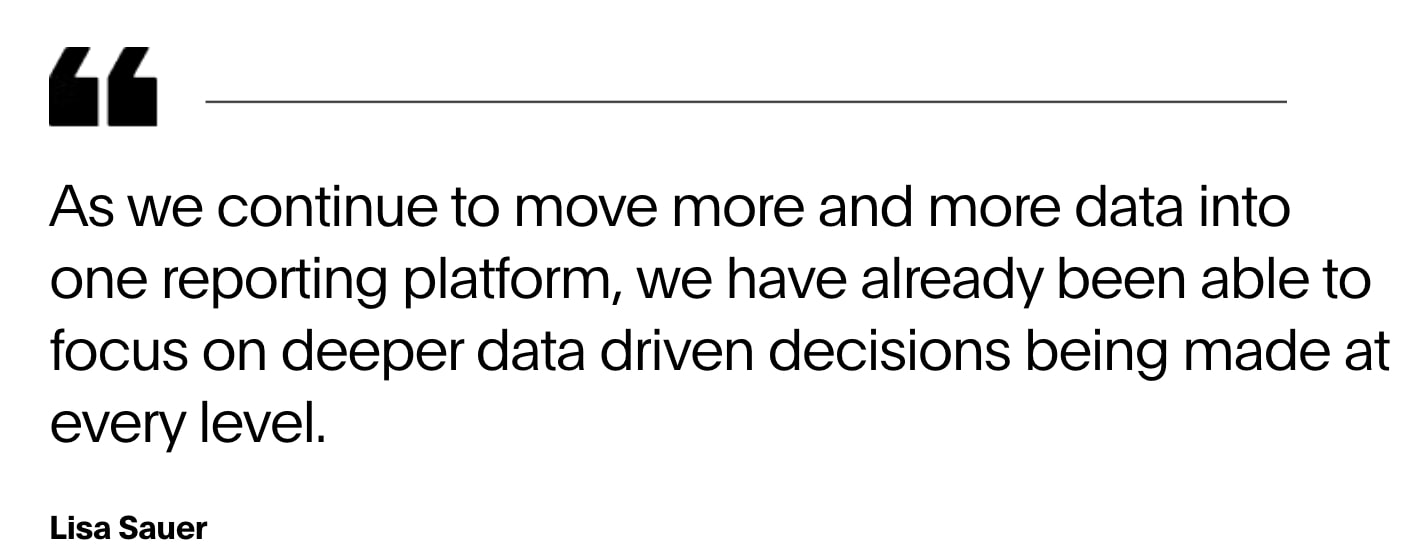
To better understand the use of financial Liveboards, let’s take a look at a real-life scenario of Modern Restaurant Concepts. For optimizing growth at Modern Restaurant Concepts, former Finance Director Lisa Sauer streamlined reporting by adopting ThoughtSpot's Liveboards. This enabled real-time monitoring of sales and labor data for General Managers across numerous nationwide restaurants. Liveboards facilitated quick analysis of sales versus forecasts, simplifying budgeting, and setting transparent goals.
2. Sales live dashboards
A sales Liveboard is a visual representation of KPIs and metrics related to sales activities within an organization. It provides a centralized and easily accessible way for sales teams, managers, and other stakeholders to monitor and analyze sales performance.
Features of sales Liveboards
Sales performance metrics: A sales Liveboard allows you to access metrics such as total revenue, sales growth, and individual sales rep performance. These metrics give you an instant overview of your sales team's effectiveness.
Pipeline visualization: You can visualize your sales pipeline stages and identify bottlenecks or areas for improvement. You can also track the progress of deals through each stage to forecast future revenue accurately.
Lead and opportunity management: With a sales Liveboard, you can keep a close eye on your leads and opportunities. You can prioritize efforts on the most promising leads by tracking their status, source, and value.
Customer lifetime value (CLV): You can calculate and track the CLV for each customer. Understanding the long-term value of customers helps in making strategic decisions regarding customer retention and acquisition.
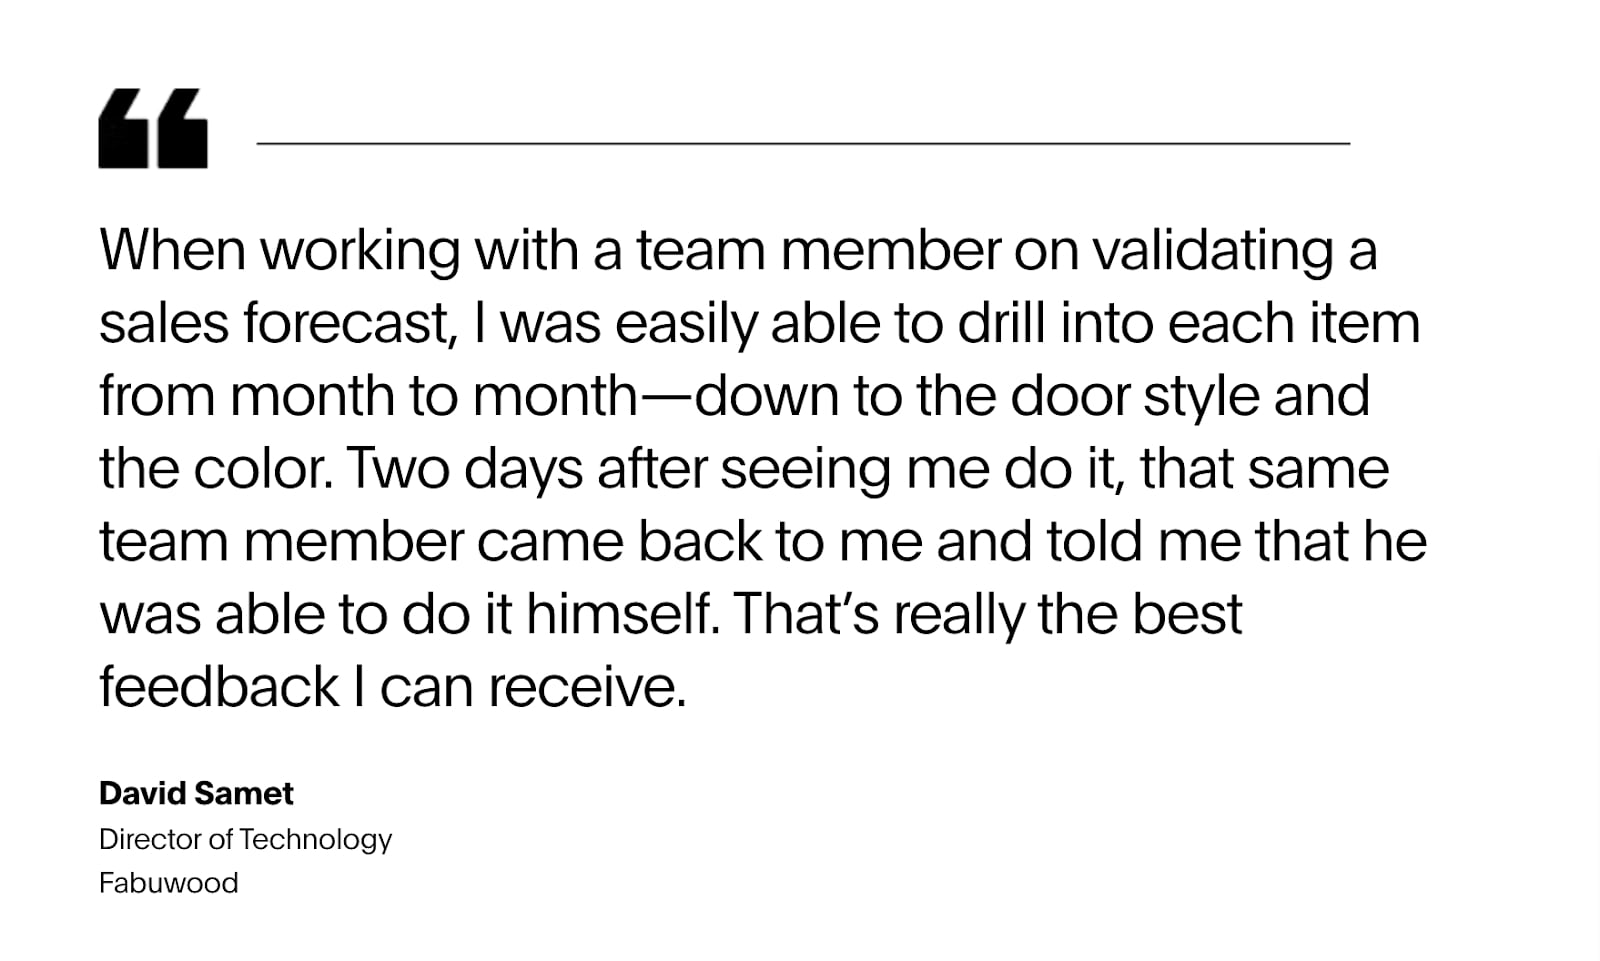
Let’s take a real-world example of Fabuwood. When facing the challenge of efficiently sorting data by product type, location, customer, and sales representative, the leadership team recognized the need for a user-friendly business intelligence tool. Today, the Sales Liveboard powered by ThoughtSpot stands as the central hub of information for the entire Fabuwood organization. The dashboard provides real-time access to sales data, allowing executives, managers, and sales teams to gain insights and improve Fabuwood’s overall efficiency and profitability.
3. Marketing live dashboards
Marketing Liveboards are tools that provide a comprehensive and real-time overview of metrics related to marketing activities. These dashboards are designed to help marketing professionals, managers, and other stakeholders assess the effectiveness of marketing initiatives and campaigns. By presenting data in a visually appealing and easily understandable format, marketing Liveboards facilitate quick decision-making and strategic planning
Features of marketing Liveboards
Traffic and engagement metrics: With marketing Liveboards, you can track website traffic, page views, bounce rates, and engagement metrics to assess the performance of online marketing efforts.
Lead generation and conversion rates: You can monitor the number of leads generated and conversion rates to evaluate the success of marketing campaigns in terms of lead quality and customer acquisition.
Social media analytics: Marketing Liveboards integrate metrics from social media platforms, including follower growth, engagement, and the performance of individual posts or campaigns.
Email marketing metrics: They include key metrics such as open rates, click-through rates, and conversion rates to assess the effectiveness of email marketing campaigns.
Advertising performance: You can view metrics related to advertising campaigns, including impressions, click-through rates (CTR), and return on ad spend (ROAS).
4. Healthcare analytics live dashboards
A healthcare analytics Liveboard is a visual representation of key healthcare data and metrics that provides insights and facilitates data-driven decision-making in the healthcare industry. It typically involves the use of data visualization tools and technologies to present complex data in a comprehensible and actionable format. Healthcare analytics Liveboards are designed to help healthcare professionals, administrators, and decision-makers monitor and analyze various aspects of healthcare operations, patient outcomes, and financial performance.
Features of healthcare analytics Liveboards
Data aggregation: Healthcare analytics Liveboards bring together data from various sources such as electronic health records (EHRs), billing systems, and patient satisfaction surveys.
Data visualization: They represent healthcare data through charts, graphs, tables, and other visual elements to make it easier to interpret and understand.
Performance metrics: These dashboards display metrics related to patient outcomes, hospital efficiency, financial performance, and other relevant key performance indicators.
Patient engagement: Some analytics dashboards include features that allow patients to access their own health data, treatment plans, and other relevant information.
Let’s take a look at the cutting-edge solution that is redefining the landscape of data analytics. ThoughtSpot offers dynamic and interactive visualizations that deliver real-time insights precisely when and where they are needed, enabling you to make informed, data-backed decisions.
Here are several ways ThoughtSpot Liveboards quickly deliver value:
SpotIQ utilizes AI-assisted analytics to uncover hidden insights.
Verified Liveboards establish data governance and uphold quality standards throughout the organization.
Connectors effortlessly transmit data to your business team when required, eliminating the need for building and maintaining integrations.
Data on-the-go facilitates real-time data tracking on mobile devices, empowering you to make data-driven decisions anywhere and anytime.
Quick, informed decision-making is the new normal, and live dashboards are an essential tool for managing and extracting value from dynamic data streams. With the support of ThoughtSpot Liveboards, you’ll always have the data you need to back up your decisions.
Schedule a demo, and witness the power of ThoughtSpot.


