


In the digital age, where information flows at the speed of light and markets evolve in the blink of an eye, staying ahead of the curve isn't just an advantage—it's a necessity. As a sales manager, your sales pipeline isn't just a sequence of prospects; it's a goldmine of untapped potential waiting to be transformed into closed deals and revenue growth.
The key to dominating the market lies in sales enablement—equipping your team with the dashboard software and knowledge they need to drive results, beat the competition, and minimize customer churn. And you’ll find that knowledge in a sales dashboard.
This comprehensive guide takes you on a journey through the world of sales dashboards, from understanding their purpose to referring to great sales dashboard examples. Let’s dive in!
Table of contents:
A sales dashboard is a visual representation of your sales data that provides a real-time snapshot of your sales performance. It offers a multitude of benefits, making it an essential tool for businesses of all sizes. Here are some compelling reasons why you should consider creating a sales dashboard:
Real-time visibility: Sales dashboards provide up-to-the-minute data on your sales performance. This real-time analytics is invaluable for making quick decisions and responding to changing market conditions.
Performance tracking: With a sales dashboard, you can easily monitor your team's performance. It allows you to track individual and team progress against sales targets and key performance indicators (KPIs).
Data consolidation: Sales data often resides in various sources such as CRM systems, spreadsheets, and marketing tools. A sales dashboard consolidates this data into a single, easy-to-access platform, saving time and reducing errors.
Identifying trends: Sales dashboards help you identify sales trends, patterns, and anomalies. This enables you to adjust your strategies and tactics accordingly.
Goal setting and achievement: Set clear sales goals and track your progress. This keeps your sales team motivated and focused on achieving their targets.
Improved decision-making: With a sales dashboard, you have the information you need at your fingertips. Whether it's about resource allocation, product development, or sales strategies, your sales dashboard empowers you to make informed decisions quickly.
Customer insights: Analyzing sales data provides valuable insights into customer behavior, preferences, and purchasing patterns, which can serve as a foundation for enhancing customer loyalty and guiding your marketing and sales strategies.
While the advantages of sales dashboards are clear, their true potential becomes even more evident when we look at a real-world example:
Fabuwood's executives sought access to real-time sales data. They were looking for a user-friendly BI tool to sort data by product type, location, customer, and sales representative. Today, the Sales Liveboard stands as the central hub of information for the entire Fabuwood organization. It ensures that real-time sales data is accessible to everyone via ThoughtSpot.

Sales dashboards come in various forms, each catering to specific needs and roles within an organization. Let's explore a range of best sales dashboard examples to see how they serve different purposes:
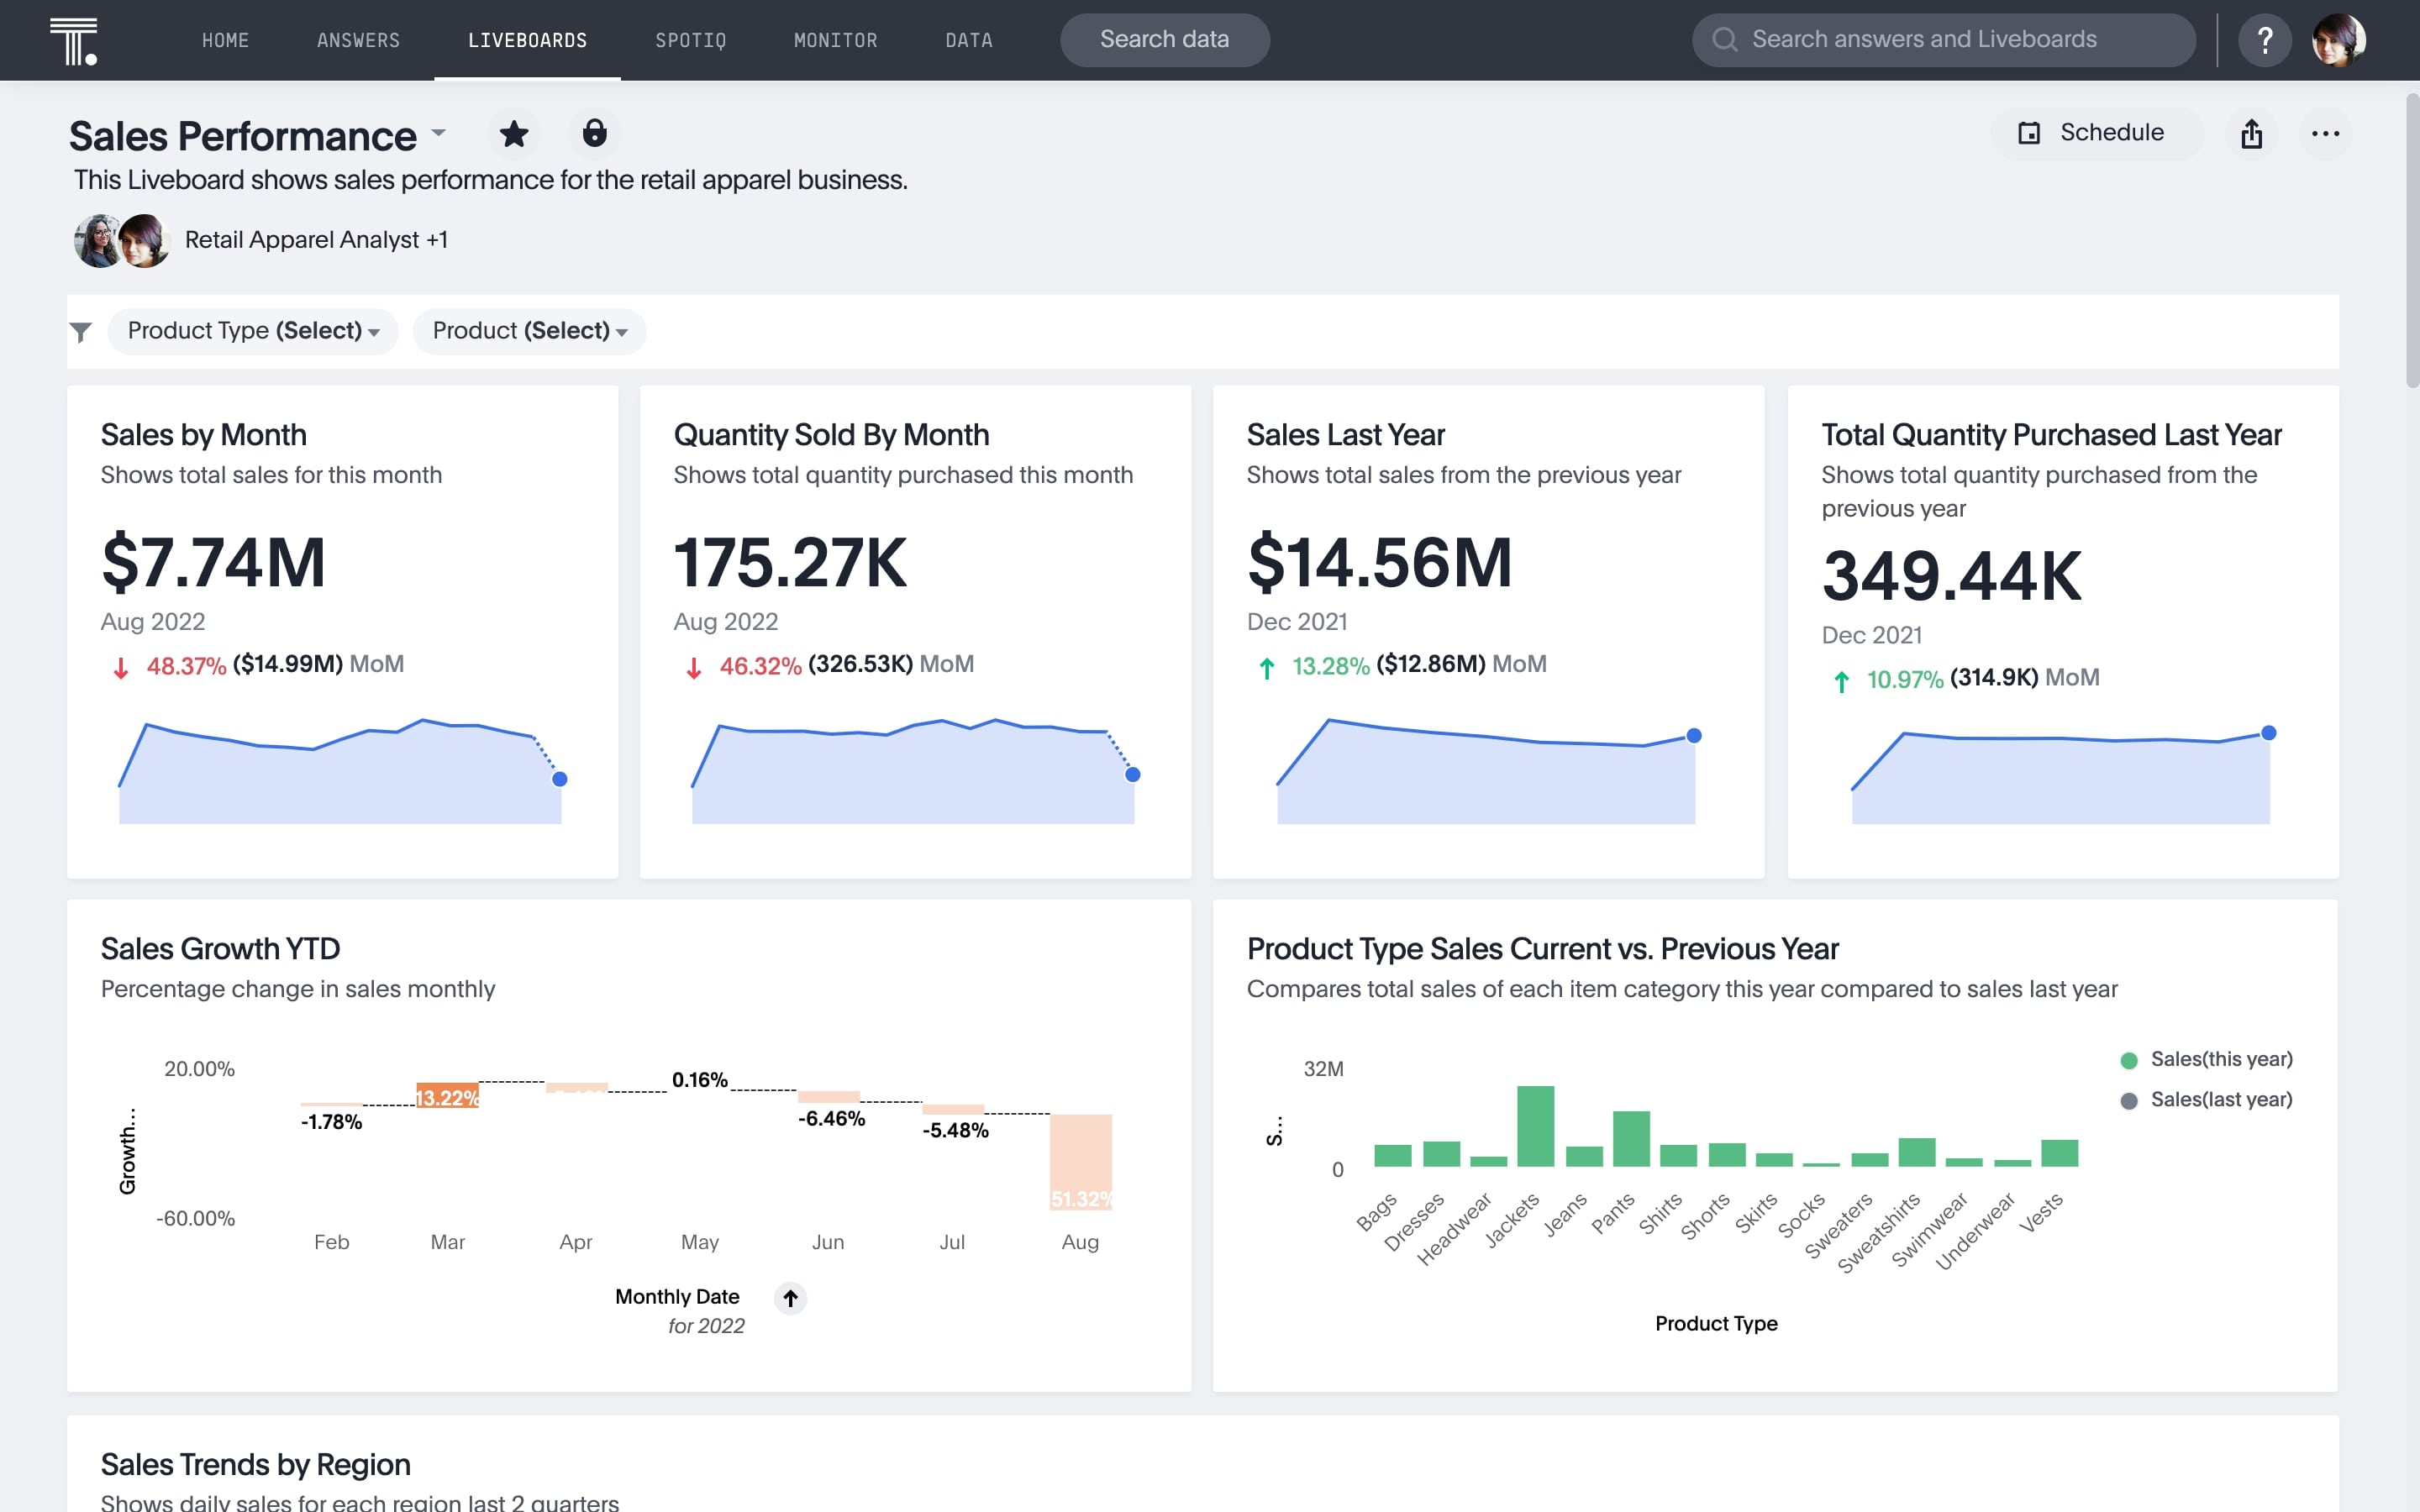
1. Sales growth dashboard
A sales growth dashboard provides a high-level overview of your company's sales performance, focusing on key financial metrics and growth indicators. It is designed to help businesses monitor and analyze their sales data to identify trends, set goals, and make informed decisions to drive sales growth.
Key metrics commonly included in a sales growth dashboard are:
Total revenue: Evaluates the total income generated from sales
Quarterly or annual growth percentage: Measures the increase in revenue over a specific period of time
Net profit: Calculates the profit as total revenue minus total expenses
Take a look at this sales growth dashboard example:
2. Sales pipeline dashboard
A sales pipeline dashboard provides an overview of the various stages of the sales process, from lead generation to deal closure. It offers insights into the performance and health of the sales pipeline. This helps the sales teams and management track progress, identify opportunities, and make informed decisions to optimize sales strategies.
Key metrics commonly included in a sales pipeline dashboard are:
Number of leads: Counts the number of potential customers in the sales pipeline
Number of opportunities: Tracks the potential sales opportunities
Conversion rate: Gives the percentage of leads that convert into customers
Average deal size: Analyses the typical size of closed deals
Sales cycle length: Calculates the time it takes to move a lead from initial contact to closing a deal

3. Sales KPI dashboard
Another dashboard example you can consider is a sales KPI dashboard, which focuses on key performance indicators (KPIs) crucial for assessing sales performance and making informed decisions. These dashboards provide a real-time or near-real-time view of critical sales-related metrics.
Key metrics commonly included in a sales KPI dashboard are:
Total revenue: Sums the revenue generated from sales
Conversion rate: Measures the effectiveness of converting leads into customers
Customer acquisition cost (CAC): Determines the cost of acquiring each new customer
Customer lifetime value (CLV): Predicts the total revenue a customer will generate throughout their relationship with the company
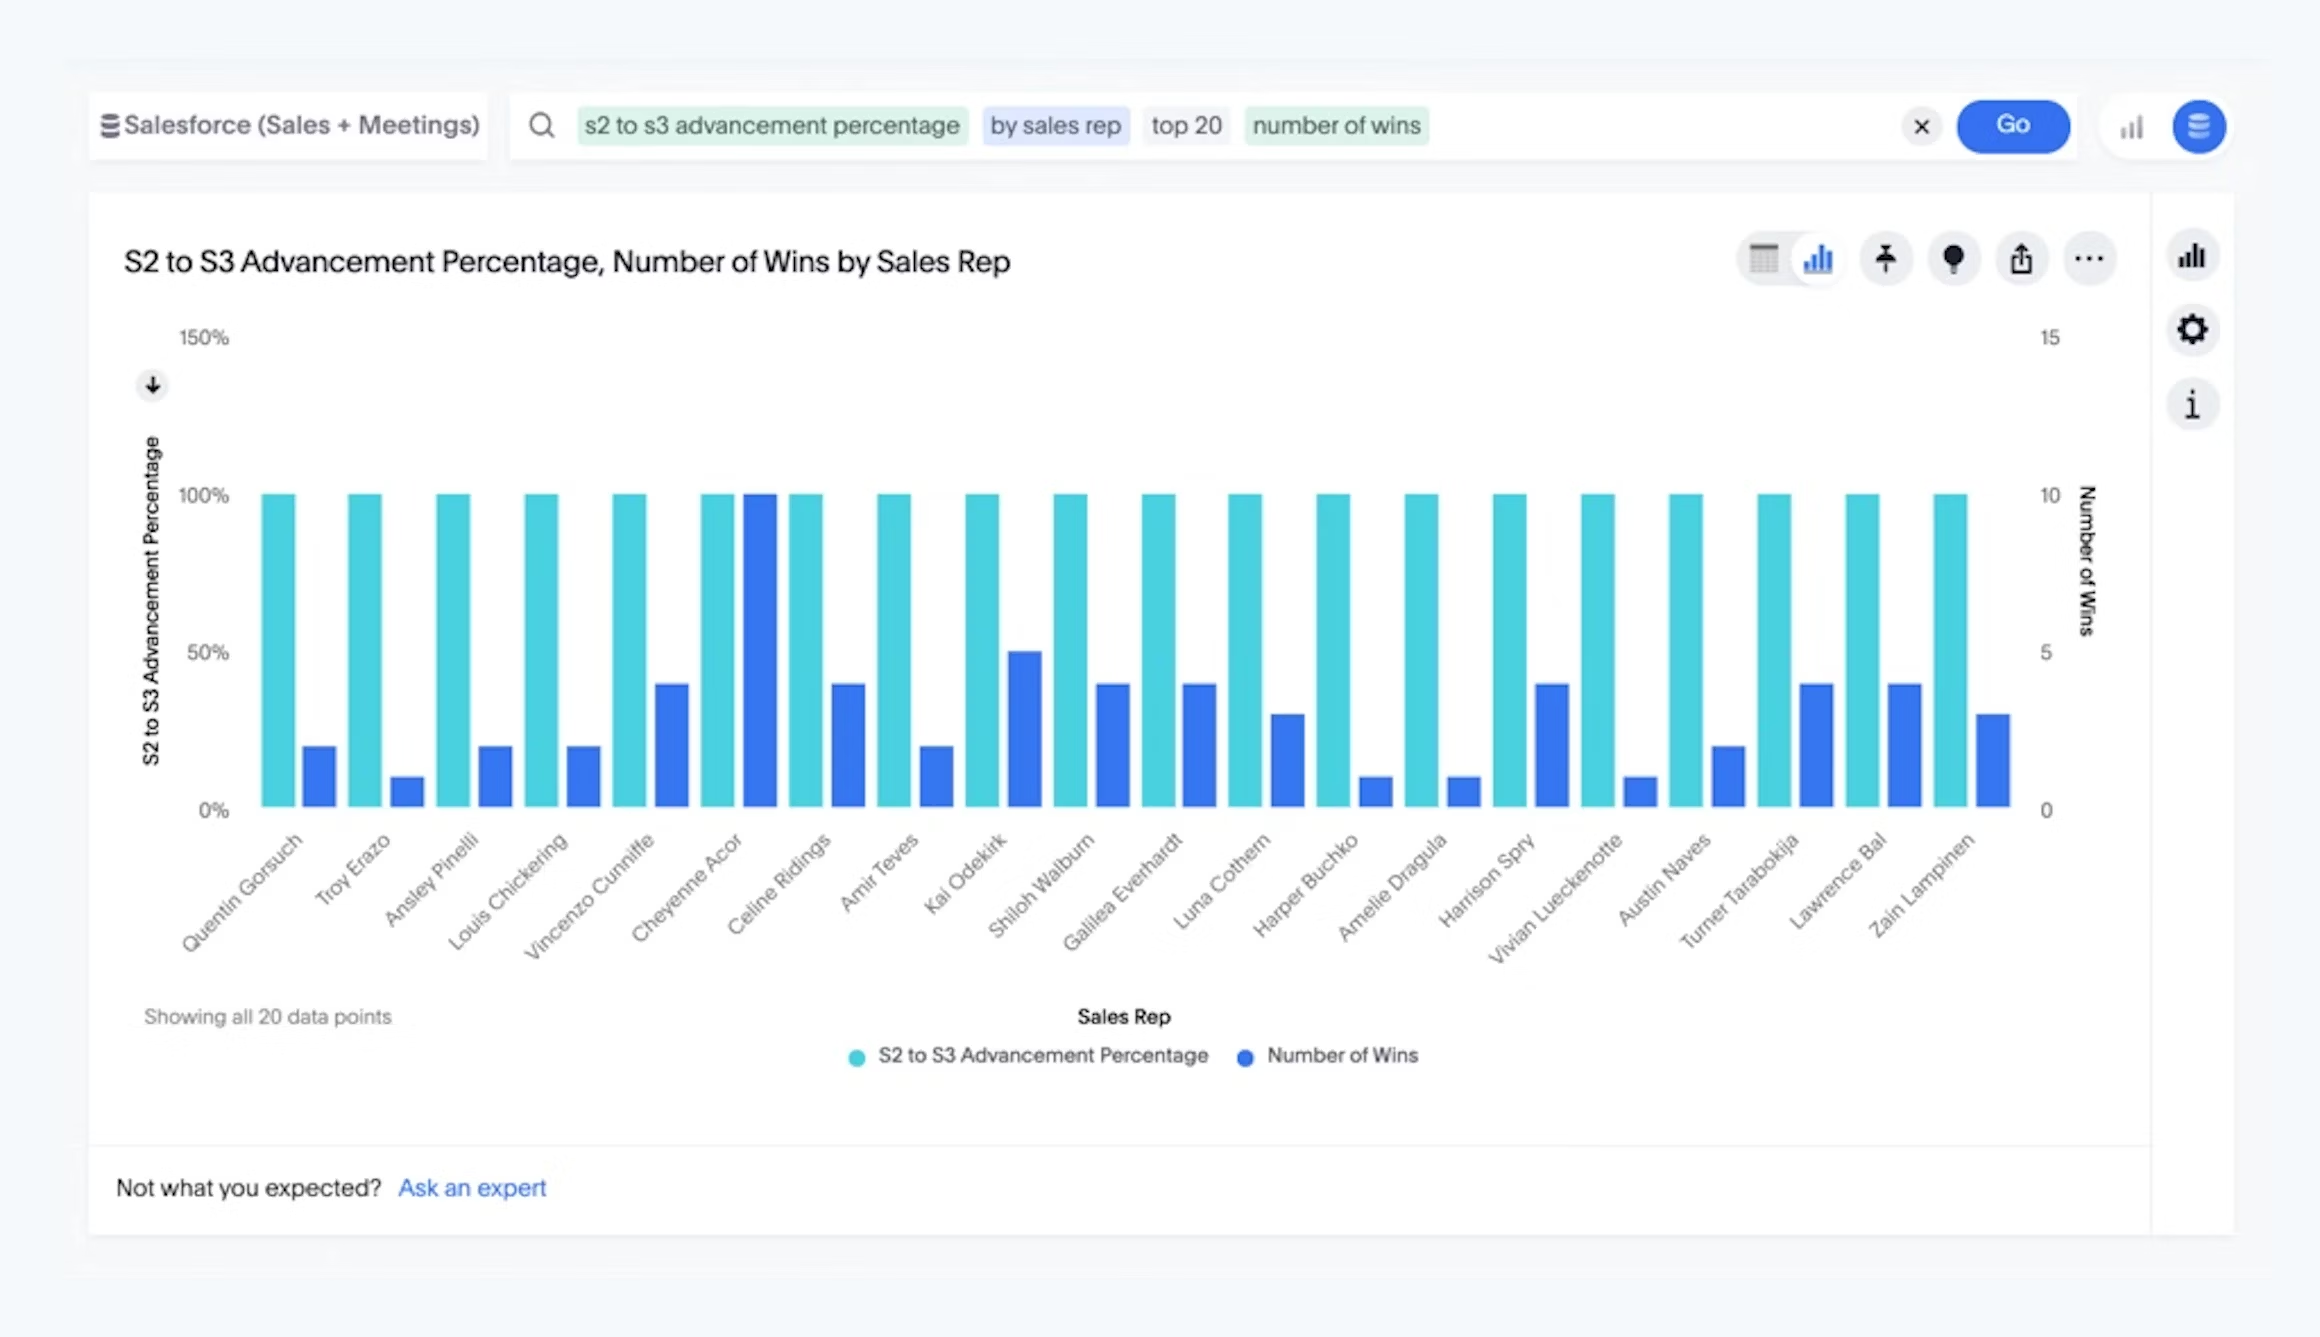
4. Sales manager dashboard
A sales manager dashboard is designed for sales team leaders. It offers insights into individual and team performance. This dashboard provides a real-time snapshot of essential information to track progress, identify trends, and optimize strategies.
Key metrics commonly included in a sales manager dashboard are:
Closed deals: Gives the number of deals successfully closed by each team member
Calls made: Records the number of calls made by sales representatives
Meetings scheduled: Logs the number of meetings or appointments set by the sales team
Team quotas: Compares individual performance against team goals
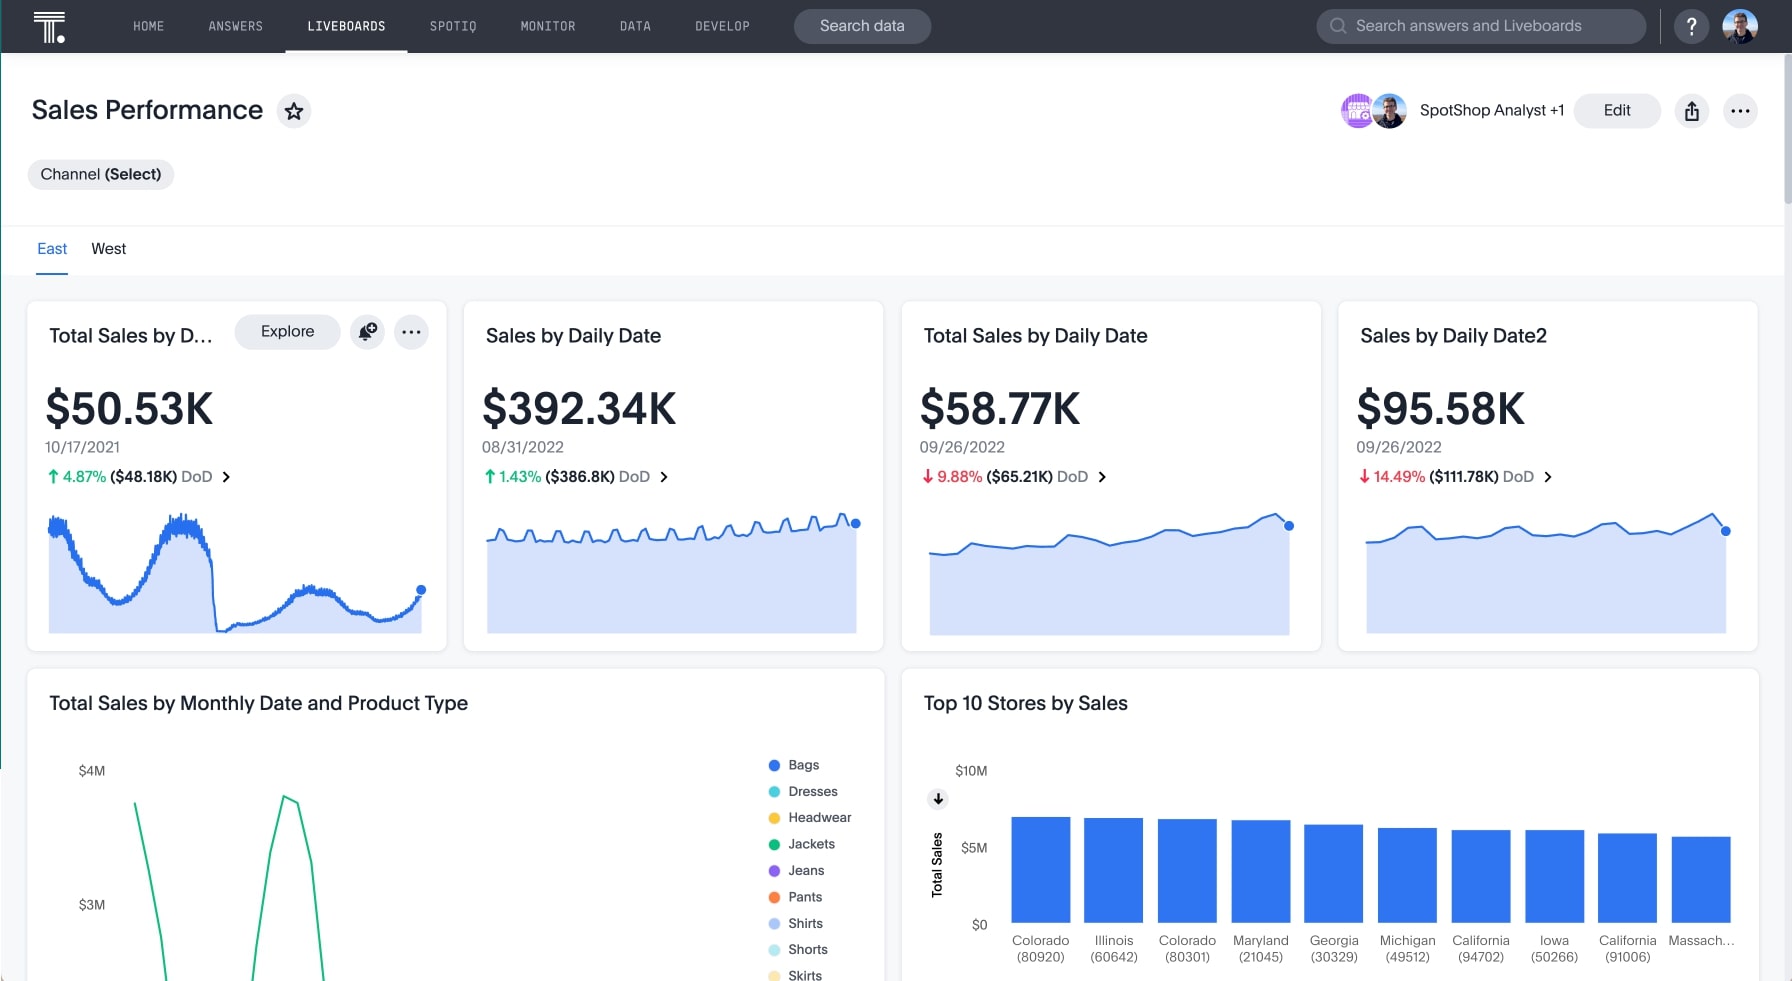
5. Sales performance dashboard
A sales performance dashboard provides an overview of how individual sales representatives are performing, including productivity and effectiveness metrics. Sales teams and management use these dashboards to monitor and analyze their sales operations.
Key metrics commonly included in a sales performance dashboard are:
Closed deals: Determines the number of deals successfully closed
Calls made: Measures the volume of calls made by the sales team
Emails sent: Tracks the number of emails sent by sales representatives
Other sales activities: Monitors various sales-related activities, such as product demos, presentations, or follow-ups
6. Account manager dashboard
An account manager dashboard focuses on existing customer relationships, customer satisfaction, and upsell opportunities. It provides a centralized view of data relevant to nurturing and growing those accounts.
Key metrics commonly included in an account manager dashboard are:
Customer satisfaction scores: Calculates the net promoter score (NPS) by gathering feedback from customers on their satisfaction with products or services
Upsell opportunities: Identifies potential opportunities to upsell or cross-sell to existing customers
Support ticket resolution times: Measures the time taken to resolve customer support issues
7. Executive sales dashboard
An executive sales dashboard offers a high-level view of the entire sales operation, combining key metrics from various areas to aid strategic decision-making. As a type of executive dashboard, it focuses on the most critical sales KPIs, enabling leadership to quickly assess performance and align sales strategies with broader business goals.
Key metrics commonly included in an executive sales dashboard are:
Total revenue: Calculates the overall revenue generated by the sales department
Sales growth percentage: Determines the growth in revenue over a specific period
Customer acquisition cost (CAC): Evaluates the cost of acquiring each new customer
Take a look at this high-level executive sales dashboard example:

8. Sales opportunity dashboard
A sales opportunity dashboard focuses on potential deals within the sales pipeline, highlighting high-value opportunities and their current status. It allows the team to track, manage, and analyze potential deals and prospects.
Key metrics commonly included in a sales opportunity dashboard are:
Deal size: Estimates the size or value of potential deals
Probability of closing: Assesses the likelihood of closing a deal
Expected close dates: Indicates when each opportunity is expected to be finalized
9. Sales metrics dashboard
A sales metrics dashboard offers a comprehensive view of key performance metrics and statistics related to your sales operation. It serves as a valuable tool for monitoring and analyzing sales-related data in real time or over specific time periods.
Key metrics commonly included in a sales opportunity dashboard are:
Sales revenue: Calculates the total income generated from sales
Conversion rates: Measures the effectiveness of converting leads into customers
Customer acquisition cost (CAC): Determines the cost of acquiring each new customer
Customer lifetime value (CLV): Predicts the total revenue a customer will generate throughout their relationship with the company
Churn rate: Tracks customer attrition to gauge the effectiveness of your retention strategies
Step 1: Define objectives
Begin by defining the objectives of your sales dashboard. What do you want to achieve? Identify the key metrics and KPIs you need to track to meet your goals.
Step 2: Select data sources
Determine the sources of data you'll need. This may include your CRM system, marketing automation tools, financial data, and other relevant sources. Verify that the data is accurate and up-to-date.
Step 3: Choose visualization tools
Select the right data visualization tools to represent your data effectively. Common ways to represent your data include bar charts, line graphs, pie charts, and tables.
Step 4: Design layout
Create a layout for your dashboard that is easy to understand and navigate. Organize the visual elements logically, so users can quickly access the information they need.
Step 5: Select key metrics
Identify the key metrics that are crucial for monitoring your sales performance. These metrics could include revenue, sales growth, conversion rates, lead generation, and customer acquisition costs, among others.
Step 6: Implement data integration
Use data integration tools to bring data from various sources into your dashboard. This ensures that your dashboard always displays up-to-date information.
Step 7: Set up alerts
Implement alerts to notify you of significant events or deviations from your KPIs. This allows for quick intervention when necessary.
Step 8: Customize for different users
Tailor your dashboard for different user groups. Sales managers, executives, and account managers may have unique data requirements, so make sure the dashboard caters to their specific needs.
Step 9: Test and optimize
Before launching your dashboard, thoroughly test it for usability and accuracy. Gather feedback from potential users and make improvements as required.
Step 10: Training
Provide training to your sales team on how to use the dashboard effectively. Ensure they understand its purpose and how to interpret the data.
Step 11: Regular updates
Your sales dashboard should be a dynamic tool that evolves with your business needs. Regularly update and refine it to reflect changing goals and priorities.
Now that you understand the importance of sales dashboards, it's time to take action. With ThoughtSpot, you can create intuitive and interactive sales dashboards that empower your team to make data-driven decisions, adapt to changing market conditions, and stay on top of your sales goals.
Don’t just take our word for it, check out what Amit K who created a sales dashboard using ThoughtSpot has to say:
The platform for the sales department is the best about ThoughtSpot. It gives the ground-level sales team the entire account data at our fingertips. At the same time, it has different modules for hierarchy which makes it easier for reporting.
Try ThoughtSpot for free and see how it can revolutionize the way you manage and analyze your sales data.


