


Within the dynamic world of finance, where data swiftly piles up, finance professionals become essential architects. Given the vast array of financial data, market trends, and economic indicators at your disposal, your team has the opportunity to extract meaningful patterns and insights. Each data point you collect holds the potential to shape strategic decisions and drive success. To grasp every data point, a financial dashboard is essential. It helps make sense of the numbers, ensuring that you can leverage the wealth of information available for informed decision-making, risk management, and overall financial success.
This article aims to explore a comprehensive range of financial dashboard examples, showcasing how they can enhance and improve your overall business performance.
Table of contents:
At its core, a financial dashboard is a visual representation of essential financial data. It provides a consolidated view of key performance indicators (KPIs) and metrics, allowing you to quickly grasp the financial status of your organization's expenses, sales, and profits. A financial dashboard presents complex financial data in simple and digestible formats, such as charts, graphs, and widgets.
By having the right finance dashboards, you can easily access key metrics like revenue, costs, profit, loss, and other important indicators. Here are a few ways these dashboards can help your organization:
Real-time data access: Financial dashboards provide real-time access to financial data, eliminating the need for manual data gathering and tedious spreadsheets. By having up-to-date information at your fingertips, you can quickly identify trends, spot potential issues, and make informed decisions that impact your bottom line.
Performance monitoring: With a financial dashboard, businesses can monitor various performance metrics in real-time. From revenue and expenses to profitability and cash flow, you can assess your organization's financial performance and identify areas that are performant, and others that might require attention.
Trend identification: Financial dashboards enable you to identify trends and patterns in your financial data. By analyzing historical financial information, you can uncover valuable insights that may help them predict future market trends or anticipate potential challenges.
Goal tracking: Financial dashboards allow organizations to set specific goals and track progress. You can measure actual performance against targets, identify gaps, and make necessary adjustments to ensure the organization remains on track to achieve its financial objectives.

1. Financial performance dashboard
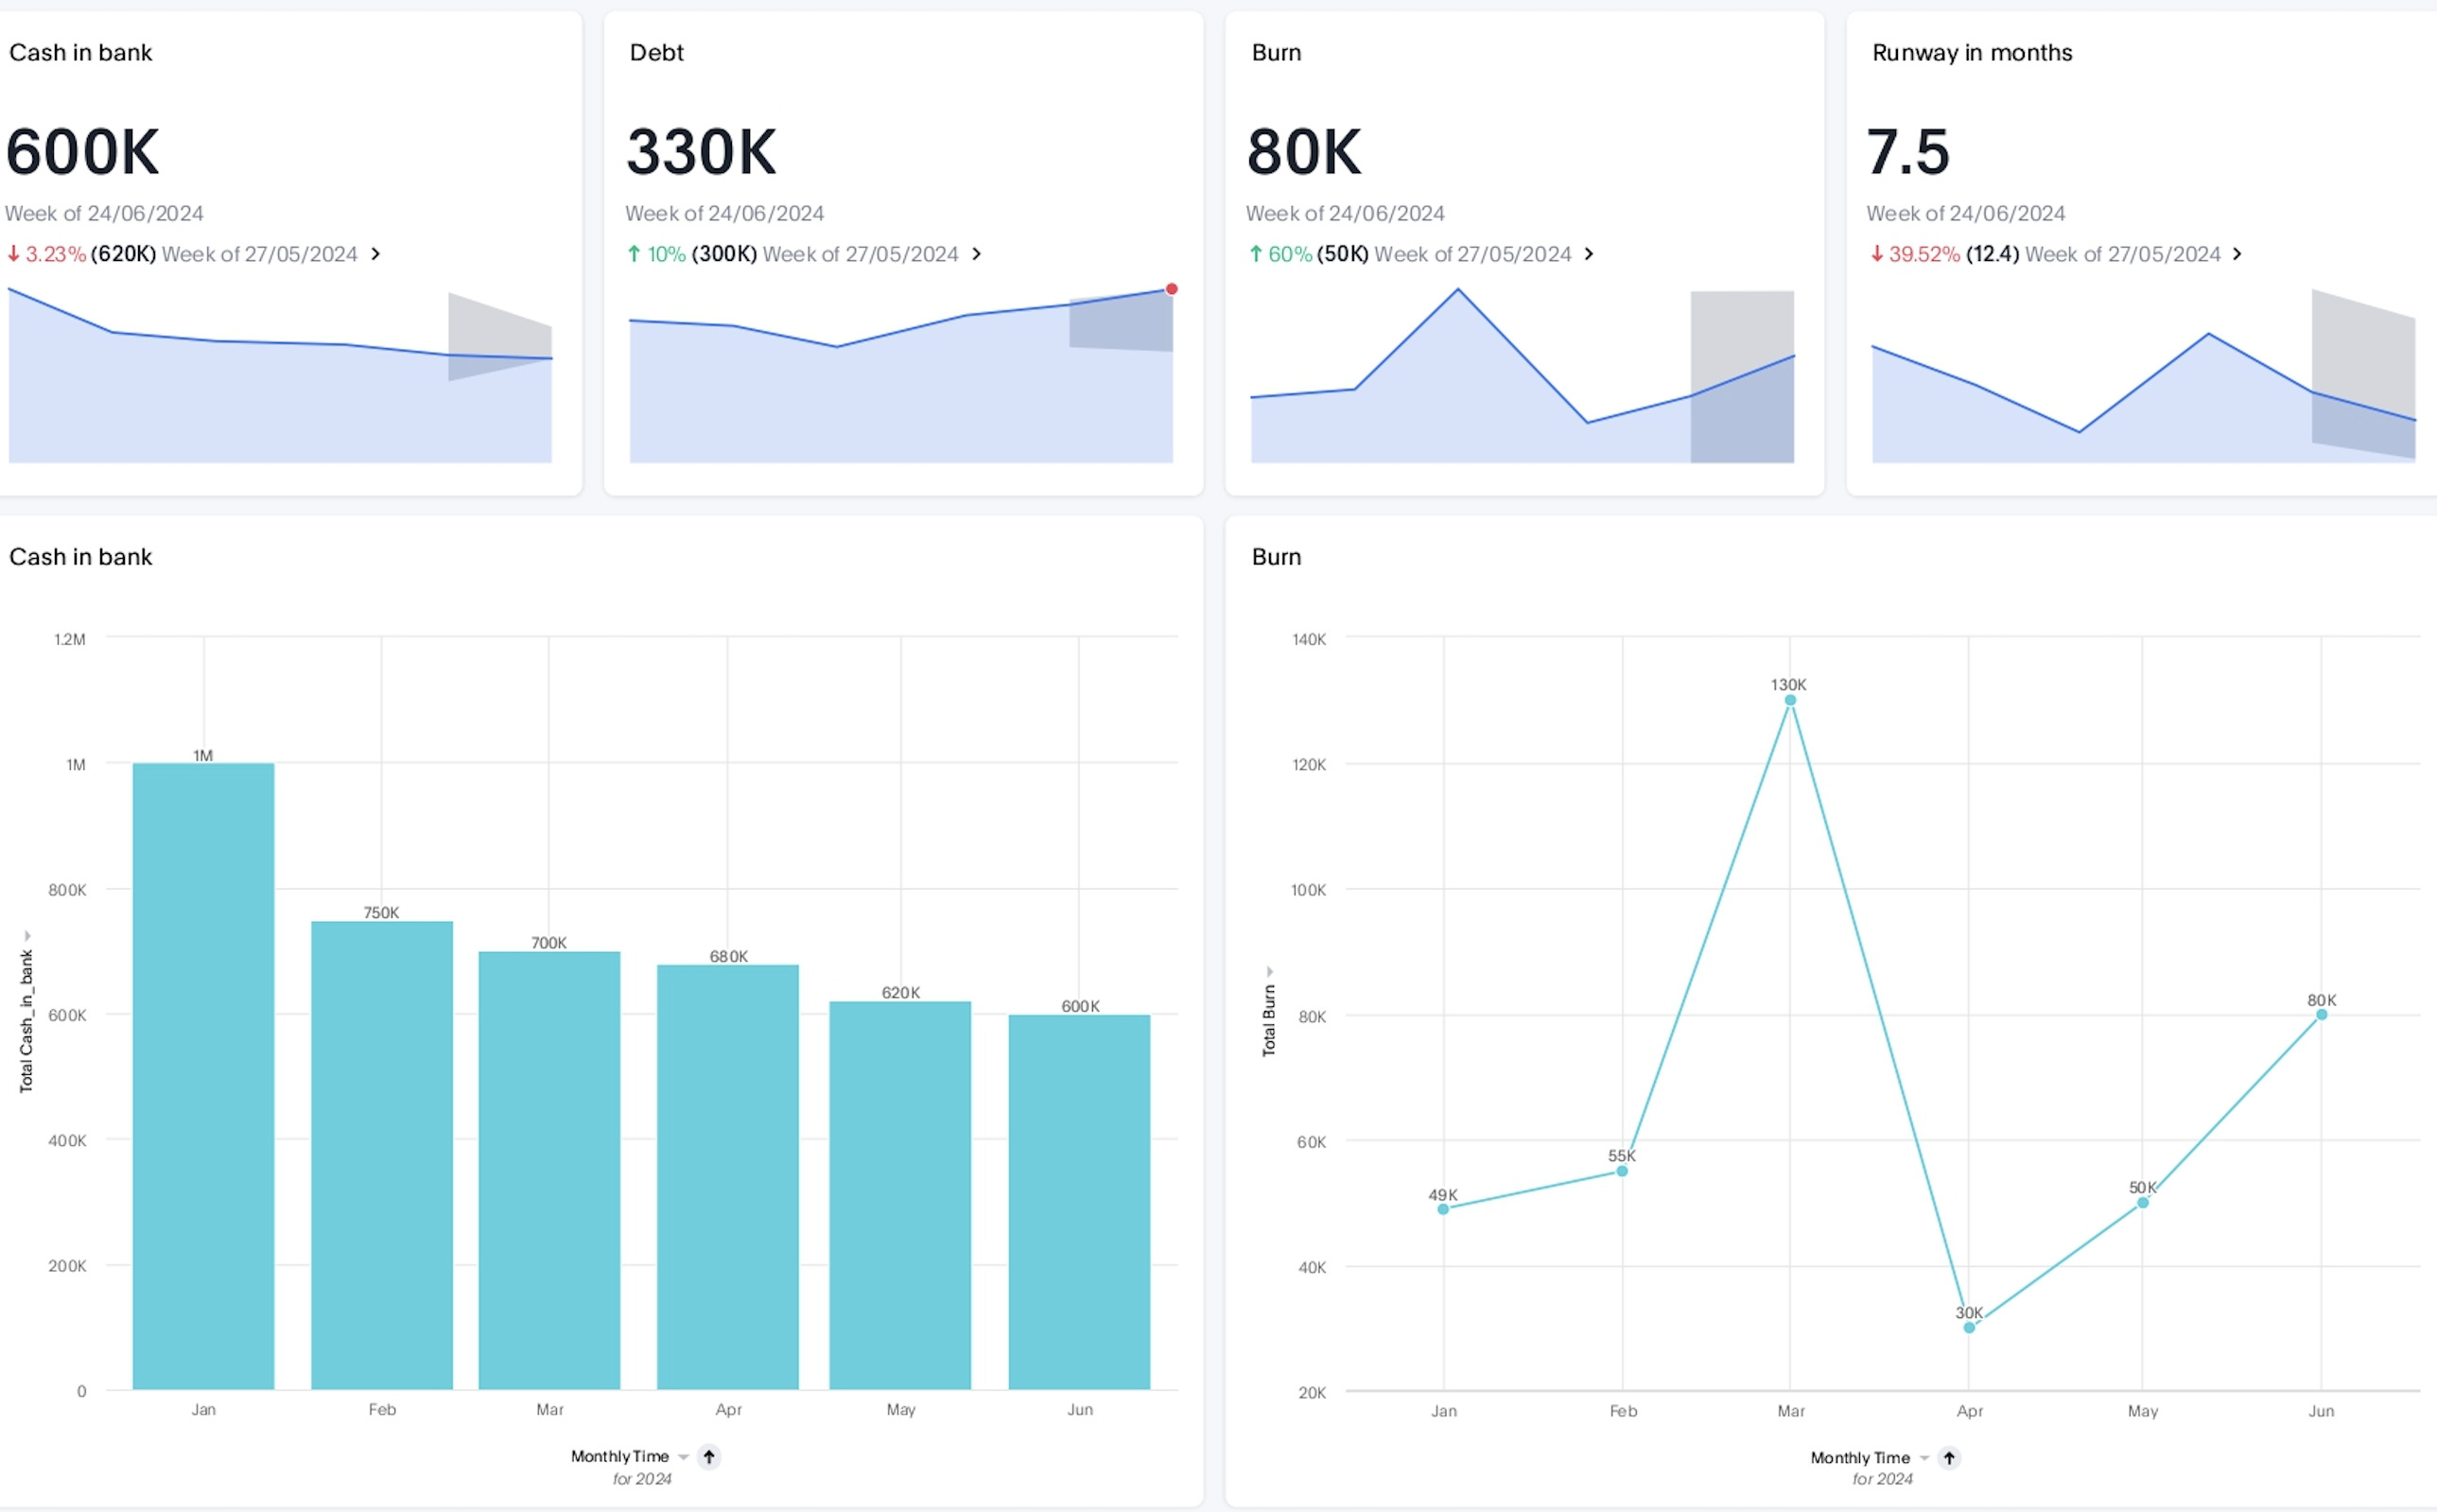
A financial performance dashboard is a visual representation of key financial metrics and indicators that provide a comprehensive overview of an organization's economic health and performance. It allows stakeholders, such as executives, managers, and investors, to quickly and easily assess the financial status of a company. The dashboard typically consolidates data from various financial sources into a single, accessible interface, making it an effective tool for decision-making and strategic planning.
Key metrics commonly included in a financial performance dashboard are:
Revenue: Total income generated by the business
Net profit: The amount by which revenue exceeds expenses. Calculated as total revenue minus total expenses
Gross margin: The percentage of revenue that exceeds the cost of goods sold
Operating income: Income generated from the core operations of the business
Cash flow: The amount of cash moving in and out of the business
Return on investment (ROI): The profitability of an investment relative to its cost
Debt-to-equity ratio: The ratio of a company's debt to its equity, indicating its financial leverage
Current ratio: A liquidity ratio measuring a company's ability to cover short-term liabilities with short-term assets
2. CFO dashboard
A Chief Financial Officer (CFO) dashboard is a specialized view designed to provide a high-level overview of key financial metrics and performance indicators relevant to the responsibilities of a Chief Financial Officer within an organization. This financial dashboard example is tailored to meet the strategic and financial management needs of the CFO, offering insights into various aspects of financial health, operational efficiency, and risk management. While a CFO dashboard dives deep into financial specifics, an executive dashboard offers a broader, more strategic view suited for company-wide oversight.
Key metrics commonly included in a CFO dashboard are:
Financial summary: Key financial metrics, including total revenue, net profit, and cash flow
Cash flow management: Net cash flow, representing the overall movement of cash in and out of the business
Profitability metrics: Gross profit margin, operating margin, and net profit margin to assess overall profitability
Expense breakdown: Detailed breakdown of expenses by category, identifying areas for cost optimization
Budget vs. actual: Comparison of planned budgeted amounts against actual financial results
Forecasting: Financial forecasts and projections for strategic planning
Debt management: Overview of debt levels and debt-to-equity ratio
Key performance indicators (KPIs): Customized KPIs relevant to financial goals and objectives
3. Executive dashboard
An executive dashboard is a specialized tool designed to provide top-level executives, including CEOs, COOs, and other key decision-makers, with a concise and visual summary of critical financial and operational metrics. This type of financial dashboard example is tailored to the needs of executives who require a high-level overview to make strategic decisions quickly and effectively.
The executive dashboard gives a big-picture view of how the whole company is doing. It focuses on important goals and trends to help top-level managers make strategic decisions. Whereas, the CFO dashboard offers a more detailed view of the company's finances.
Key metrics commonly included in an executive dashboard are:
Total revenue: Overall income generated by the organization
Net profit: Amount by which total revenue exceeds total expenses, indicating profitability
Cash flow: Net cash flow, representing the movement of cash in and out of the organization
Gross margin: Percentage of revenue exceeding the cost of goods sold, providing insights into profitability
Risk indicators: Metrics highlighting potential financial risks or deviations from expected performance
Executive summary: A concise summary of key financial insights and actionable items
4. Cash flow dashboard
A cash flow dashboard provides a visual representation and insights into the cash flow performance of an organization. This type of financial dashboard is particularly focused on monitoring the inflow and outflow of cash, which is crucial for assessing the liquidity and financial health of a business.
Key metrics commonly included in a cash flow analysis dashboard are:
Net cash flow: Overall movement of cash in and out of the business
Operating cash flow: Cash generated or used by core operational activities
Cash inflows: Breakdown of sources contributing to cash inflows
Cash outflows: Breakdown of uses of cash, including expenses and debt repayments
Free cash flow: Cash generated after covering capital expenditures
Cash flow forecast: Projection of expected future cash flows
Cash reserves: Visualization of cash reserves, indicating liquidity
5. Sales and marketing financial dashboard
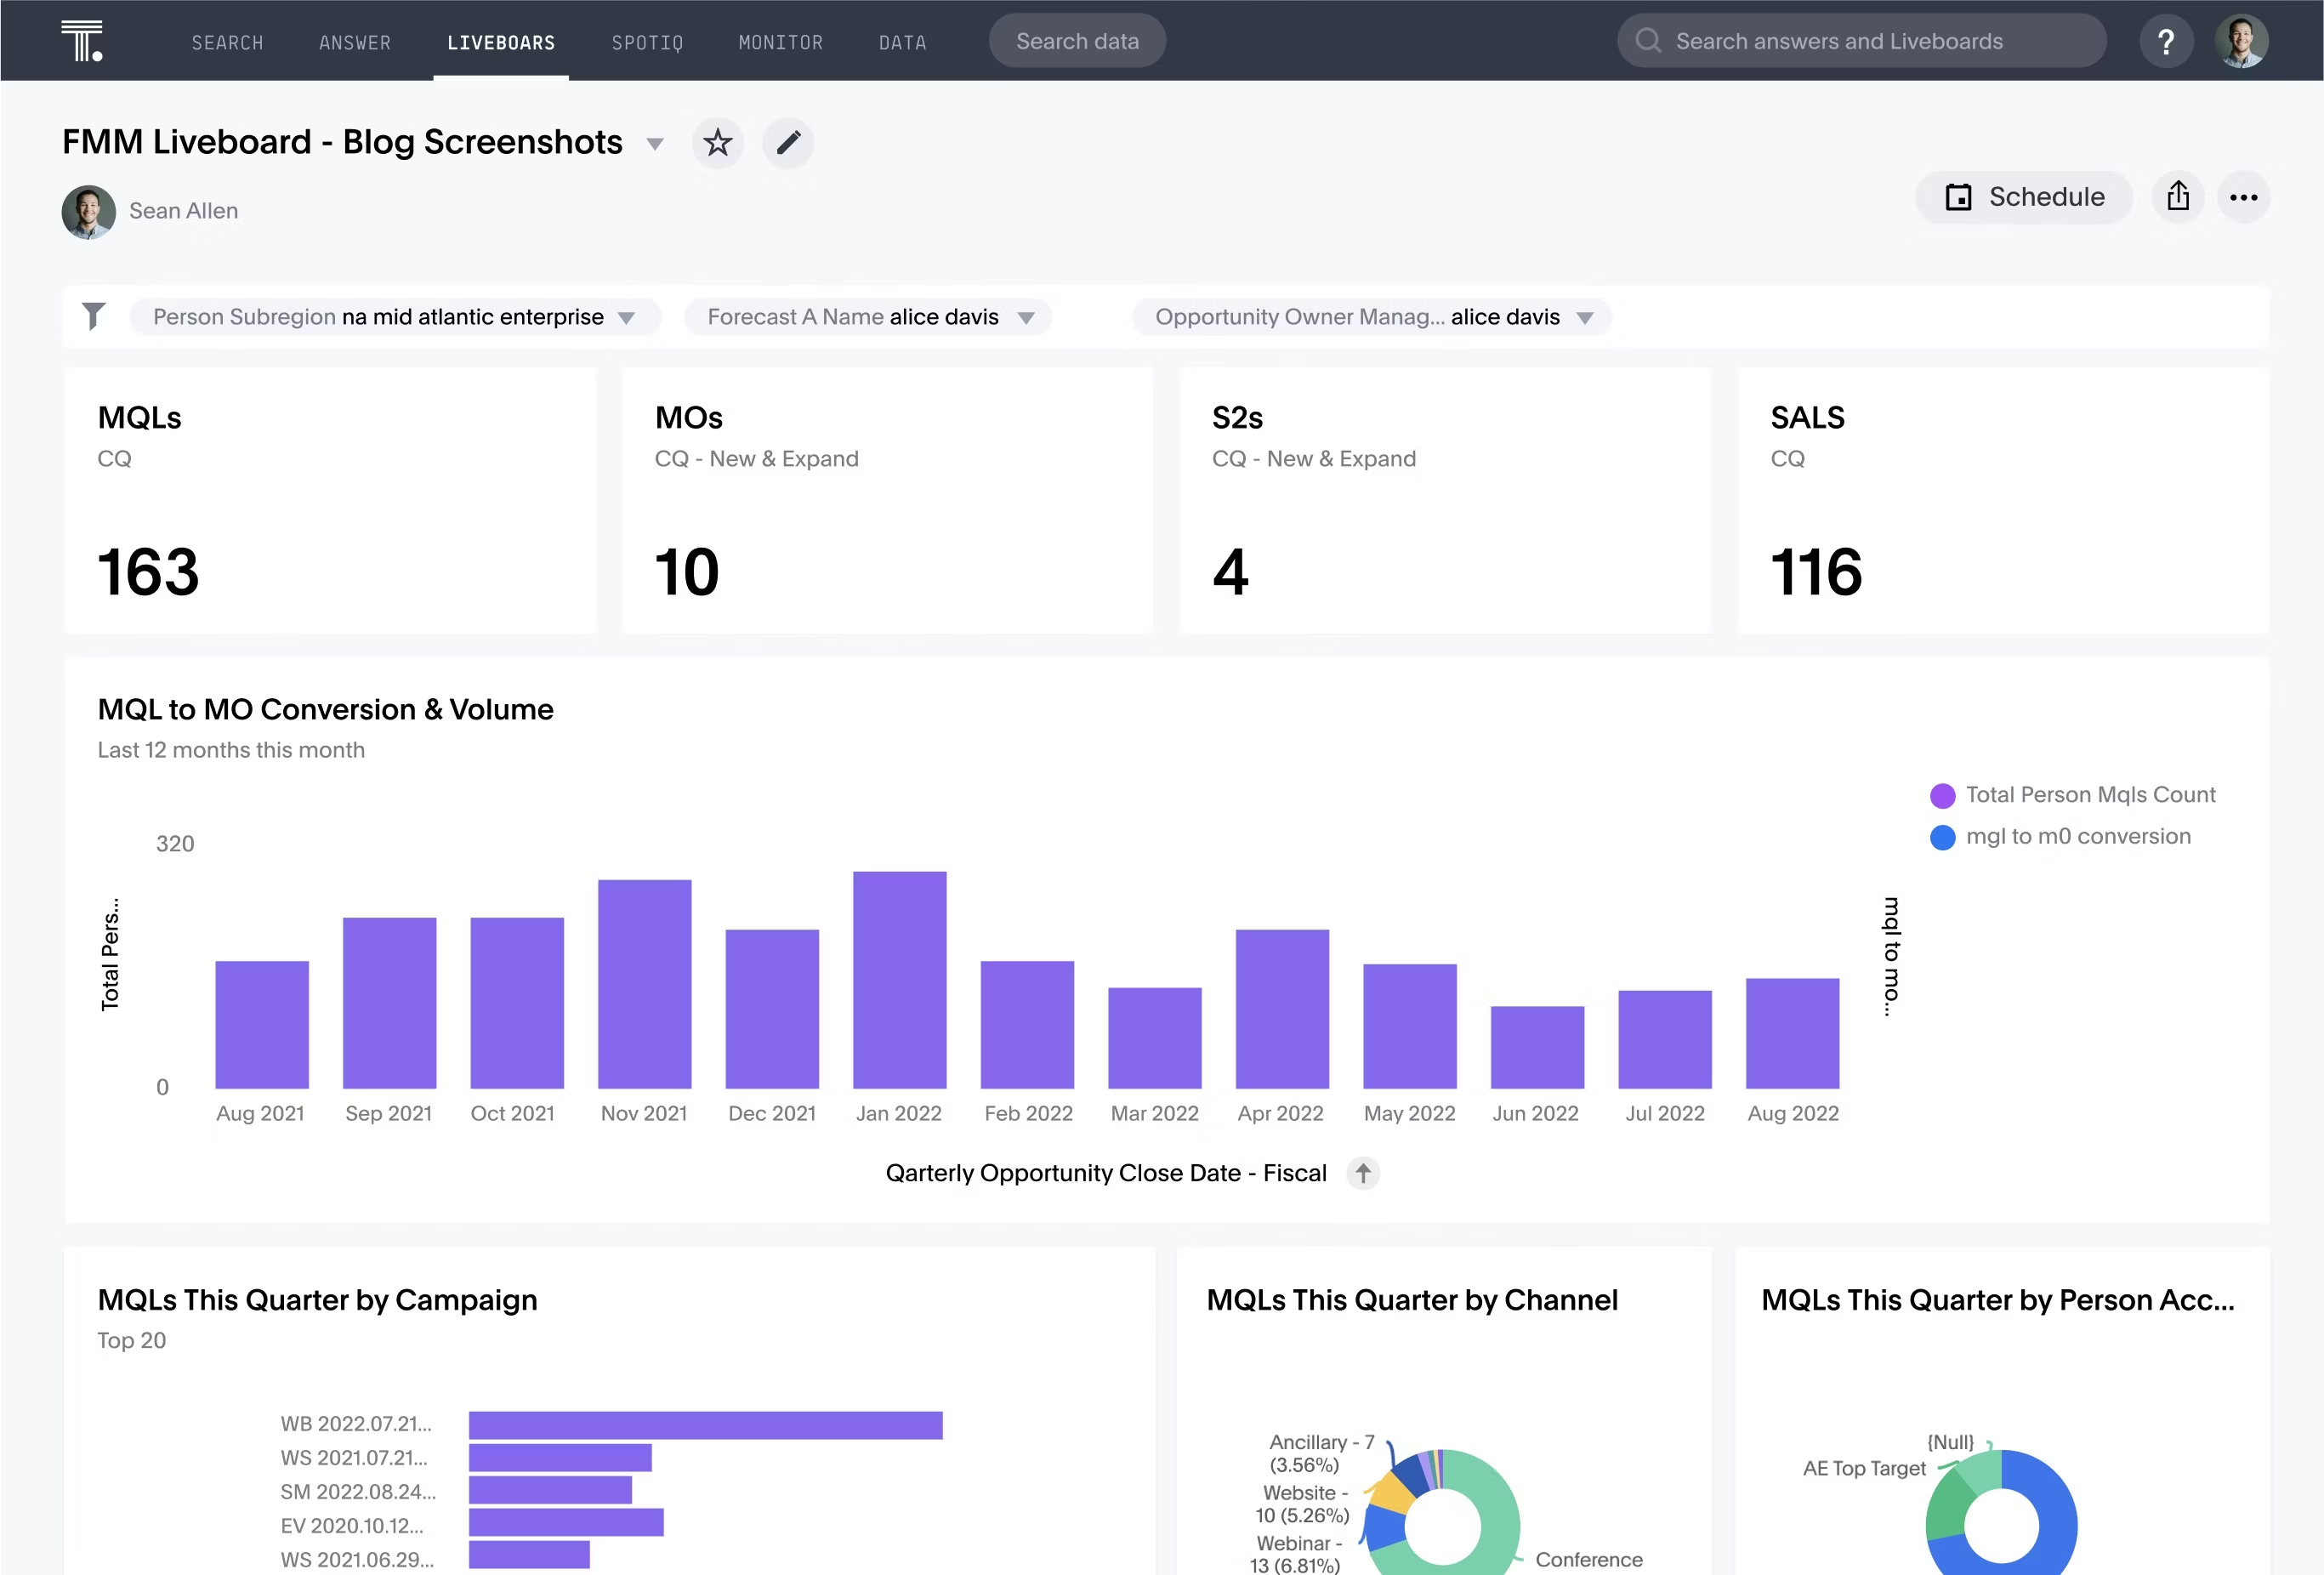
A sales and marketing financial dashboard is a visual representation of key performance indicators (KPIs) and metrics related to the sales and marketing activities of a business. It provides a comprehensive and real-time overview of the financial aspects associated with the sales and marketing efforts. The purpose of such a dashboard is to help businesses monitor, analyze, and optimize their sales and marketing strategies to improve overall go-to-market performance and profitability.
Key metrics commonly included in a sales and marketing financial dashboard are:
Revenue: Total income from sales
Sales growth: Percentage increase or decrease in sales
Customer acquisition cost (CAC): Cost associated with acquiring a new customer
Marketing ROI: Effectiveness of marketing campaigns
Conversion rates: Percentage of leads converted to customers
Customer lifetime value (CLV): Predicted net profit from a customer
Customer retention rate: Percentage of retained customers
Financial dashboards play a pivotal role in enhancing decision-making processes, streamlining operations, and ensuring financial stability within organizations. By providing real-time, visual insights into key financial metrics like budget, revenue, growth, etc, these dashboards empower you to navigate the complexities of the business landscape with confidence.
As the demand for data-driven solutions increases, the choice of the right dashboard software becomes pivotal. ThoughtSpot, with its user-friendly interface and AI-Powered Analytics, rises amongst the rest. It's the definitive solution for unlocking the full potential of your data-driven journey. See how you can use ThoughtSpot and make smarter financial decisions - schedule a free demo today.


