


Ever noticed a dip in conversions—only to realize it’s already cost you a week’s worth of revenue?
That’s the problem with most dashboards.
They tell you what went wrong after it’s too late to fix anything. By the time you’ve filtered the data or pinged your analyst, the damage is already done.
That’s the true cost of static dashboards. They just can’t keep up with how fast your business evolves.
Now imagine the opposite: a real-time dashboard that shows you what’s happening. You can play around with types of charts, see trends pop out, and spot patterns right as they unfold.
This isn’t just faster reporting—it’s real-time, actionable analytics built to move at the speed of your business.
Table of contents:
Real-time dashboards give you a live, interactive view of what’s really happening across your business. They display up-to-the-minute metrics across your teams, products, and processes, making it easy to identify trends, spot issues, and take action the moment something changes.
Instead of piecing together data from different tools, you get everything you need in one place. That means faster decisions, more proactive moves, and better experiences for your customers.
Say your sales performance drops. With a traditional dashboard, you might not be able to spot the trend until next week’s report. But with real-time analytics, you catch the shift immediately.
A few minutes of digging and you find there’s a broken signup form. You fix it on the spot, launch a quick re-engagement campaign, and start pulling those leads back in before they disappear for good.
Live data updates: Automatically refreshes as new data comes in—no waiting on batch processing or manual refreshes. You’re always working with the most current view.
Customizable layouts: Focus on what matters most. Drag and drop KPIs, charts, tables, and maps to build a dashboard tailored to your goals and workflows.
Data filters: Quickly zoom in on what you need. Filter data by time period, region, user segment, or product type to get to the right insights fast.
Intelligent alters: Know the moment something changes.. Smart alerts use logic, trends, and AI to notify you when KPIs spike or drop unexpectedly, empowering you to act before the issue snowballs.
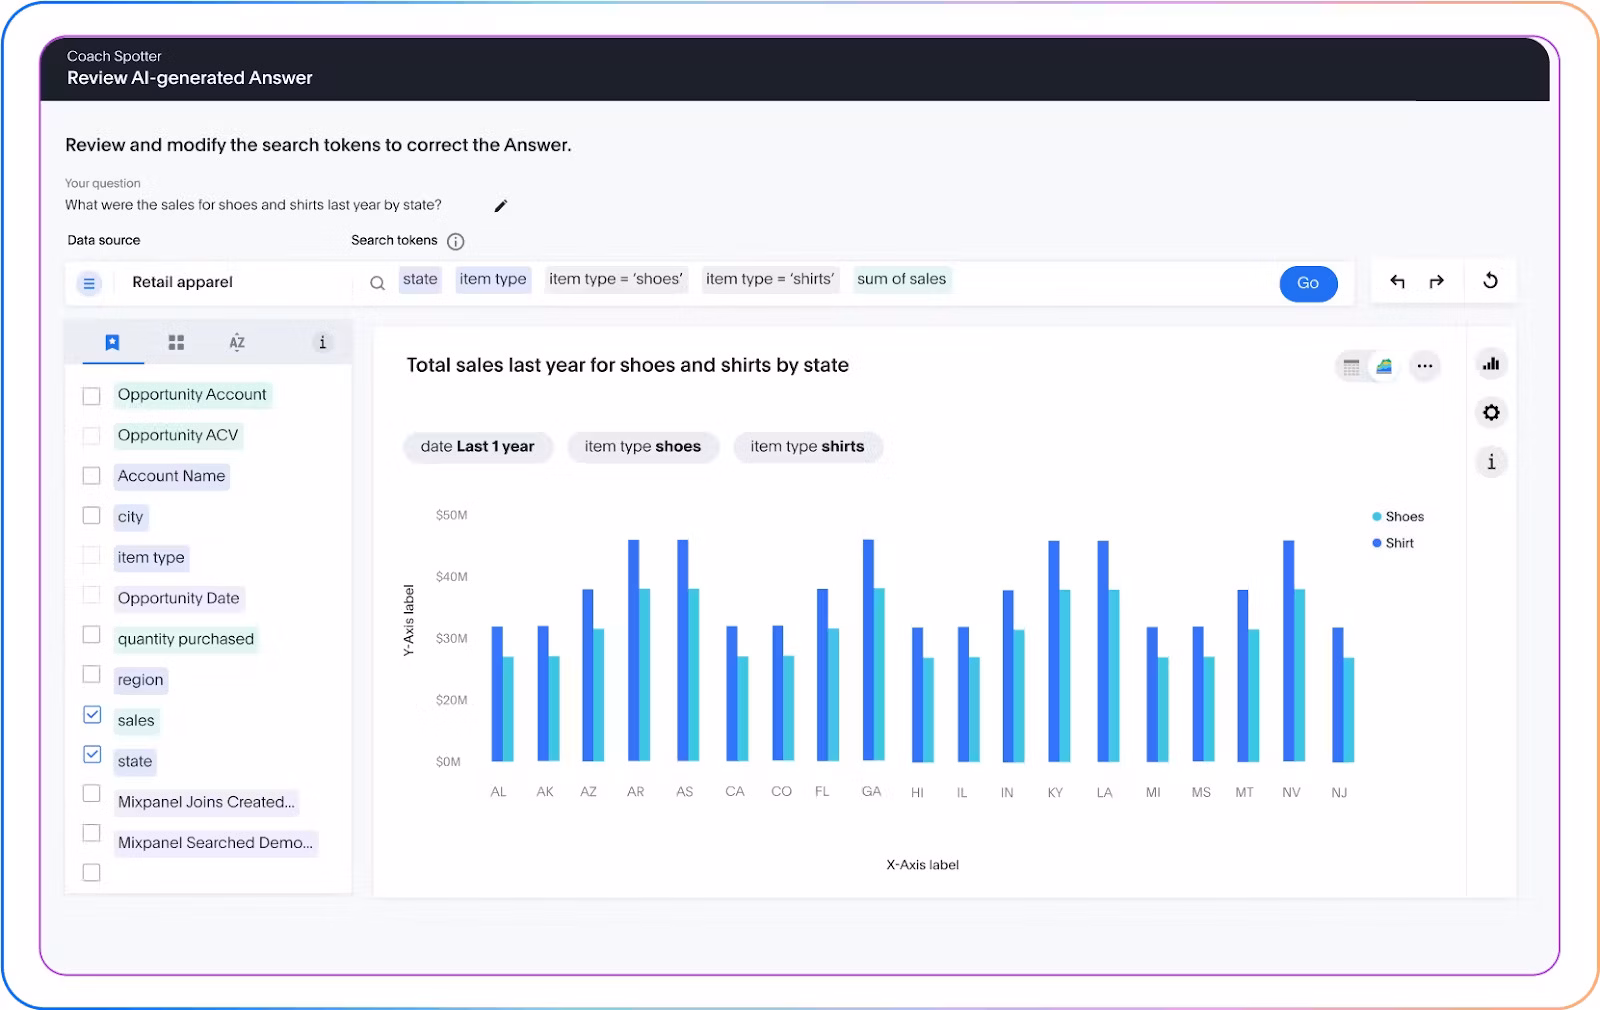
AI features: Discover hidden patterns with AI-powered tools. Platforms like ThoughtSpot offer built-in AI Analyst like Spotter that deliver real, contextual answers in minutes.
Sharing and exporting: Easily share live dashboards, export visuals, or send reports to keep stakeholders informed, wherever they are.
Now that we’ve covered what real-time dashboards do, let’s jump into some real examples. These should give you practical ideas for building your own dashboards.
As a business leader, your decisions shape everything from revenue to morale. But if you’re making those calls based on last week’s numbers, you’re putting your business at risk.
Real-time executive dashboards consolidate live data from every critical function—including sales, support, operations, and finance—into a single, up-to-the-minute view. You can immediately see what’s working, what needs to be fixed, and where to double down. Whether you’re adjusting strategy mid-quarter or chasing a new growth opportunity, these data-driven insights give you the clarity to act with confidence.
Compliance is a minefield. One buried clause, one missed contract renewal date, and suddenly, you’re dealing with fines, audits, and damaged partnerships.
Legal and compliance dashboards help you stay ahead of the chaos by offering real-time alerts on policy breaches, contract expirations, and potential audit risks. It’s like having a radar that constantly scans for red flags, so your team can fix problems before they escalate into headaches.
When your app slows down or crashes, users won’t wait—they bounce. And once trust is gone, it’s hard to earn back.
Real-time dashboards help you pinpoint friction issues the moment they happen. Spikes in latency? A surge in 404 errors? You’ll see it before your customers do.
That means fewer bug fixes, faster iteration cycles, and a smoother user experience.
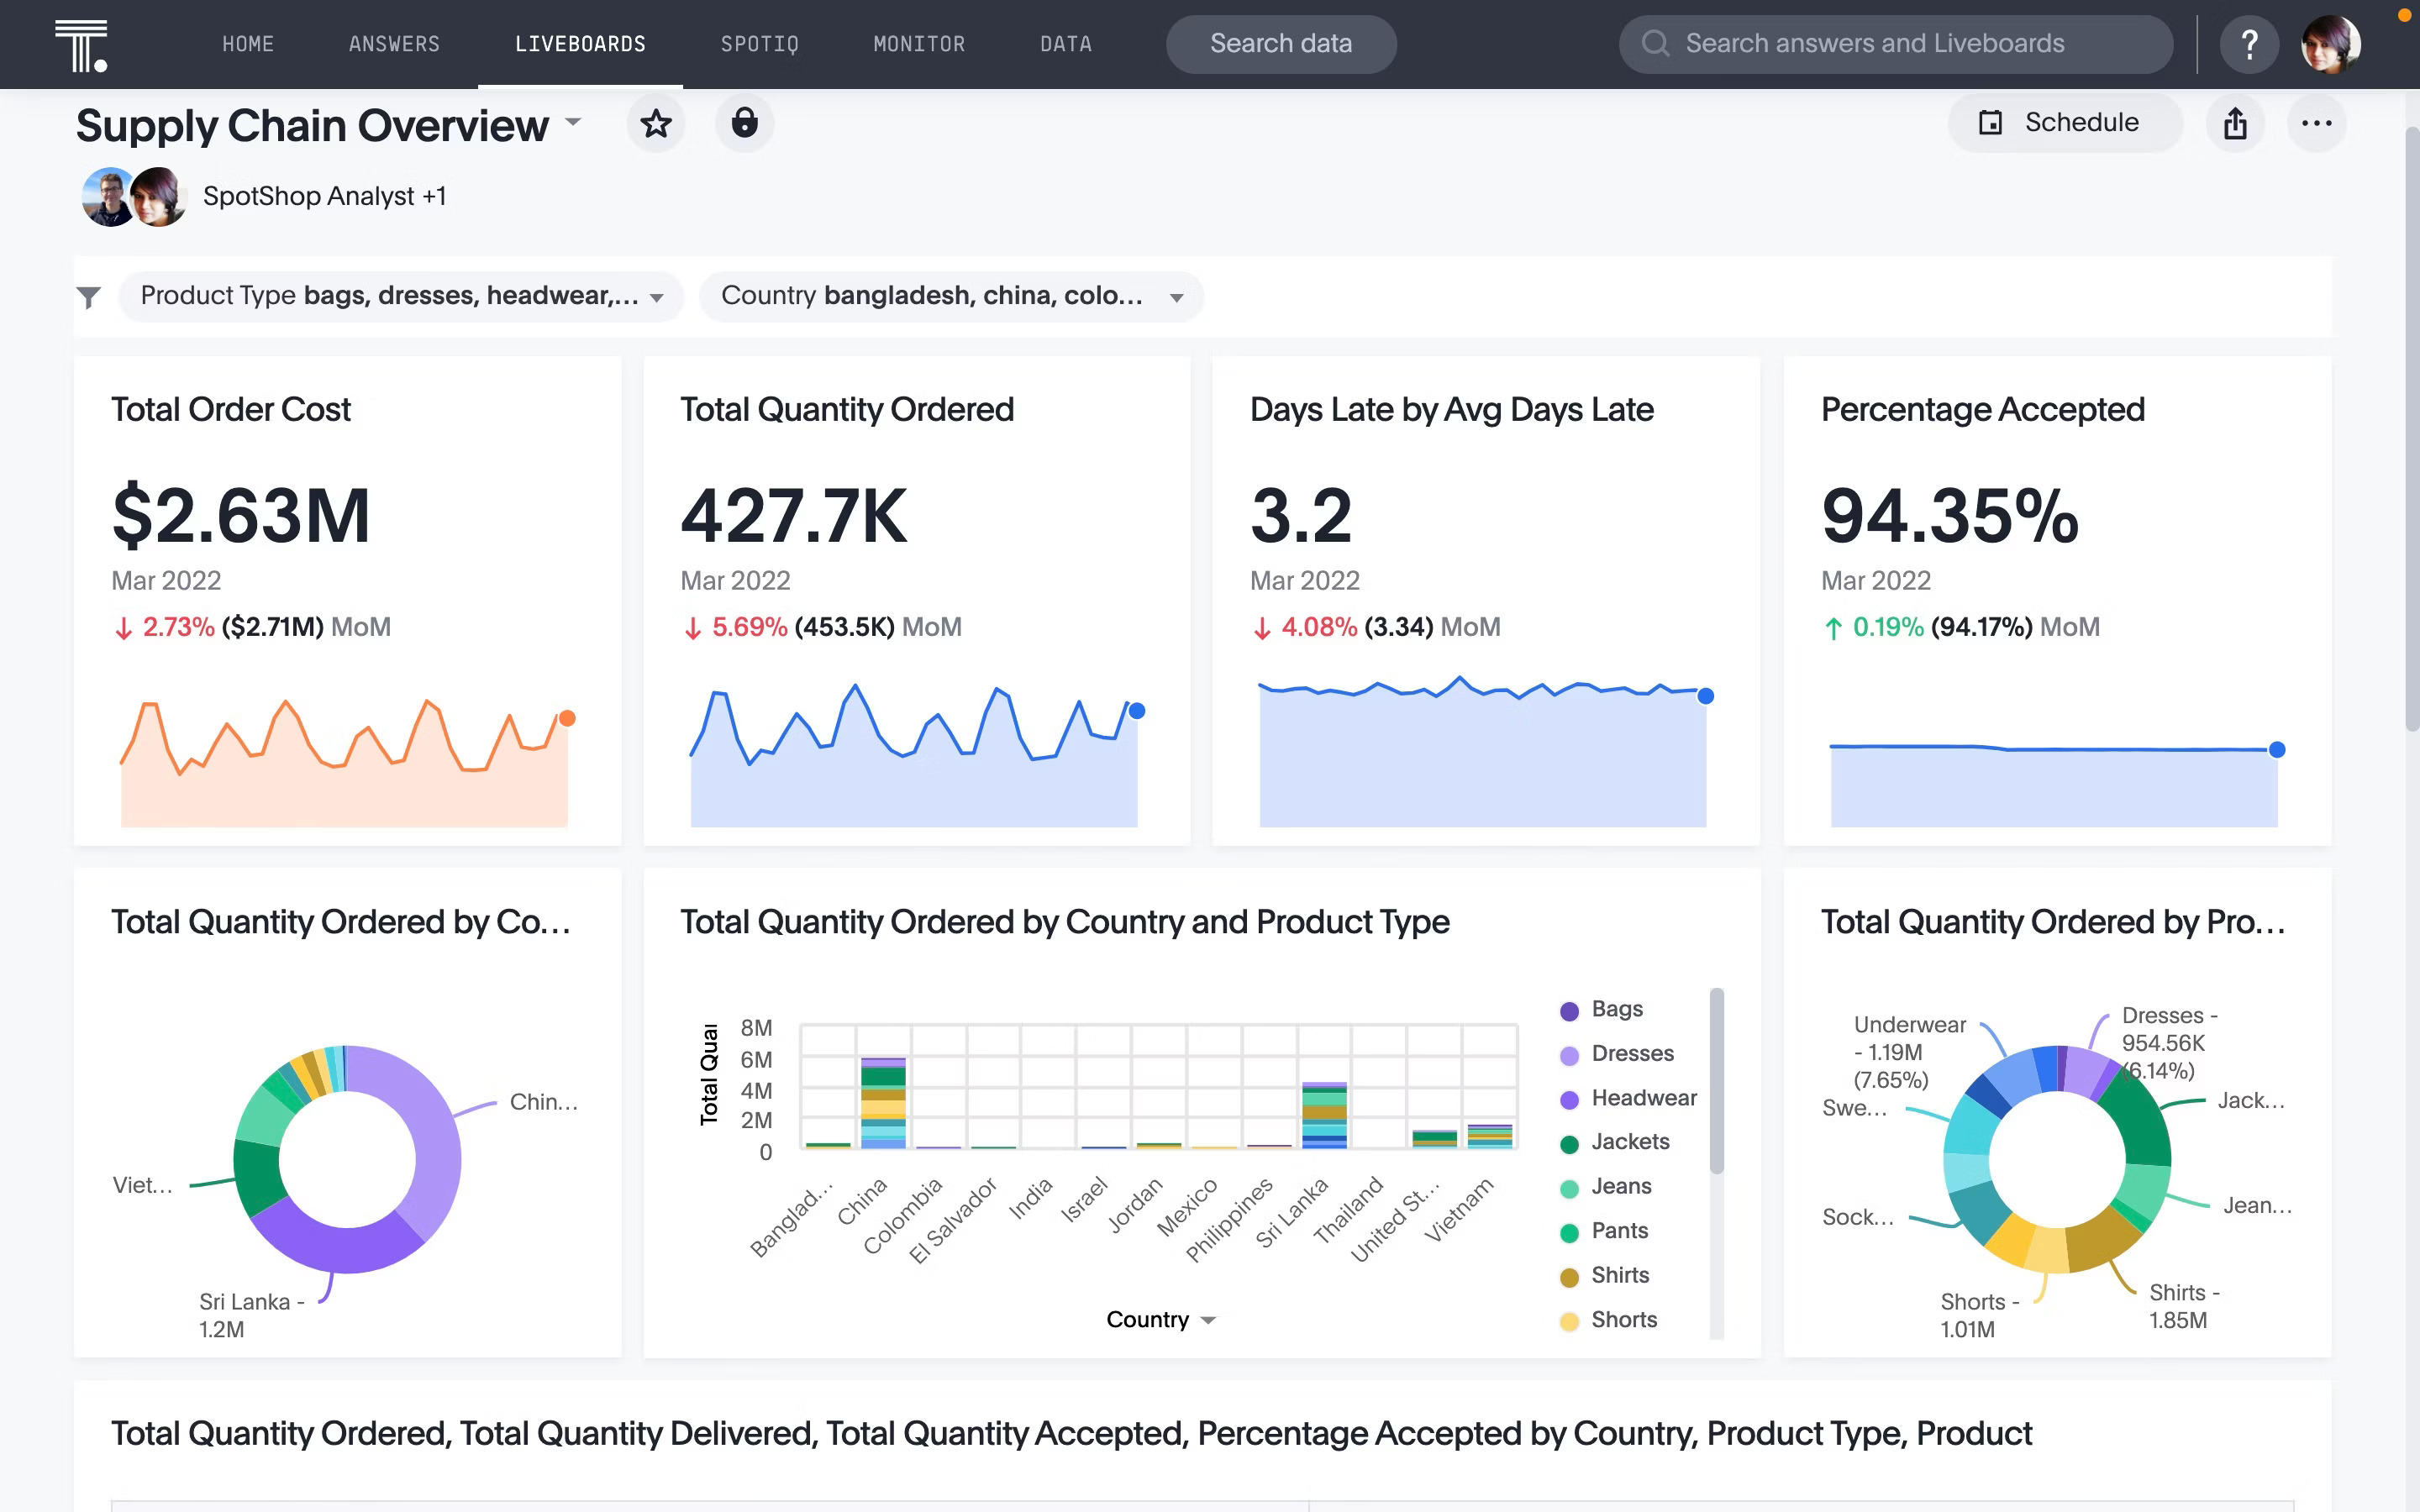
When a key shipment gets delayed and no one catches it, the fallout can spread fast: frustrated customers, canceled orders, and your team scrambling to respond.
That’s the kind of chaos a live operations dashboard helps you avoid. It gives your team instant visibility into inventory, order statuses, and delivery routes. So when your team identifies a bottleneck, they can step in early, reroute, restock, and keep things moving.
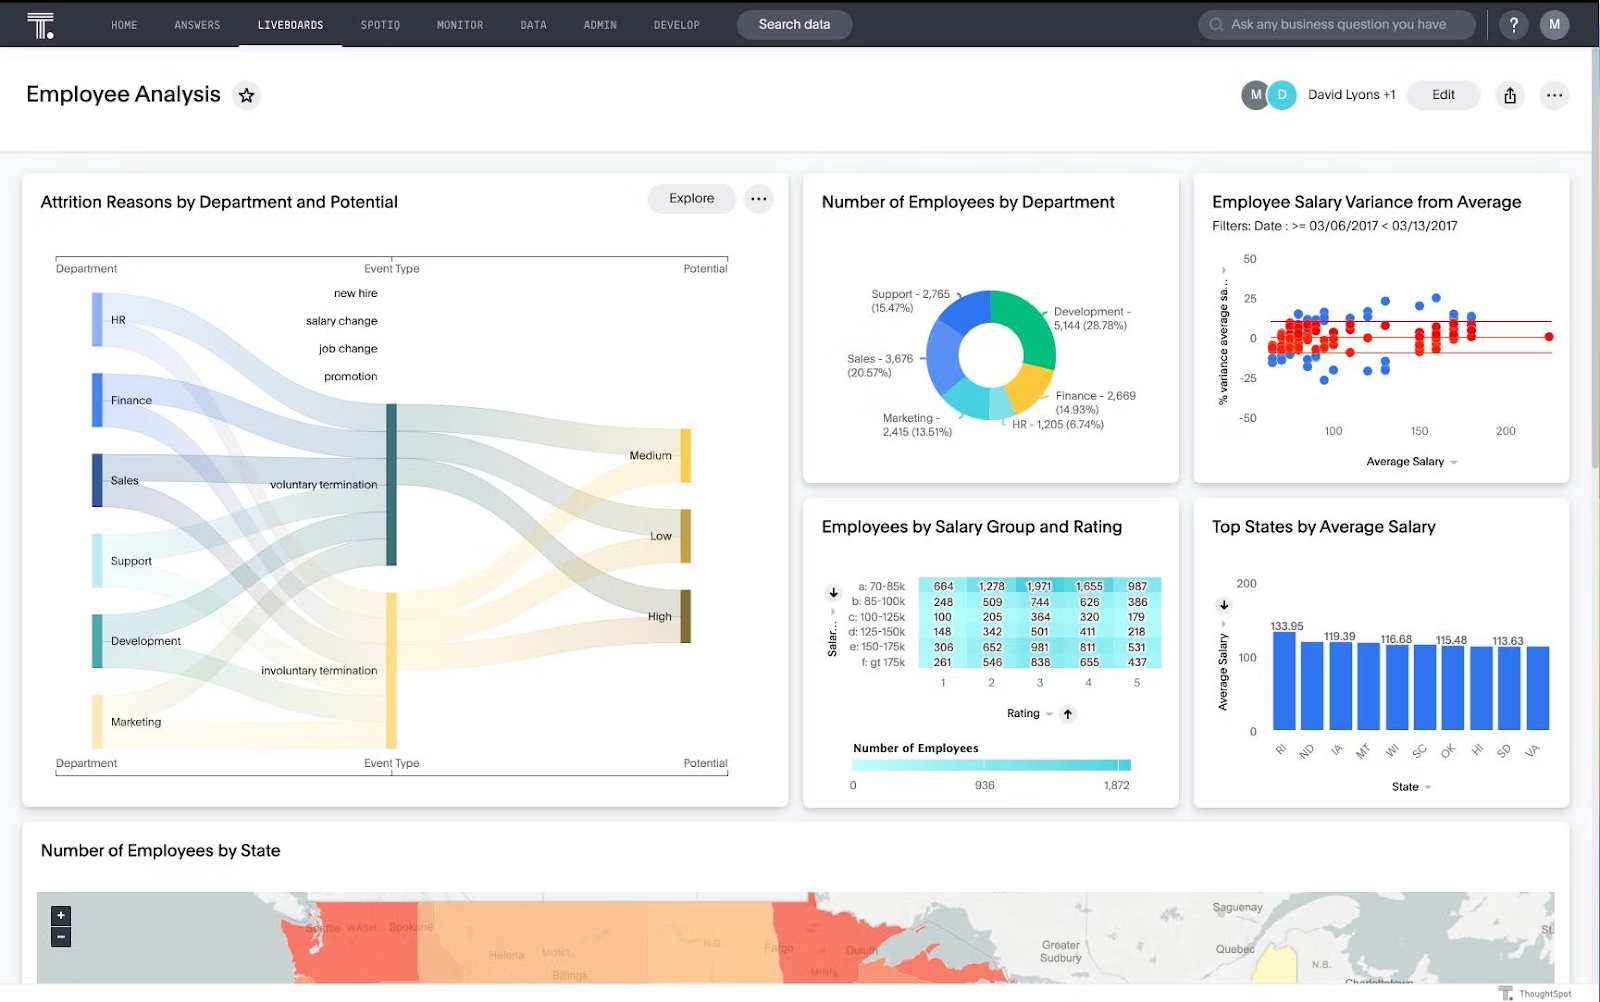
Employee burnout doesn’t show up overnight. It builds quietly through missed check-ins, growing absences, or a dip in morale. And by the time your HR teams intervene, it’s often too late.
Real-time dashboards bring those early signals to the surface. With a real-time HR dashboard, you can track metrics, like engagement scores, absenteeism, and turnover trends, to identify blind spots. This empowers your HR team to act proactively, offering support, rebalancing workloads, or improving onboarding before attrition creeps in.
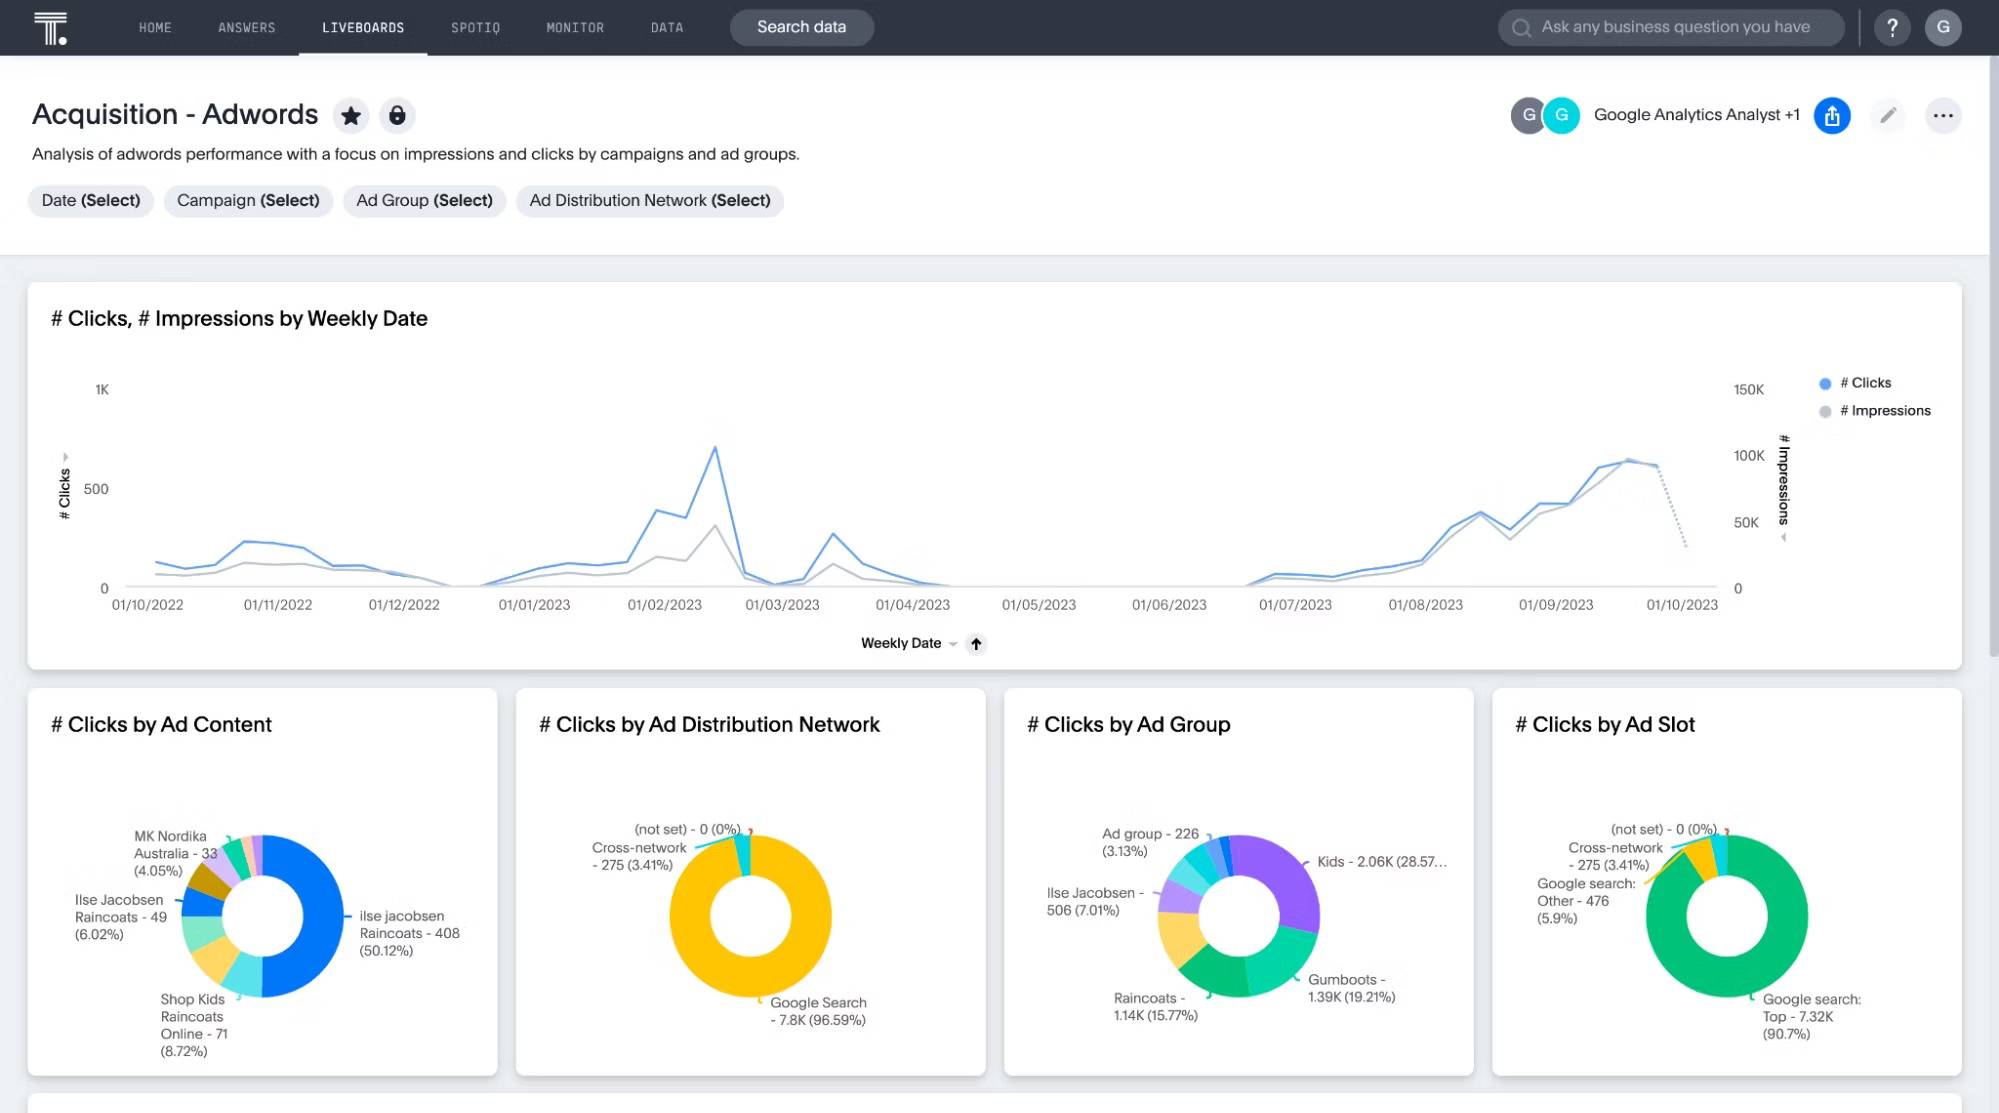
Imagine you’ve just launched the biggest campaign of the quarter. The ads are running, the budget’s locked, and the stakes are high. However, one channel is eating up your spend with zero conversions.
Marketing dashboards give you instant visibility into key metrics like conversions, clicks, and spend. The moment an asset underperforms, you can reallocate budget and fine-tune targeting before it impacts your ROI.
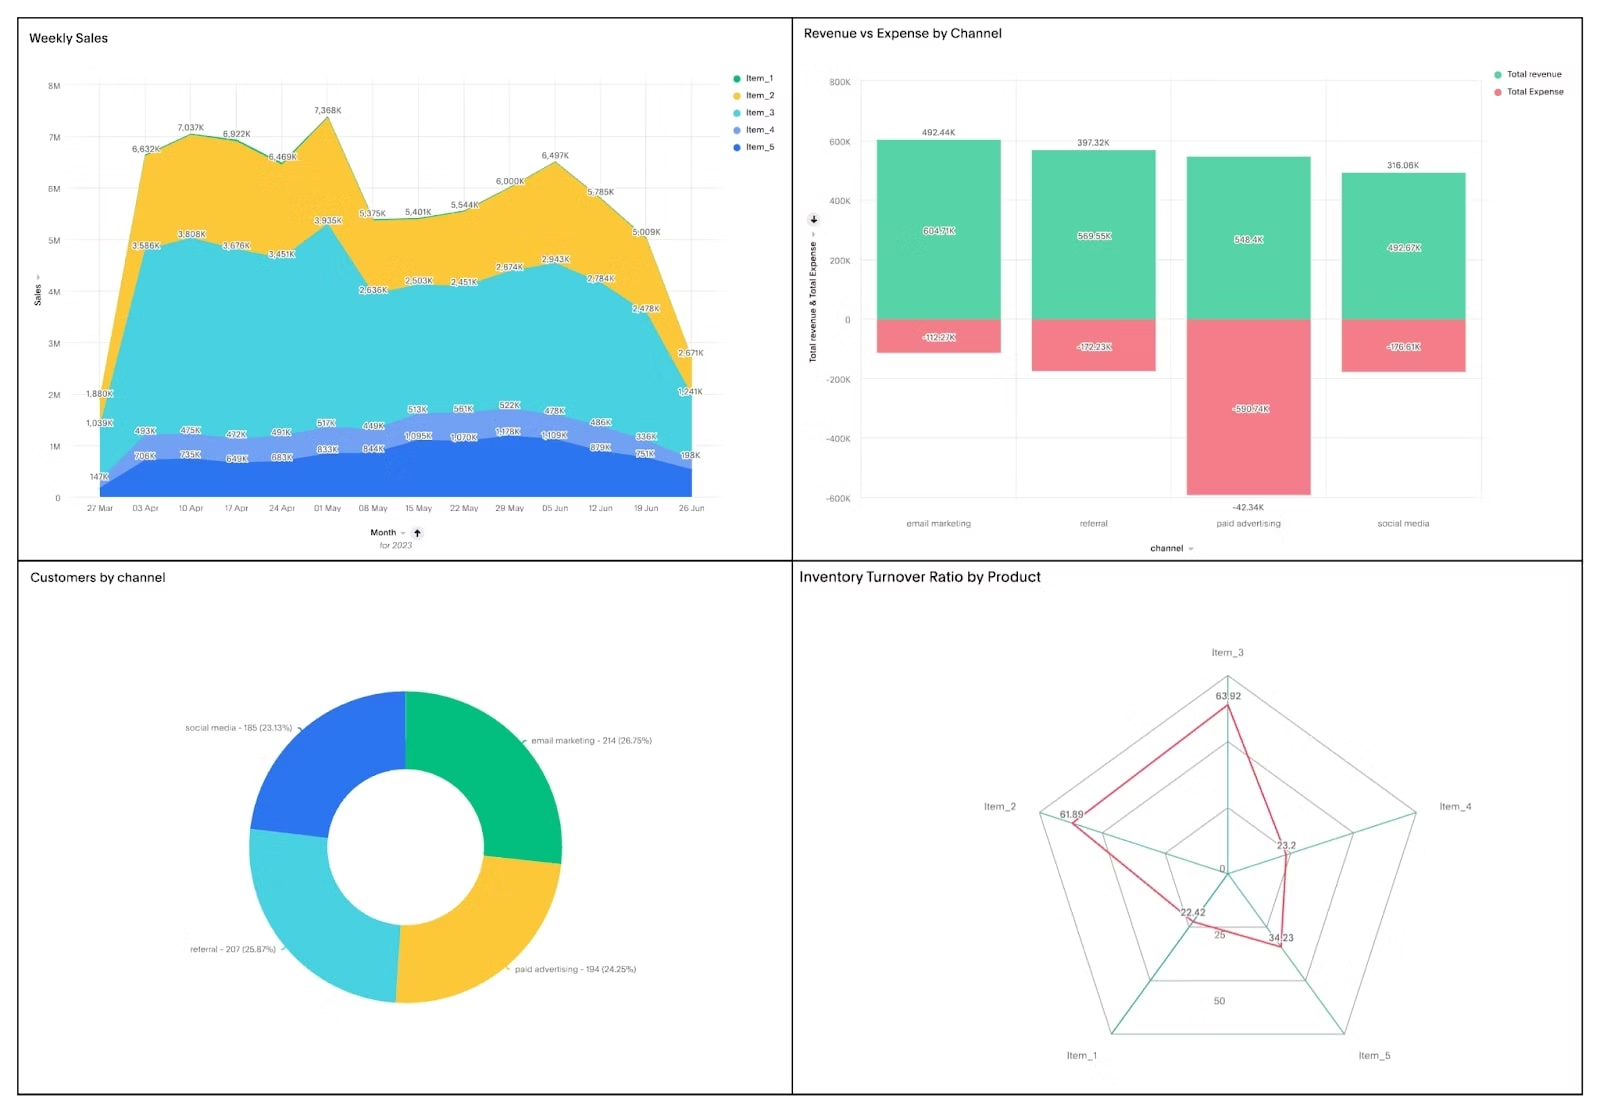
It’s month-end, and suddenly your finance team discovers a key payment is delayed. Just like that, your cash flow takes a hit, forecasts are thrown off, and financial plans need reworking.
With a real-time revenue dashboard, your team can always monitor revenue trends, forecast cash flow, and drill into the details to understand what’s shifting and why. Even when something slips, you can catch it immediately, keeping your financial strategy steady and your revenue pipeline on track.
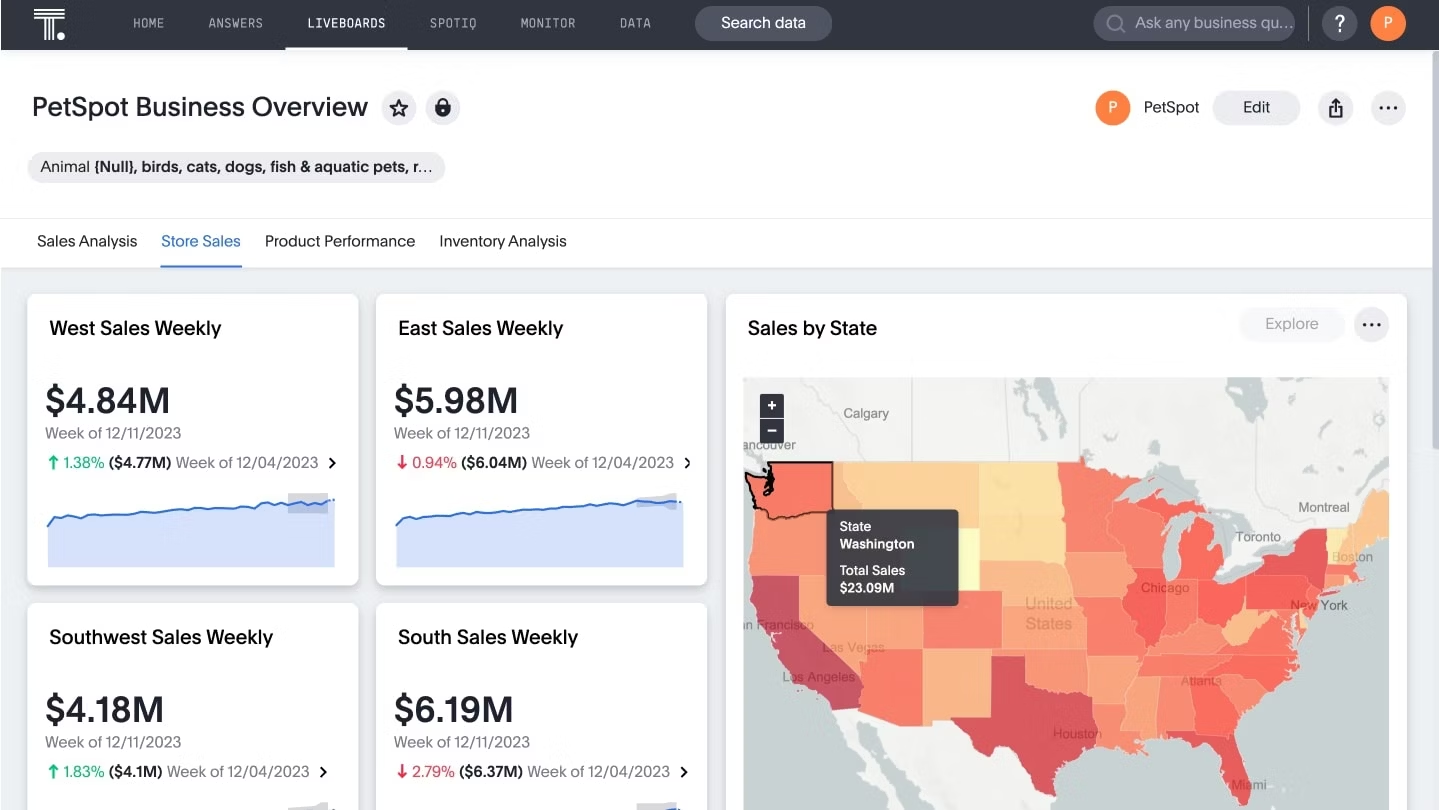
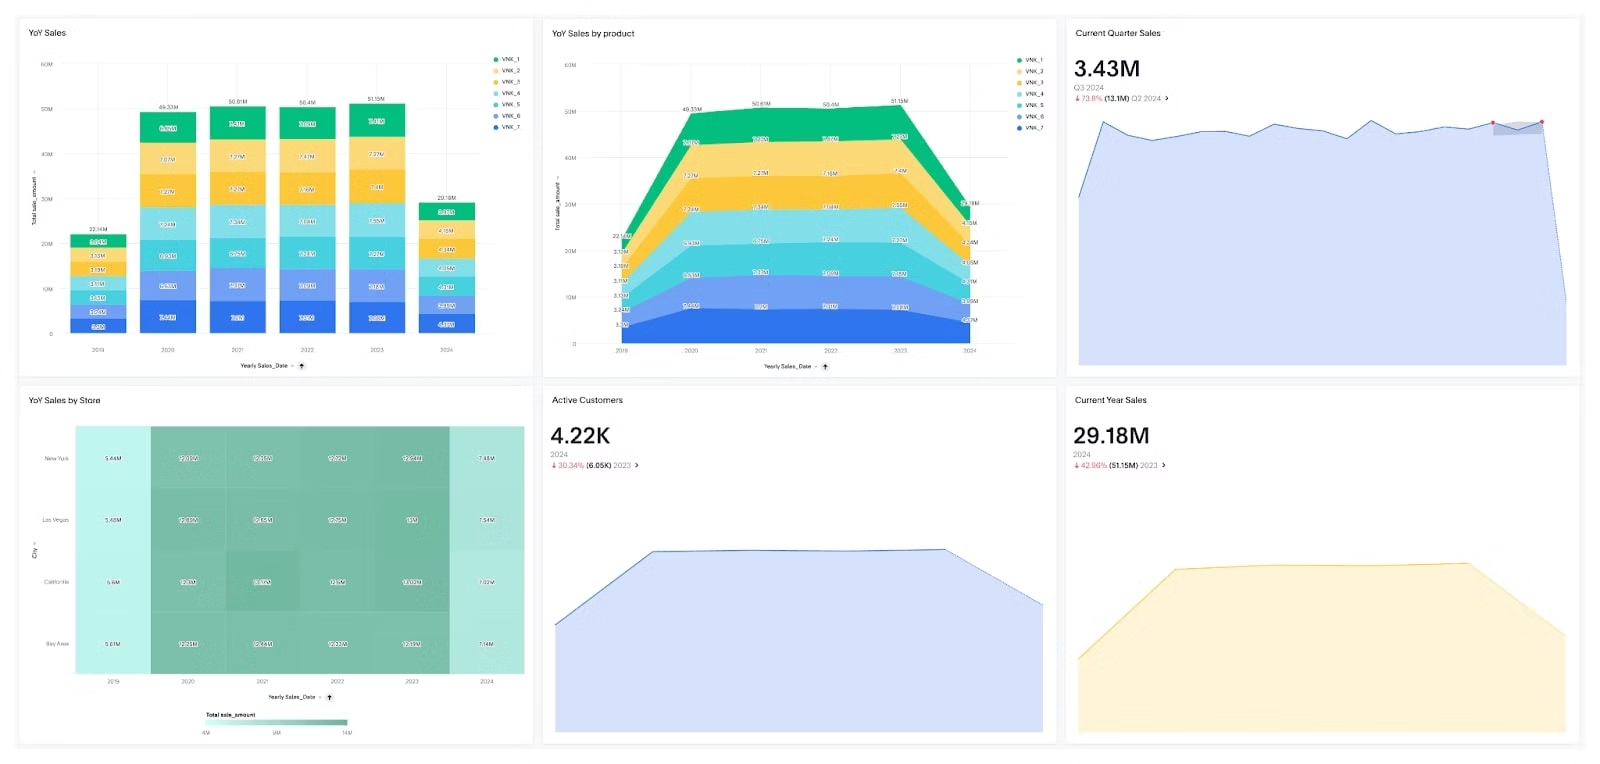
One store’s hitting record sales, another’s struggling to break even. What’s driving the gap?
A real-time store performance dashboard gives you a side-by-side view of critical metrics like sales per store, conversion rates, revenue per square foot, and inventory turnover. Armed with these insights, you’re seeing the ‘why’ behind the numbers.
From locating underperforming regions to analyzing user behavior, you know exactly where to step in and what to fix.
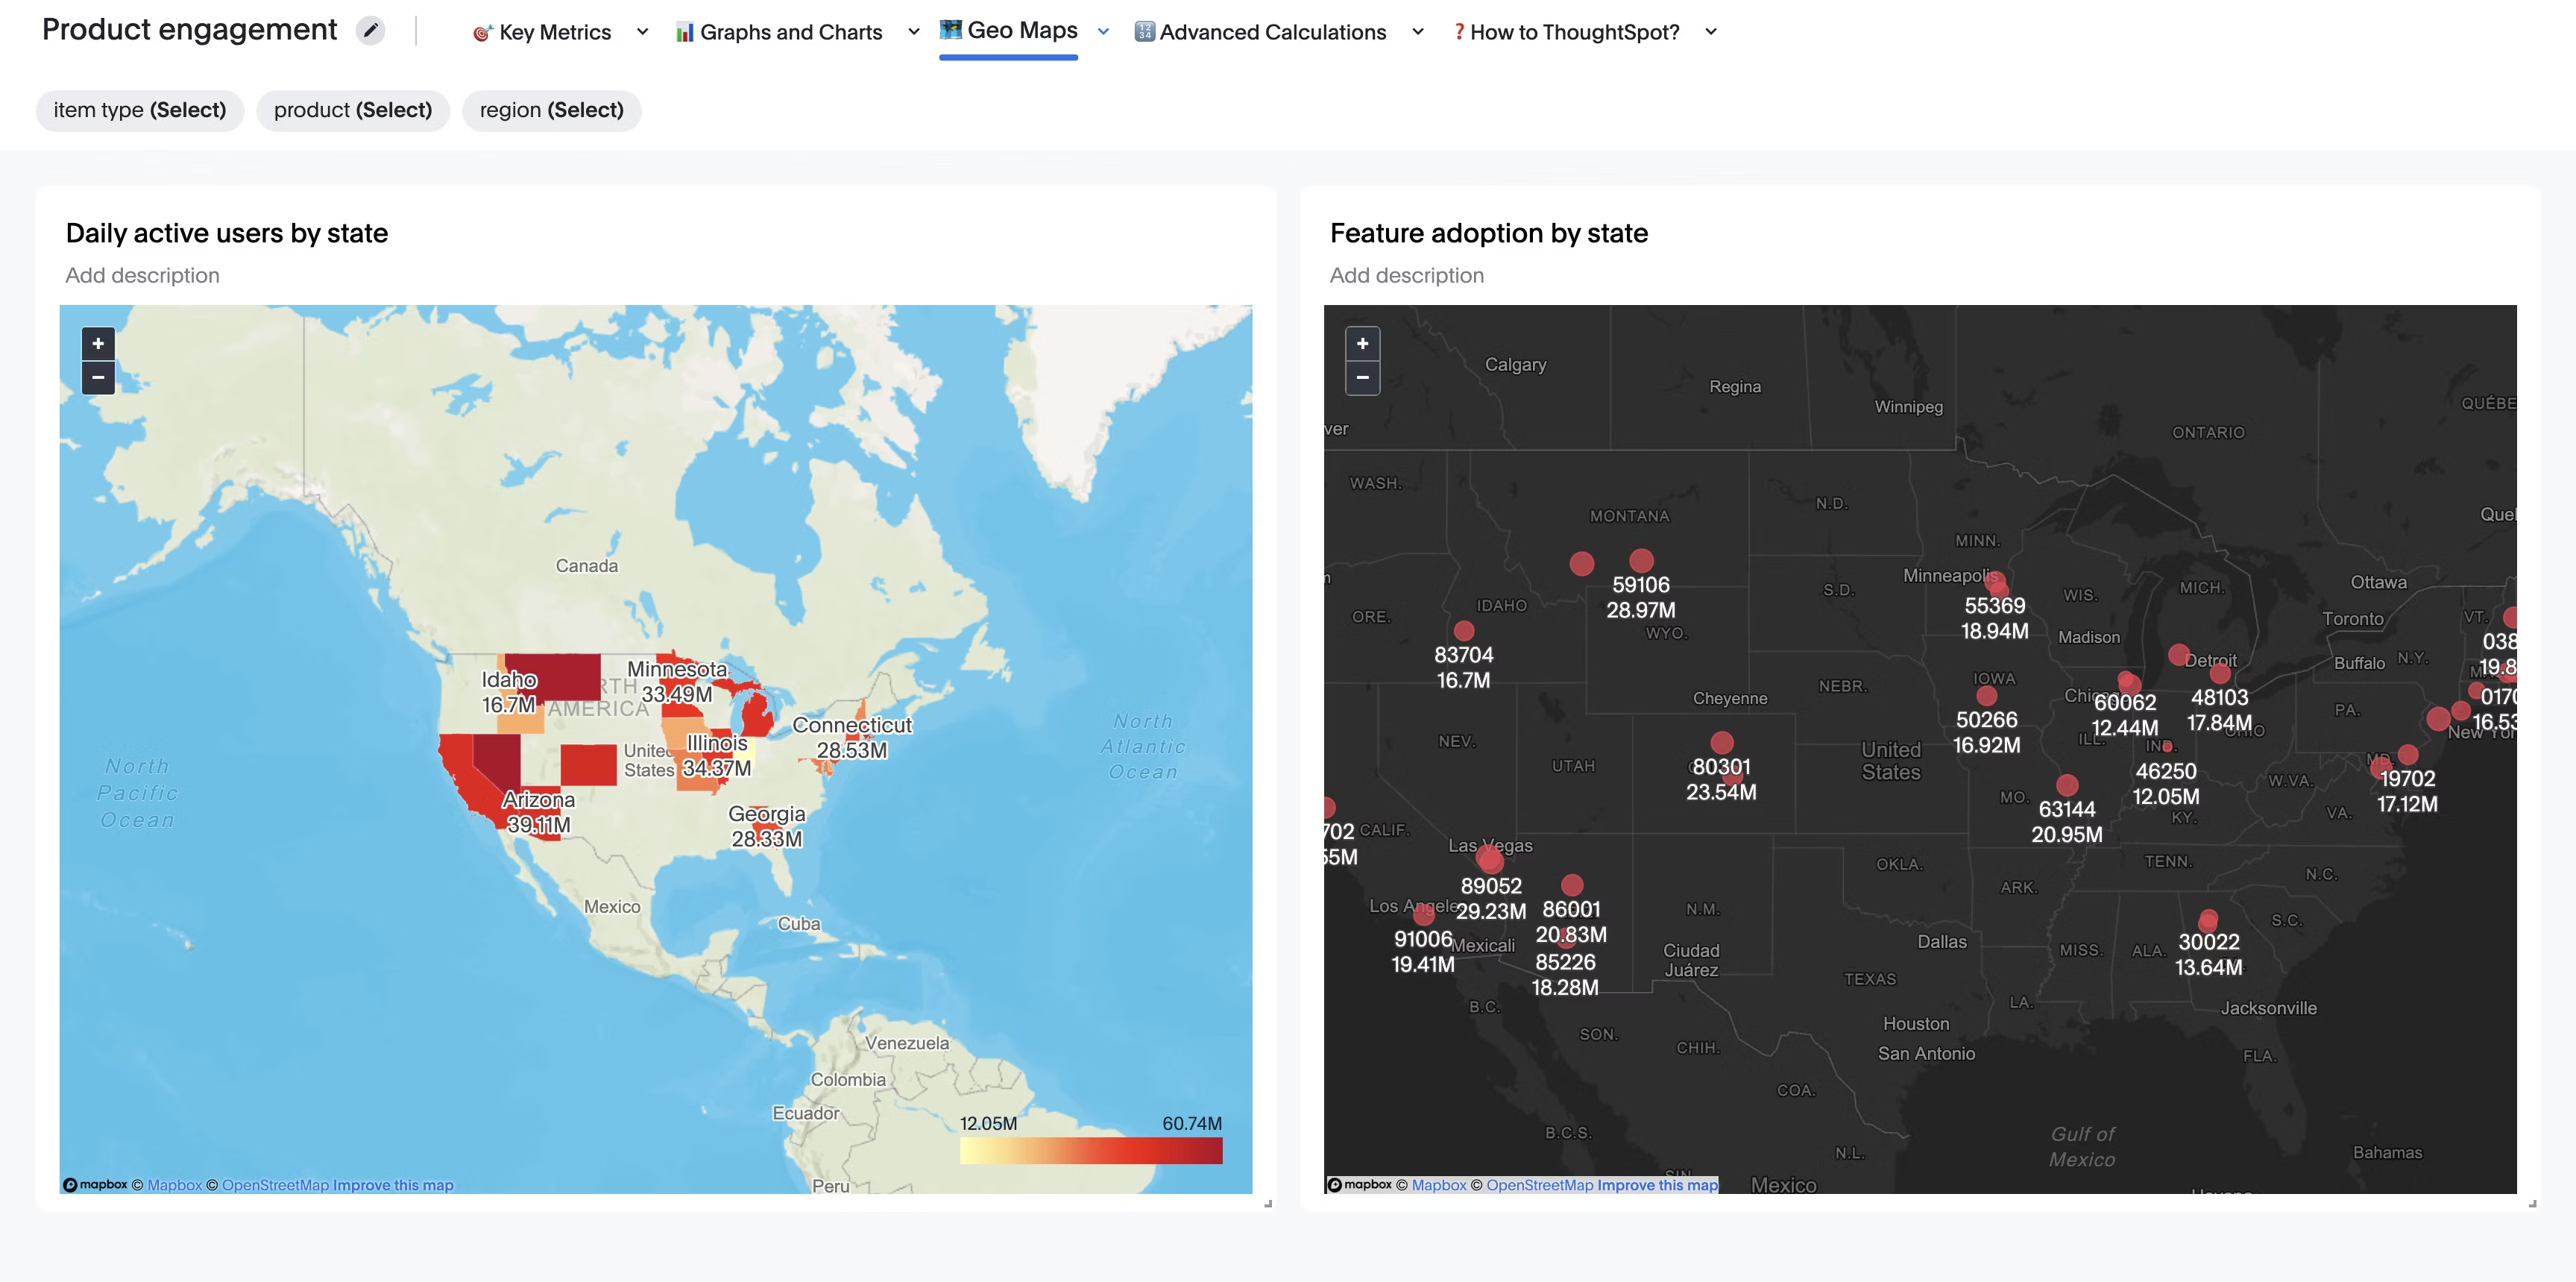
You’ve launched a major feature nationwide, only to find that while it’s taking off in some states, it’s barely making a dent in others. Without a clear view, you’re stuck guessing.
That’s where a product engagement dashboard comes in. It shows you exactly where adoption is soaring and where users are dropping off.
With these geo-based insights, you can move fast, adjusting your rollout, refocusing your marketing, or looping in the product team to tackle issues early. It’s how you catch regional red flags before they turn into missed opportunities.
Step 1: Start with a clear question
Before jumping into dashboard design, ask yourself:
What decisions will this help me make?
Whether you're tracking sales performance, churn, or revenue, getting clear on your goal upfront helps you keep things focused.
Step 2: Identify relevant data sources
Your dashboard is only as strong as the data behind it.
Map out the tools and platforms that house the metrics you care about—like CRMs, marketing platforms, or databases. The more connected the data, the more responsive your dashboard will be.
Step 3: Choose the right dashboard platform
Opt for a data visualization tool that’s easy to use. Think drag-and-drop interfaces, natural language search, and drill-downs that don’t require technical skills.
When the platform is intuitive, your team can build, explore, and update visualizations on their own, reducing dependency on analysts. Just faster access to insights, right when they need them.
Step 4: Design for clarity
When designing a dashboard, it’s important to follow UI/UX principles so users can easily spot what matters most at first glance. Clean layouts, clear visuals, and smart hierarchy help your data tell a story that’s easy to follow, interpret, and act on.
Step 5: Customize the interface
Choose a platform that lets you interact with your data, not just view it. Features like drill-downs, filters, and customizable visuals make it easy to explore data from different angles and discover insights that might otherwise stay hidden.
The more flexible your dashboard, the clearer your story becomes.
Step 6. Test and improve
Once your dashboard is live, check in with your users. Are they finding answers quickly? Is the layout clear? Are the alerts useful?
Treat your dashboard like a living product. As your business grows and priorities shift, your dashboard should evolve right alongside it.
Close the loop between data and decision
When market shifts happen in seconds, data delays are no longer just inefficiencies; they’re liabilities.
And if you’re still piecing together reports from siloed tools and outdated dashboards, getting real answers feels impossible.
With ThoughtSpot, no matter where your business data lives or how specific your question is, Spotter delivers real-time, contextual answers in an intuitive, conversational experience. Ask questions in natural language, drill deeper, and embed autonomous agents in the tools you and your team use every day.
Ready to close the gap between insight and action? Start your free demo today.
How is a real-time dashboard different from a traditional one?
Traditional dashboards rely on static or batch-updated data, meaning there’s a lag between what’s happening and what you see. Real-time dashboards update continuously, so you're always looking at the most current view of your metrics.
Can I customize what I see on a real-time dashboard?
Yes. Most modern dashboards let you drag and drop charts, apply filters, or drill down into the data that matters most to you, whether that’s region, product, user behavior, or any other slice of information.
Do real-time dashboards support predictive analytics?
Yes. Some advanced dashboard tools like ThoughtSpot support forecasting and predictive analytics, so you not only see what’s happening now, but also what’s likely to happen next.
How often does the data refresh in a real-time dashboard?
It depends on how the dashboard is set up. Some update every few seconds or minutes, while others refresh based on triggers or streaming APIs. You can usually configure the refresh rate based on your needs and system load.


