


With AI disruptions and fierce competition, business leaders have to remain flexible. Gartner research shows that successful businesses are 2x more likely to recalibrate and execute their plans in response to data insights. Meanwhile, non-successful brands are still operating on instincts or outdated information. With a clear definition of KPI reporting, and a thorough overview of how to find, understand, and communicate these insights, you too can join the ranks of highly successful, data-driven businesses.
This article will help you understand the nuances of KPI reporting, including its types, examples, and best practices to ensure that you allocate resources effectively and plan more strategically.
Table of contents:
To understand KPI reporting, you first need to understand the meaning of a KPI—short for key performance indicators. This is a number, or set of numbers, that signals a positive or negative performance. For example, you might have retail KPIs, healthcare KPIs, and financial KPIs. Depending on what industry or line of business you focus on, the KPIs will monitor change.
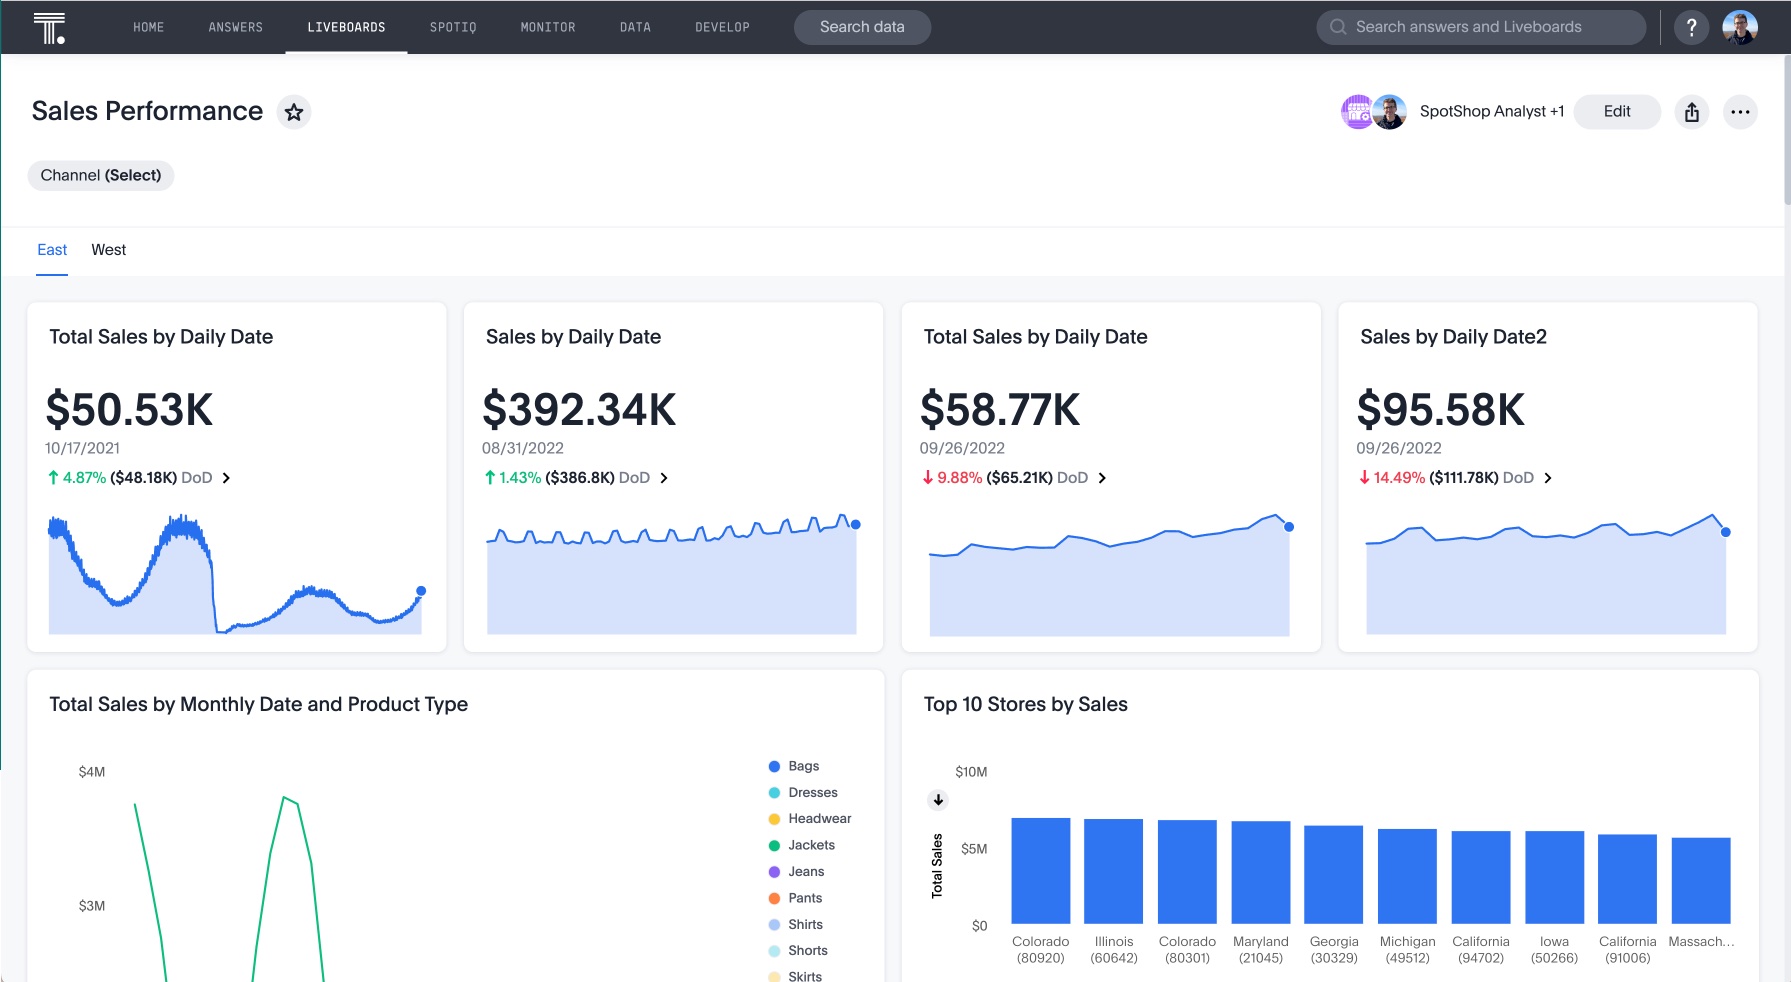
A KPI report is a management tool that allows leaders to track and analyze quantifiable indicators that gauge performance. These reports provide valuable insight into a project’s progress, a campaign’s outcome, or identify whether you’re on track to meet specified goals. KPI reports, often called dashboards, frequently include capabilities like interactive data visualizations, advanced AI analytics, and real-time tracking to enable quicker decision-making.
1. Improved communication
Although most brands today can capture data easily, few put it to good use. As per the CX trends report by Zendesk, only 22% of businesses can share data across teams. This represents a missed opportunity for your sales, marketing, and product teams to provide customers with a personalized experience. Even if the data is sharable, many business users struggle to interpret complex datasets, which results in missed opportunities to drive impact.
Modern KPI dashboards allow leaders to share reports with just a few clicks—not just the data professionals. It also empowers executives to share data with front-line decision makers, enabling cross-functional teams to collaborate faster.
As an added advantage, dashboards that include visualizations help business users interpret critical information and make data-driven decision-making at every intersection. This removes the dependency on professionals for clarifications on data, the resultant effort, and frustration.
For instance, here at ThoughtSpot, most business users leverage the ‘notes’ feature to add contextual information to improve communication between collaborators and make quick decisions.
2. Relevant and actionable insights
With organizations taking a proactive approach, they need timely and relevant information to respond to changing market conditions. Historically, with static dashboards and inflexible reporting, this was not possible.
However, modern KPI software and BI reporting systems helps users identify patterns, establish relationships between data points, uncover outliers, and drill down the information to answer the next question. Also, KPI reporting removes the need for going back and forth between multiple data sources by providing all the answers you need in a single dashboard. This arsenal of data insights helps your team craft winning strategies
3. Faster problem solving
Every year, organizations lose millions of dollars because the leaders remain unaware of the root causes of the problems and are too late to identify them—be it production delays, website glitches, or inventory stock-outs. The major reasons are inconsistent data, the complexity involved with it, and the associated legacy dashboards.
KPI reporting puts data at the center of decision-making by giving leaders and business users access to relevant, real-time insights. Monitoring solutions and notifications feature available in ThoughtSpot helps the leaders spot problems as soon as they arise and address them immediately.
Now that we’ve examined the importance of KPI reporting, it is critical to remember that every report serves a different purpose. At its core, the context matters. Below are some common KPI reports to help you get started.
1. Analytical report
An analytical report goes beyond the surface-level representation of data. They provide a brief understanding of the root causes and drivers that influence performance. Typically, these reports include:
Comparative analysis
Trend identification
Scenario analysis
Recommendations
2. Operational report
These reports feature indicators that help the operational team make fast, informed decisions about day-to-day business activities. Typically, these reports are created using an analytics platform like ThoughtSpot that connects directly to data sources, so the reports showcase insights as up-to-date and fresh as the underlying data. Most businesses use operational reports for:
Real-time production and sales reports
Up-to-date inventory report
Total shipments by country and date
3. Strategic report
A strategic report communicates the company’s vision to the entire organization, aided by facts—past and future. It provides a snapshot of high-level metrics, strategic initiatives, performance, and future outlook to bring the entire organization on the same page. The following are some of the key elements typically included in a strategic report:
Strategic objectives
Performance highlights
Principal risks and uncertainties
Details on strategic initiatives
We briefly discussed how KPI reporting can differ depending on the context and use case. Below, we have listed some examples of KPI reports that businesses of all sizes leverage to make educated decisions.
1. Financial reporting
Financial reports offer insights into the company’s financial health and profitability. It helps leaders compare expected results with actual results and identify areas of improvement. The most common metrics and KPIs in a financial dashboard include:
Revenue growth rate
Gross profit margin
Return on investment (ROI)
Debt-to-equity ratio
Working capital
2. Sales reporting
The ultimate goal of sales reporting is identifying trends that could impact the sales cycle. This type of operational reporting assists sales reps and the entire team in adjusting sales tactics and driving the company’s growth. Top sales metrics your sales dashboard must have:
Weekly sales reporting
Conversion rate
Average sales cycle length
Close rate
Sales growth YTD
3. HR reporting
Successful businesses thrive because they nurture talent. To do this, you need to track and measure employee effort in real time. Interactive HR dashboards and reports help leaders stay on top of critical metrics and indicators that showcase the workforce's effectiveness. Common HR KPIs include:
Cost per hire
Employee satisfaction
Diversity, equality, and inclusion
Revenue per employee
Performance rating
4. Marketing report
From creating ad campaigns to establishing a strong social media presence, marketers make decisions that can easily impact the company’s reputation and revenue. Weaving data into those decisions can certainly help the company attract qualified leads and create a better marketing funnel. With marketing reports, you can track metrics that uncover actionable insights about a particular campaign, channel, or strategy. Marketing reporting software simplifies this process by consolidating data and providing real-time analytics. Top metrics and KPIs included in this report contain:
Cost per acquisition (CPA)
Customer lifecycle value
Net promoter score
Social media engagement rate
Website visitors
1. Healthcare reporting
From waiting in long queues to get a doctor’s appointment to instant appointment booking, the healthcare industry has improved by leaps and bounds over the past decade. However, healthcare providers need to do a lot more work to reduce expensive treatment costs and provide a better patient experience. With healthcare BI and KPI reporting, providers can measure critical performance indicators to identify whether their services and treatments meet the patient’s expectations. Typically, most organizations track these indicators to gauge overall success through:
Patient satisfaction score
Readmission Rate
Occupancy Rate
The average length of stay
Medical error rate
2. Retail reporting
In an interconnected world, customers have hundreds of ways to reach B2C sellers. As exciting as this is, retailers can find it challenging to convert massive data sets into actionable insights—especially when it comes to increasing conversions and exploring new revenue streams. Retail reporting and dashboards simplify decision-making as businesses can spot trends early on through effective KPI tracking and streamline their inventory planning and management practices for better cost savings. A retailer KPIs include:
Average transaction value (ATV)
Sales volume
Product margins
Average shipping rate
Product margin
3. Manufacturing reporting
Manufacturers need optimized production capabilities to ensure they ship the highest quality products. By leveraging the right manufacturing analytics software and timely tracking important KPIs, businesses can monitor the efficiency of their operations, strengthen supplier relationships, and minimize downtime, unlocking higher revenue streams and cost savings. Here are some critical manufacturing KPIs you can track in your dashboards:
Defect rate
Overall equipment effectiveness (OEE)
Capacity utilization
Cost of downtime
Supplier quality score
4. Procurement reporting
Effective raw material procurement is how businesses maintain a competitive advantage. With procurement analytics and interactive KPI reporting, companies can prepare for the unexpected. For instance, manufacturers who diversify suppliers, stay on top of market trends, and track procurement metrics can manage supply chain risks effectively while keeping costs down. The following are some of the essential supply chain KPIs organizations follow to get better insights into how to reduce lead times and get deliveries in a more timely manner:
Purchase order cycle time
Approval time
Supplier diversity
Procurement cycle efficiency
Cost per purchase order
1. Keep it simple
At the heart of KPI reporting lies the overwhelming need to simplify the process of decision-making. Here is a quote from OrderPay’s data analyst emphasizing the importance of data solutions that help them keep data simple, relevant, and collaborative:
"We needed to be able to provide live, advanced analytics for our non-technical users, not just better-looking reports and dashboards. Our previous tool was very code-driven, so we always had to write SQL queries ourselves to interrogate the data, and then build that into a dashboard to make that available to whichever stakeholder needed it. About 40% of my time was taken up by ad hoc queries."
2. Tell a story
People tend to remember stories much better than reports and statements. When you tell a compelling data-driven story, your audience is more likely to digest information.
You can integrate data storytelling elements by adding context to your KPI reports and presenting insights through interactive data visualizations. This can empower business users to understand the implications of data and voice their opinions more aptly.
3. Focus on data quality
As data sources become more fragmented, the accuracy of KPIs directly correlates with the accuracy of the underlying data. If you feed incorrect information into your dashboards, the dashboard displays falsified insights, ultimately leading to misguided decisions.
On the other hand, if the data is clean, up-to-date, reliable, and consistent, you spend less time correcting errors and more time acting upon insights. Adopting proper data quality practices and using apt KPI reporting tools can help leaders establish stakeholders' trust and investigate problem areas more effectively.
Understand what drives growth with live KPI dashboards
Building an effective KPI dashboard can require a lot of time and effort. With the right tools and mindset, you can get a holistic view of your entire operations within days.
By transforming raw data into meaningful insights and visual narratives on a live dashboard—what we at ThoughtSpot call a Liveboard—organizations can monitor trends, drive growth, and respond to challenges effectively. Discover the power of AI-Powered Analytics with Spotter.
Unlock granular insights for enhanced decision-making, sign up for a free trial of ThoughtSpot today!


