


Your business is swimming in data–sales numbers, customer behavior, campaign performance, supply chain metrics. The problem? Most of it sits scattered across tools and reports, making it nearly impossible to get a clear picture. That’s where business intelligence (BI) tools come in. They don’t just crunch numbers; they turn the noise into something you can actually act on.
Modern BI platforms go way beyond static reports, giving you real-time visibility, interactive visualizations, instant alerts when something’s off, and even predictive insights to help you see what’s coming next.
In this guide, we’ll cover what BI tools actually do, how to choose the right one for your business, and the top platforms shaping the future of analytics.
Table of contents:
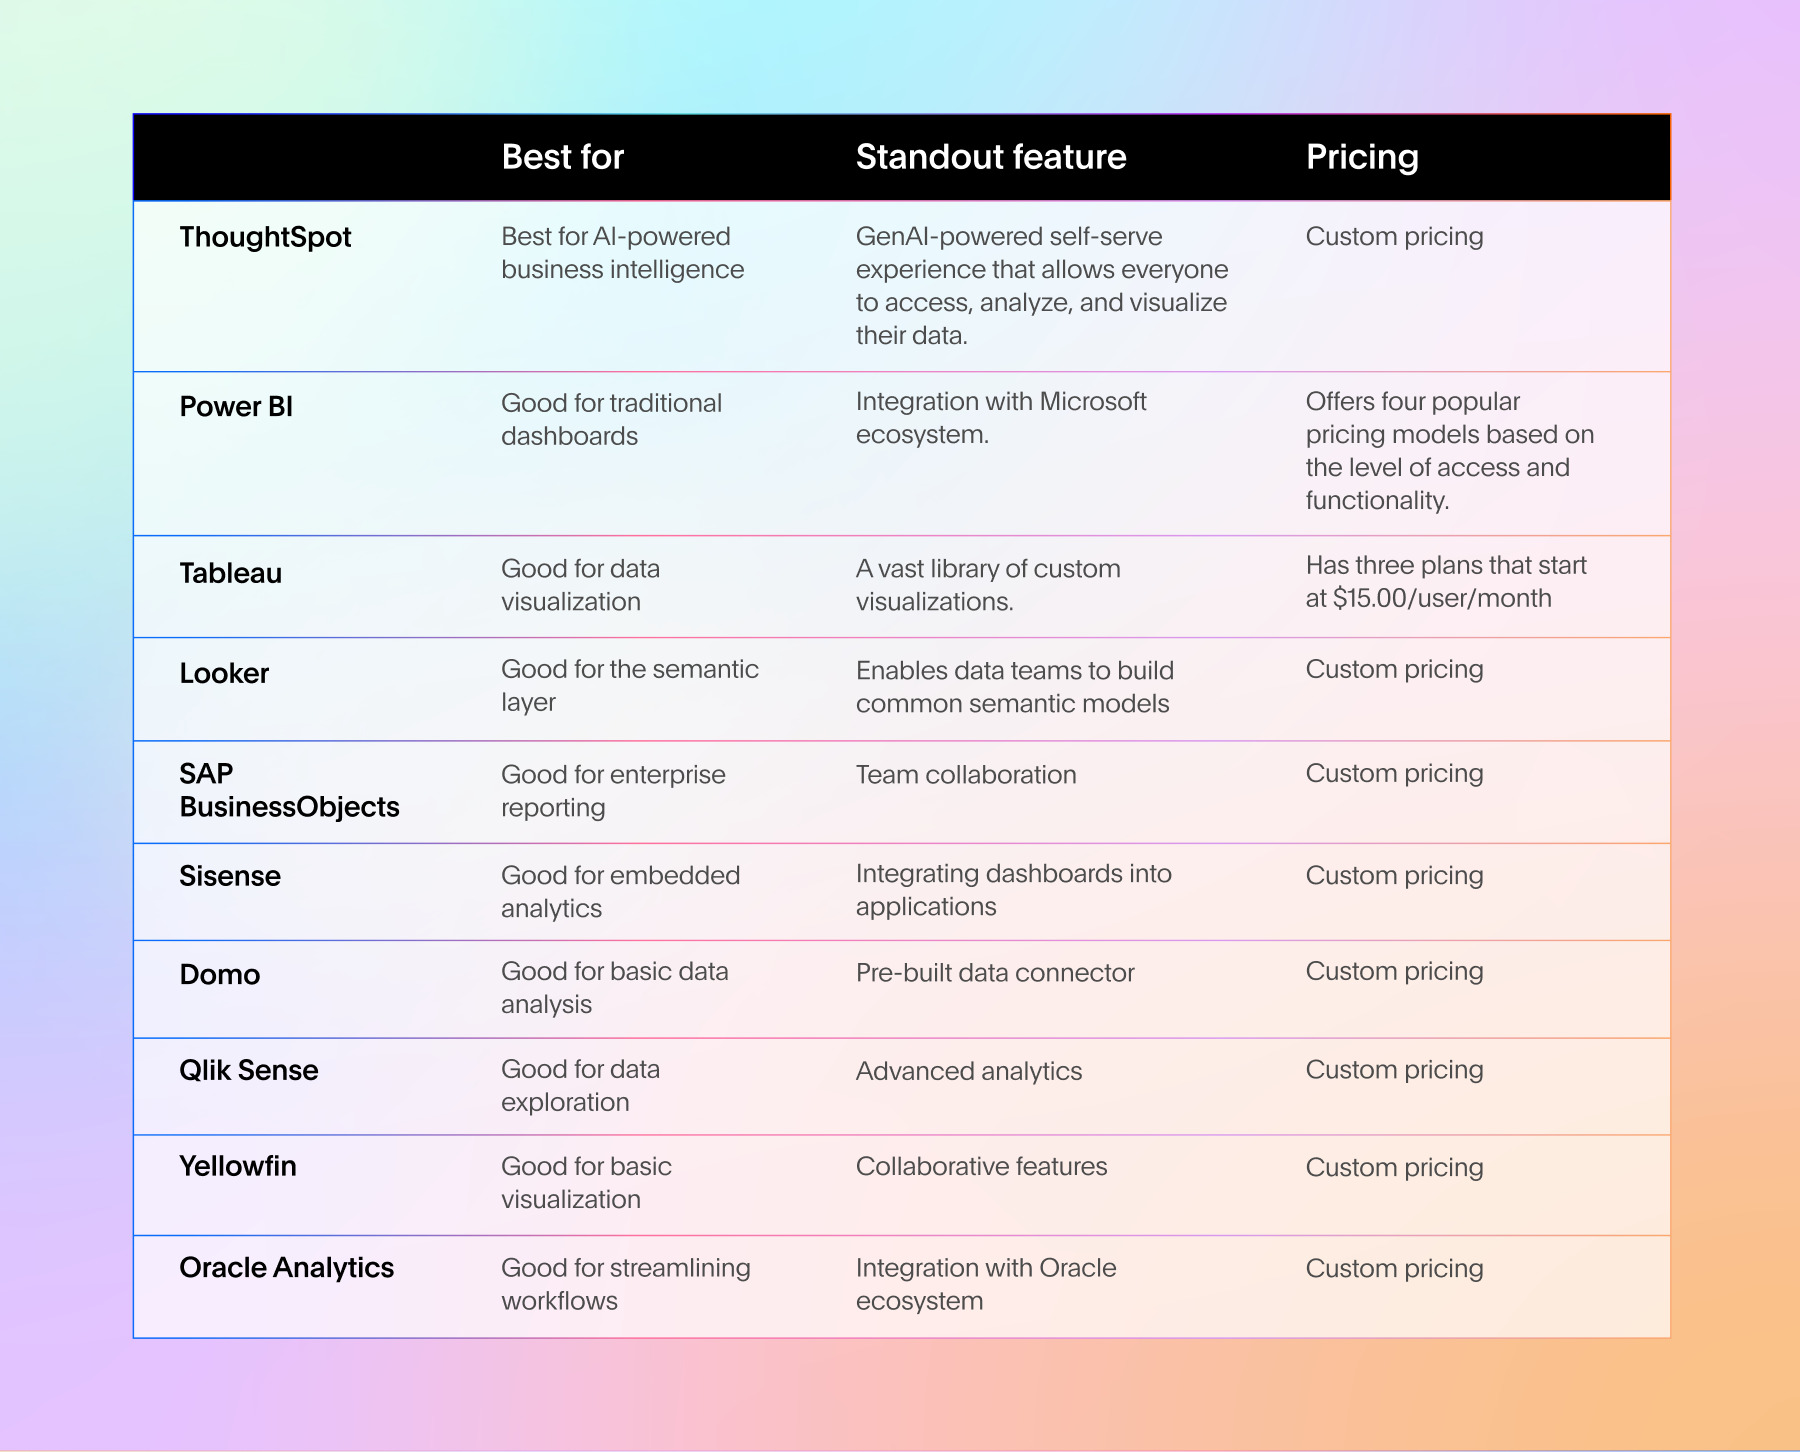
- The top business intelligence tools at a glance
- What is a business intelligence tool?
- ThoughtSpot: Best for AI-powered business intelligence
- Power BI: Good for traditional dashboard
- Tableau: Good for data visualization
- Looker: Good for the semantic layer
- SAP BusinessObjects: Good for enterprise reporting
- Sisense: Good for embedded analytics
- Domo: Good for basic data analysis
- QlikSense: Good for data exploration
- Yellowfin: Good for basic visualization
- Oracle Analytics: Good for streamlining workflows
- The best BI software tools unlock value in your data
- FAQs
Business intelligence (BI) tools are software applications that help you analyze raw data and turn it into insights you can act on. They gather information from across your systems, process it, and present the results in clear visualizations like charts, graphs, and dashboards. The goal is to give you insights that help you make better decisions, run operations efficiently, and base choices on data instead of intuition.
Why BI tools are useful
Once you start using a BI tool, it becomes your go-to for understanding performance, spotting trends, and making decisions. From there, you can apply it across a wide range of use cases:
Performance monitoring: Keep tabs on your key performance indicators (KPIs) and other metrics so you always know how your business is doing
Trend analysis: Spot patterns in your historical data to make better predictions and forecasts
Process optimization: Dig into your processes to find bottlenecks and opportunities for improvement
Decision support: Get data-backed recommendations that help you make tactical decisions
Market insights: Understand market trends, customer behavior, and where you stand against competitors
Financial analysis: Make budgeting, financial planning, and performance analysis way more accurate
Factors to consider when choosing business intelligence software
Picking the right business intelligence software can make or break your BI strategy. To make sure you're making a smart choice, here's what you should look for:
Scalability: Your tool needs to handle your current data volume, so you don’t outgrow it in six months.
Cost: Factor in both upfront and ongoing costs, as most tools have added costs for premium features.
Ease of use: Find a BI solution with an intuitive interface that doesn’t require heavy or lengthy training.
Integration: Make sure it integrates smoothly with your existing data sources—databases, CRM systems, cloud platforms, and whatever else you're using.
Security: Your data security can't be an afterthought. Look for robust security measures that protect your sensitive information without making access a nightmare.
Customization: Every organization is different. Choose a tool flexible enough to adapt to your unique workflows.
Support and training: Check what kind of support and training resources come with the tool.
Data visualization: Look for clear, interactive visualizations that make it easy to drill down, filter data, ask follow-up questions, and spot correlations.
AI-driven search capabilities: Natural language search powered by AI completely changes how your team discovers and accesses data, making adoption much easier.
Mobile accessibility: Mobile compatibility isn't nice-to-have anymore—it’s what makes the tool part of daily work.
💡 Want to find the best BI tool for your needs? Check out this in-depth guide for a side-by-side comparison to make a smarter, more informed choice.
Are there disadvantages to using BI tools?
More information, better access, deeper analysis—sounds perfect, right? In theory, yes. But there are some potential downsides if you pick the wrong BI tool for your organization:
Implementation can drag on for months, draining time and resources before you even see value.
Steep learning curves can cause frustration, particularly for non-technical users like sales staff and executives.
BI tools that aren’t configured correctly can give you incorrect or misleading outputs.
This is exactly why finding the right fit matters so much. Let's look at some of the most popular options out there.
Now, let's take a look at the top BI tools in detail so you can find the solution that’s best for your business.
Let's cut to the chase: our team and a growing list of world-class customers use ThoughtSpot to find insights and make strategic business decisions with their data. Recognised as the leader in BI, ThoughtSpot stands out as a complete business intelligence platform that lets anyone ask any question, on any data, anywhere they work.
With Spotter as your dedicated AI Analyst, you can ask questions in natural language and get instant insights and visualizations. Whether you want to compare performance or forecast trends, ThoughtSpot delivers precise, contextual insights right when you need them most. For complex calculations and data modeling, your data teams can leverage Analyst Studio to find deeper insights.
Core features
1. GenAI-powered self-service analytics
With Spotter, you can interact with data exactly how you want to. This conversational AI experience uses a familiar chat interface that lets business users ask follow-up questions, dig into any AI-generated answer, and share insights to drive results across teams and departments.
2. Interactive data visualization
Forget static dashboards with stale insights. Our Liveboards let you represent your data in ways that are actually valuable, contextual, and actionable. You can create your own visualizations, apply filters, drill down into data, and see updates instantly—even on the go. Whether you're tracking employee performance or creating an engaging data story for stakeholders, Liveboards keep you on top of your cloud data.
3. Augmented analytics
ThoughtSpot's AI capabilities go way beyond just finding insights. With features like AI highlights and change analysis, you can dig deeper than surface-level analysis to discover the 'why' behind unexpected changes and spot hidden trends and anomalies.
4. Embedded analytics
Bring insights directly into the tools and applications your team already uses. ThoughtSpot Embedded lets you integrate Liveboards and AI-driven answers into your workflows—whether it’s Salesforce, ServiceNow, Google Sheets, or custom apps. This keeps insights accessible right where decisions are made, so your team can act on data without missing a beat.
Microsoft's Power BI is a business intelligence tool that turns raw data into insights through dashboards and reports. It's used for data visualization, reporting, and analytics, especially in organizations that are already deep in the Microsoft ecosystem. While Power BI offers an intuitive interface, getting the most out of it can be challenging—you'll need a solid analytical background to unlock its full potential.
Core features
Data visualization: Create data visualizations (like charts, graphs, and tables) using a drag-and-drop interface.
Data transformation: Power Query handles data cleaning, shaping, and transformation tasks.
Sharing and collaboration: You can share reports and collaborate by leaving comments on specific data points.
Integration: Power BI connects to various Microsoft data sources to consolidate data for analysis.
Custom Visuals: Users can create and use custom visuals beyond the standard options.
💡Relevant read: 10 Power BI alternatives and competitors to consider
Tableau is Salesforce's business intelligence software that helps analysts analyze, visualize, and interact with data to make informed decisions. It's built to transform raw data into understandable insights. Tableau's capabilities include data connectivity, drag-and-drop data visualization, advanced analytics, and the ability to create interactive dashboards and reports.
Core features
Data connectivity: Connects to various data sources like databases, spreadsheets, cloud services, and more.
Advanced analytics: Handles complex calculations, predictive modeling, and statistical analysis.
Collaboration and sharing: Share your Tableau visualizations, dashboards, and reports with others
Trend lines and predictive analysis: Helps you spot trends in your data and predict future outcomes.
Tableau prep: Includes tools for data prep and cleaning, making it easier to get your data ready for analysis.
💡Relevant read: Top Tableau competitors and alternatives to consider
Looker is a business intelligence tool built around a semantic layer. This layer creates a structured representation of your data, defining relationships between data points, metrics, and dimensions. Looker's approach to data modeling makes data access and interpretation much simpler for both technical and business users who want to explore and analyze information.
Core features
Embedded analytics: Looker can be embedded into other applications, websites, or workflows.
Data exploration: Create custom reports and interactive visualizations to pull insights from your data.
Collaborative analytics: Lets you share reports, dashboards, and data models with your team.
Integration with Google Workspace: Connects your data to Google Workspace tools like Slides and Sheets.
LookML: Uses a proprietary modeling language that lets users define data relationships and metrics.
💡 Relevant read: Looker vs Power BI.
SAP BusinessObjects, often called SAP BO or simply BusinessObjects, is a suite of business intelligence software tools and applications from SAP. It offers reporting and data visualization features that help data professionals collect, analyze, and explore their business data.
Core features
Reporting and analysis: Create reports and analytical dashboards to pull insights from your data.
Collaboration and sharing: Collaborate by sharing reports and dashboards with your team.
Role-based dashboards: Delivers role-based BI dashboards that get the right info to decision-makers.
Real-time analytics: Connects with SAP Business Warehouse and SAP HANA for real-time analytics.
Dashboard designer: Design interactive dashboards with a range of visualization options and customizations.
Sisense's business intelligence reporting tool lets your business connect to various data sources and create visualizations and dashboards. The tool offers features like data blending, data modeling, and data visualization. Sisense also provides advanced analytics capabilities for complex calculations and predictive analytics. Data professionals can embed Sisense into their existing applications and web portals, adding powerful functionality without disrupting existing workflows.
Core features
Data visualization: Create dashboards, widgets, and filters using a drag-and-drop interface.
Data modeling: Merge and model data through a code-first workflow within the platform.
Git integration: Connectivity with Git provides better version control.
Mobile access: Offers mobile apps for iOS and Android so users can access their data on the go.
Custom widgets: Create and customize widgets for more tailored and interactive dashboards.
Domo is a business intelligence platform that provides tools for collecting, visualizing, and analyzing data from multiple sources. It's used across various industries to support data-driven decision-making and improve operational efficiency. The platform is designed to be accessible to users with different levels of technical expertise, offering a range of features to help organizations manage and interpret their data.
Core features
Reporting and dashboards: Offers a range of reporting and drag-and-drop features for ad-hoc analysis.
Mobile accessibility: Compatible with popular mobile apps for iOS and Android, making it accessible for users.
Collaboration: Includes features for in-context chat, user profiles, project management, and scheduled content.
Cloud infrastructure: Built on a cloud-native architecture with dynamic scaling and massively parallel processing (MPP).
Data governance: Offers tools for managing data quality, security, and compliance.
Qlik Sense is a business intelligence tool that supports various analytics use cases, including dashboards, custom analytics, and embedded analytics. It's available for deployment both on-premises and in the cloud, giving you flexibility to meet different organizational needs.
Core features
Data visualizations: Create interactive visualizations like charts, tables, and graphs.
Associative data modeling: Known for its associative data model, letting users explore hidden relationships
ML capabilities: Run ML experiments in the Qlik Cloud Analytics hub and use the output to build a data model.
Interactivity: Build and share interactive data stories that combine visualizations with narrative elements.
Augmented Intelligence: Use AI and machine learning features to improve data analysis and visualization.
Yellowfin is a business intelligence and analytics platform that provides data visualization, reporting, and analysis tools. It focuses on combining enterprise reporting and dashboards with collaborative features. Yellowfin is used to create custom visualizations, generate reports, and identify trends and anomalies in data.
Core features
Data visualization: Offers interactive dashboards and visualizations that let users create and share data insights.
Collaboration: Collaborate on data analysis by sharing dashboards, reports, and insights within the platform.
Automated analysis: Provides automated insights, highlighting key trends, anomalies, and patterns in the data.
Data storytelling: Has features for building and sharing data-driven stories.
Data integration: Connects with various data sources to combine and analyze data from different systems.
Oracle Cloud Analytics is a cloud-based business intelligence platform that integrates with Oracle's ecosystem. It offers tools for data visualization, reporting, and augmented analytics, letting users analyze information from diverse sources. OAC helps organizations gain insights and improve their analytical capabilities.
Core features
Data preparation: Includes tools for cleaning, transforming, and enriching data before analysis.
Advanced analytics: Supports predictive and machine learning models for in-depth data analysis.
Data visualization: Convert data into interactive dashboards and visualizations.
Collaboration: Let users share reports and collaborate on analytics projects across the organization.
Oracle ecosystem integration: Integrates seamlessly with other Oracle products and cloud data sources.
By now, it's clear that AI isn't just another tech upgrade—it's completely changing how we work with data. How you prepare and adapt to this shift will determine whether you get real ROI from your AI investments. While many BI vendors have promised chatbots, automated insights, and natural language search, few have delivered. ThoughtSpot is among them.
With ThoughtSpot, data isn’t stuck in technical silos anymore. Everyone—from analysts to business users—can access decision-ready insights in the way that works best for them, so your whole team gets more value from data.
Now it's up to you to embrace this AI-driven future—Schedule a demo today.
Is SQL a business intelligence tool?
Structured Query Language (SQL) is a programming language that's often used for working with large sets of structured data. It's not a business intelligence tool by itself, but most business intelligence tools use SQL in some way to query databases. Low-code or no-code BI tools let users generate reports and create forecasts even if they don't know SQL, but they're still working behind the scenes.
Is business intelligence the same as ETL?
Business intelligence and ETL are different parts of the data supply chain, but they're definitely related. Extract, transform, and load (ETL) is a set of tools and procedures used to prepare data for loading into a business intelligence platform. Business intelligence involves taking data that's been through ETL and modeling, analyzing, and visualizing it.
Do you need a data warehouse for business intelligence?
A data warehouse isn't strictly required for all business intelligence, but for many businesses, it's a critical part of the BI data pipeline. Your data warehouse stores your data and helps maintain it as a clean, categorized, single source of truth—so for larger organizations and businesses with more complex data needs, it's indispensable.
However, newer BI solutions like ThoughtSpot let you connect directly to your operational databases without a warehouse, which can be a great option for smaller businesses that are still building out their data infrastructure.


