


You have more data than ever. But what you don't have is a reliable way to go from raw numbers to clear, confident decisions.
When data is scattered across tools and teams, and every report tells a slightly different story, it's hard to know what's accurate, let alone what's actually useful.
Big data analytics brings it all into one place and helps you focus on the trends and shifts that actually deserve your attention while you still have time to act on them.
Let's break down what big data analytics actually is, why it should matter to you, how it works in practice, and most importantly, how teams like yours are using it to solve real problems and find new opportunities.
Table of contents:
Big data analytics is how you cut through the noise of massive datasets to find the insights that actually matter without waiting weeks for reports or getting stuck in BI backlogs. Using tools like machine learning, statistical modeling, and predictive algorithms, you can sift through huge amounts of information to find patterns, spot trends, and surface insights that help you make smarter decisions.
Big data analytics is often defined by the "five Vs":
Volume - the sheer amount of data
Variety - the different formats and sources of data
Velocity - the speed at which new data arrives
Veracity - the reliability and accuracy of that data
Value - the business impact you can derive from it
By understanding these qualities, you can move beyond raw numbers and dashboards to insights that actually guide decisions. Big data analytics helps you get clarity to complexity, so you're not just collecting more data, but learning more from it.
So, how do you actually go from raw, messy data to clear, useful insight? It's not magic, though it might feel like it. It's a structured process that transforms the data you collect into genuine business value. Here's how it typically works, step by step:
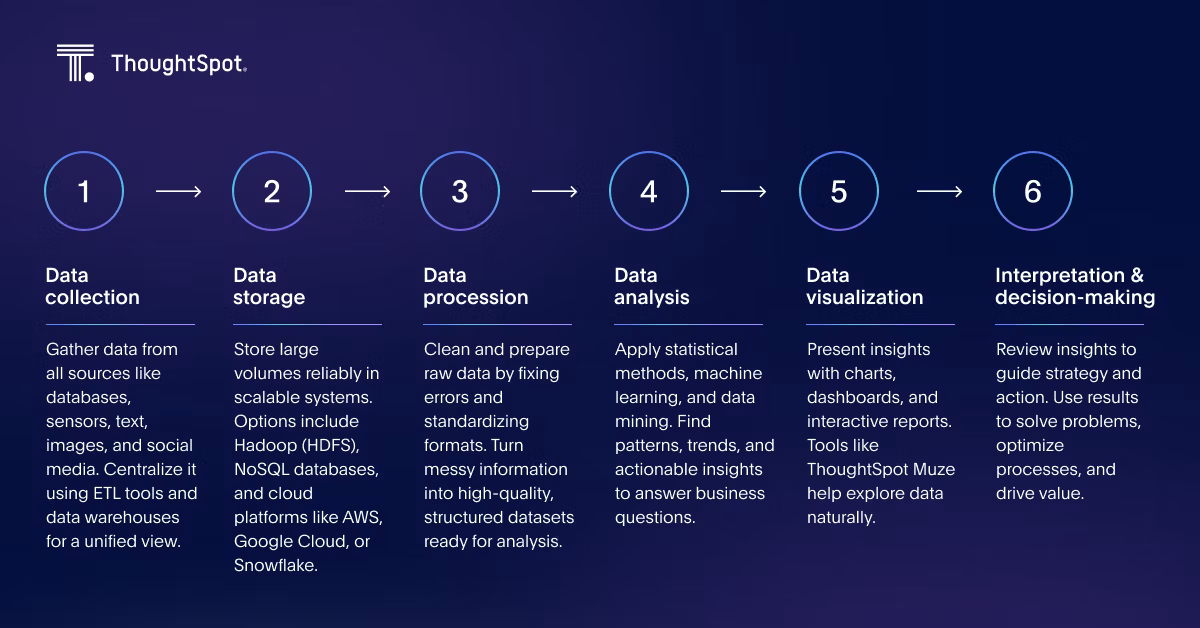
Step 1: Data collection
First, you need to gather all the raw data your organization generates. This might include structured sources like databases, semi-structured formats like JSON or XML, and completely unstructured sources like text documents, images, videos, and social media posts.
Key tools
Data warehouses often serve as centralized hubs, pulling everything together for a unified view.
Business intelligence tools can also help extract, transform, and load (ETL) data into your analytics pipeline, making sure it's ready for the next step.
Step 2: Data storage
Once collected, your data needs a reliable, scalable environment. Storage solutions must handle massive volumes while keeping data accessible for analysis. The right choice depends on your priorities around cost, speed, and flexibility. Common options include:
Big data platforms offer large-scale frameworks for distributed computing and high fault tolerance.
NoSQL databases are ideal for unstructured or semi-structured data with a schema that changes regularly.
Cloud-based platforms are flexible and easy-to-access databases that often offer pay-as-you-go pricing, making it easier to scale as your needs grow.
Step 3: Data processing
Raw data is rarely useful in its original form. It typically needs to be cleaned and prepared before analysis. This step involves handling missing or inconsistent data, converting it into standardized formats, and structuring it for exploration. In short, you're turning messy information into clean, high-quality datasets that can support accurate insights.
Data validation tools use predefined rules and benchmarks to verify the quality of your data.
Data cleaning tools help identify and correct missing values, duplicate data, outlier values, and other data that can throw off calculations.
Data transformation tools prepare your data for analytics through processes like normalizing, scaling, and encoding categorical variables.
Step 4: Data analysis
This is the core of the process, where raw information becomes useful insight. Using techniques like statistical analysis, machine learning, data mining, and predictive modeling, you can find patterns, correlations, trends, and answers to critical questions. It's how you move from "just data" to genuine business intelligence.
Statistical analysis tools use techniques like clustering and regression to find patterns and correlations in your data.
Machine learning and predictive modeling tools let you build predictive models that forecast anything from sales to stock prices to hospital admissions.
ThoughtSpot Analyst Studio is a flexible, accessible platform that gives your data teams the tools to build models with Python and R, while allowing business teams to query them through natural language and agent-powered AI.
Step 5: Data visualization
Analysis only creates value when people can understand and act on it. Data visualization makes insights accessible by turning complex results into charts, dashboards, and interactive reports that tell a clear data story. This step helps your team not just see the data, but also grasp what it means and how to respond.
Visualization tools like ThoughtSpot Muze help you present insights in clear, intuitive ways through charts, graphs, dashboards, and interactive reports.
Step 6: Interpretation and decision-making
Finally, it's time to put those insights to work. Analysts and decision-makers review the results to understand what they mean for the business. This is where you use what you've learned to solve problems, optimize processes, identify opportunities, and make smarter, faster decisions that drive real business value.
Scenario analysis and simulation tools give you an easy way to test "what-if" scenarios and assess the pros and cons of different strategies before committing to a course.
Collaborative decision platforms democratize data by making it available across the organization and provide features for analyzing and annotating data as a team.
Cognitive analytics is the latest frontier in data platforms. These AI-powered data suites answer questions using natural language and don't require any SQL knowledge.
This is exactly what ThoughtSpot was built for. To turn your data into a competitive edge that anyone on your team can actually use, not just data experts. Build models with Analyst Studio, then query them on the fly using Spotter, your AI agent, and move with confidence when it's decision time.
Depending on your business goals, you’ll use different types of analysis. Here’s how the five main approaches work and what they help you achieve:
1. Descriptive analytics: What happened?
This is the starting point. Descriptive analytics helps you understand what's already happened by summarizing historical data into clear patterns, reports, or dashboards. It answers questions like "How many units did we sell last month?" or "What's our average customer retention rate?"
Example: If you work in e-commerce, descriptive analytics are your foundation, the essential starting point for understanding your business. From SKU-level sales numbers to backordered products, descriptive analytics give you the tools to understand the trends in supply and demand that are currently affecting your operations. These insights help optimize inventory, measure customer satisfaction, and target customers more effectively with your marketing.
2. Diagnostic analytics: Why did it happen?
Once you know what happened, the next step is figuring out why. Diagnostic analytics digs into the root causes behind trends or anomalies. This might involve comparing segments, checking technical performance, or analyzing campaign activity.
Example: Marketing and SEO teams are often responsible for diagnosing sudden drops in traffic or click-through rates.. Big data lets them dig into fundamentals like load times and bounce rates, while also spotting patterns across social media, CRM records, purchase history, and vendor reports. Stronger diagnostic analytics make it easier to pinpoint root causes and improve marketing ROI.
3. Predictive analytics: What's likely to happen next?
This is where analysis shifts from hindsight to foresight. Predictive analytics uses machine learning and statistical models to forecast future outcomes based on historical data. It helps you make proactive decisions by anticipating what's coming.
Example: In healthcare, having the right data at the right time can save lives. If you're in a data-centric role with a healthcare provider, big data analytics tools can turn electronic health records (EHRs), medical imaging, and patient histories into actionable intel. Depending on what kind of data you have available, you might use it to identify trends, predict admission spikes, and tailor treatments to individual patients.
Firms like ZS Associates help healthcare clients adopt self-service predictive models, anticipating prescriber behavior or spotting patients at risk of dropping therapies.
The ecosystem has been quite sophisticated, talking about the AI use cases, you actually can predict the likelihood of a prescriber writing a script before a script is being written. You can actually prescribe, can actually predict a patient dropping a therapy before it actually drops, or you can actually predict a plan changing their formulary status before it actually happens.
Big data also advances pharmaceutical research by identifying promising drug candidates and streamlining clinical trials, bringing life-saving medications to market faster and more safely.
4. Prescriptive analytics: What should I do about it?
Prescriptive analytics takes it one step further by recommending specific actions. It doesn't just tell you what might happen, it helps you decide what to do next. Often, these recommendations come from AI models that simulate outcomes and weigh trade-offs.
Example: You can learn something from streaming giants like Netflix, which use data to analyze what you watch, like, or skip so they can recommend the perfect next show. It goes further: content creators study viewership trends to plan future productions, while media companies analyze audience data to target advertising more effectively.
As Netflix's VP of Data & Insights, Elizabeth Stone, explained on The Data Chief podcast, they use data to make bold, informed creative bets instead of playing it safe. It's about pushing themselves to innovate while staying tuned to what viewers actually want.
"We don't want to be fearful of placing big bets. We want to be constantly pushing ourselves to be more innovative and certainly more excellent over time. And we want to use data and analytical thinking to really try to make the best decisions we can."
5. Real-time analytics: What's going on right now?
Real-time analytics provides up-to-the-minute insights from sources like transaction databases, cloud infrastructure, social media activity, and IoT sensors. When it's your job to respond to rapidly changing situations, real-time big data analytics delivers the data that you need to make critical choices.
Example: Big data analysis also supports emergency response, helping predict and monitor natural disasters or disease outbreaks. During the COVID-19 pandemic, San Francisco's DataSF initiative used data to address real-time challenges, improve public services, and enhance the quality of life for you and your community.
DataSF's mission is to empower the use of data. We seek to transform the way the City works through the use of data. We believe the use of data and evidence can improve our operations and the services we provide. This ultimately leads to increased quality of life and work for San Francisco residents, employers, employees, and visitors.
“Big data” often gets tossed around as a buzzword, but paired with the right data analytics strategy, it becomes far more than hype. It turns raw information into actionable insights that drive measurable results. Here are some of the areas where big data analytics delivers the most value.
Informed decision-making
You can’t afford to rely on old reports or gut instincts when making important choices. Big data analytics lets you dig into huge, complex datasets to find the answers you need when you need them. This helps you base decisions on evidence, not intuition, so you can act faster and with more confidence.
Resource and cost efficiency
Every part of your business generates data—from production lines and supply logs to service tickets and support interactions. By analyzing it closely, you find hidden inefficiencies that would otherwise stay buried.. With those insights, you can redesign workflows, reduce waste, and optimize resource allocation. The result is lower costs, operational excellence, and a foundation that scales sustainably with your business.
Personalized customer experiences
Your customers expect you to know them. By understanding purchase history, preferences, and behaviors, you can tailor products, services, and marketing to each individual. Instead of generic outreach, you deliver meaningful, personalized experiences. Happier customers mean higher customer loyalty and reduced churn because you're meeting their needs proactively.
Supply chain optimization
Your supply chain is full of valuable data, from inventory levels to delivery times. Careful analysis gives you a clearer picture so you can predict demand, avoid stockouts, and minimize overstocking. Better visibility leads to smoother logistics and more reliable delivery for customers. In the end, you save money and build a stronger, more resilient supply chain.
Optimizing marketing strategies
Marketing is as much science as art. By studying customer behavior and campaign results with marketing data analytics tools, you can see what really works. These tools help you segment audiences more precisely and deliver the right message at the right time. The result? Smarter spending, better ROI, and marketing that actually connects.
Risk management
Every business faces risk, whether financial, operational, or strategic. Big data analytics helps you prepare by modeling possible scenarios and outcomes. I. For example, banks can predict which borrowers may default, while manufacturers might assess the financial impact of supply disruptions. By understanding potential risks early, you gain the ability to take preventive action, mitigate damage, and build resilient systems that stand strong under pressure.
Turning massive amounts of data into clear, actionable insights is easier said than done. Here's what most teams discover: becoming truly data-driven isn't just about buying the right tools. You'll face technical hurdles, cultural resistance, and strategic challenges along the way.
Here are the most common challenges and how to tackle them:
1. Data security and privacy
Managing vast volumes of sensitive information, from customer details to financial records, brings serious security and privacy risks. A single breach can erode trust and lead to legal consequences.
To address this, you need strong data governance frameworks, secure infrastructure, and compliance with regulations like GDPR or HIPAA. Regular audits, encryption, and careful vetting of third-party tools help minimize risk.
2. Technical complexity and scalability
Big data isn't just big, it's messy, fast-moving, and varied. Integrating data from many sources, cleaning it, and processing it at scale can strain even modern IT systems. Options include distributed storage frameworks, cloud-based services, and user-friendly analytics tools.
Wellthy, for example, replaced manual, code-heavy reporting with ThoughtSpot's self-service analytics, cutting bottlenecks and boosting active user adoption by 281%.
3. Data quality and trust
Even the most advanced analytics can fail if the data itself is flawed. Incomplete, inconsistent, or outdated data leads to unreliable insights, and your users don't trust the data, they won't act on it.
Overcoming this requires strong data management practices like cleaning and validating data, defining clear ownership and stewardship, and making data lineage transparent so everyone knows where the numbers come from.
4. Skill gaps and organizational readiness
It's not just about having data, it's about having people who know how to use it. Data science, engineering, and domain expertise are all in demand, while many business users still lack data literacy.
Bridging this gap means hiring where needed but also investing in training, promoting self-service tools, and building a culture where asking questions of data is encouraged and supported.
5. Cost and resource constraints
Big data projects can be expensive, involving infrastructure, software licenses, skilled staff, and training. You may struggle if you're at a smaller company to justify or sustain these investments.
Cloud-based, pay-as-you-go options can help reduce upfront costs and scale with usage. You can also prioritize high-value use cases first to demonstrate ROI before expanding.
6. Change management and culture
Even with the best technology in place, change can be hard. Teams may resist new tools or distrust data-driven recommendations, while organizational silos can keep valuable data locked away.
You'll be most successful when you focus on building buy-in across the organization, communicating clear goals and benefits, demonstrating early wins, and making data-driven decision-making part of everyday work.
Turn spreadsheets into powerful insights with a demo
Big data analytics isn’t just about insight, it’s about impact. The value comes when those insights translate into smarter decisions, faster execution, and a culture where data guides every move.
That’s where ThoughtSpot stands apart. The agentic analytics platform makes advanced AI-powered analysis intuitive and accessible for everyone in your organization. Analyst Studio helps data teams prepare and model data for AI, while ThoughtSpot Embedded brings answers directly into the apps and workflows your business runs on. The result is operational excellence, stronger customer experiences, and a competitive edge you can measure.
Ready to move from information overload to real business impact? Schedule a demo and see how ThoughtSpot makes it possible.
FAQs
How is big data analytics different from traditional BI?
Traditional BI often focuses on structured, historical data and predefined reports. Big data analytics handles much larger, messier, and faster-moving data, including unstructured data sources, and often uses advanced techniques like predictive modeling and natural language search to find insights.
What skills do teams need for big data analytics?
While traditional approaches require deep technical skills like data engineering and machine learning, modern platforms like ThoughtSpot are changing the game. With natural language search and AI agents, your business users can get insights without SQL knowledge or waiting for data teams. You still need data literacy across the business. This means everyone should feel comfortable asking questions about data, understanding basic concepts like correlation and causation, and interpreting visual dashboards.
How do I know if my business needs big data analytics?
If you're dealing with large volumes of data from multiple sources (sales systems, customer interactions, IoT devices, social media), and you're struggling to get clear answers quickly, you're a good candidate. Even mid-sized companies can benefit if they want to move from intuition-driven decisions to data-informed ones.


