


One of the core facts of data analytics is that it's not just one process; it's a spectrum of methods that answer different questions about your business. Understanding which type of analytics to use determines whether you're simply reviewing what happened last quarter or actively shaping what happens next.
This guide breaks down the four analytical approaches and shows you how to apply each one to extract meaningful insights from your data. Whether you're tracking KPIs, investigating performance issues, forecasting trends, or optimizing decisions, knowing which analysis type fits your question will help you move faster and with greater confidence.
What is data analytics?
Data analytics is the systematic process of examining, transforming, and modeling data to uncover meaningful patterns and insights that inform business decisions. The different types of data analytics help you move from basic historical reporting to future predictions and actionable recommendations.
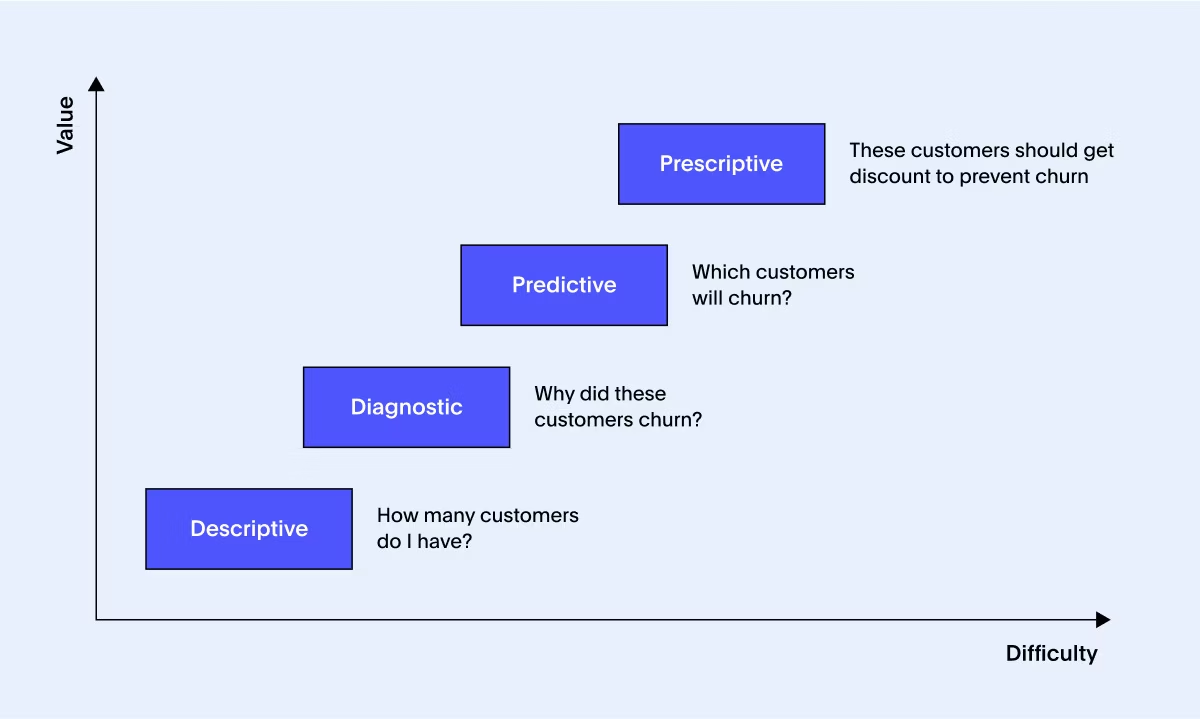
The most common model of data analytics organizes it into four core methods that build on one another:
Descriptive analytics: What happened in your business?
Diagnostic analytics: Why did specific events occur?
Predictive analytics: What is likely to happen next?
Prescriptive analytics: What should you do about it?
Each type serves different purposes in your decision-making process. Here’s a quick cheat sheet to help you remember the differences between each analytics layer.
|
Type |
Key question |
Purpose |
Common techniques |
Example |
|
Descriptive |
What happened? |
Summarize the past |
Data aggregation, dashboards, visualizations |
Monthly revenue reports |
|
Diagnostic |
Why did it happen? |
Find root causes |
Anomaly detection, regression, root cause analysis |
Customer churn analysis |
|
Predictive |
What might happen next? |
Forecast future events |
Machine learning, time series, classification |
Sales forecasting |
|
Prescriptive |
What should we do about it? |
Recommend next steps |
Optimization models, simulations, decision trees |
Marketing campaign optimization |
How the four types of data analytics work together
Let's walk through employee churn to see how these four approaches complement each other. Each step gives you a deeper understanding, moving from observation to action.
Descriptive analytics reveals the problem
You start by examining historical data and discover your sales department had a 15% churn rate last quarter. That's a 5% increase from the previous quarter. Descriptive analytics has shown you that there's a problem, but to find out why, you'll need to go to the next level.
Diagnostic analytics finds the cause
Next, you use diagnostic analytics to investigate the root cause. By analyzing exit interviews, performance reviews, and compensation data, you find that departing employees worked 20% more overtime hours and earned below-average commission payouts. Now you understand why people left.
Predictive analytics identifies future risks
Using this historical pattern, you build a predictive analytics model to spot current employees with similar profiles. The model flags five salespeople who match the overtime and commission patterns of previous departures, meaning there's a strong chance they might be at risk of churning.
Prescriptive analytics recommends action
Finally, you determine what to do next using prescriptive analytics, which helps you evaluate your course of action. Based on your insights, you might implement a new commission structure or conduct workload reviews for at-risk employees. This step helps you weigh the risks and benefits of your solutions, so you can decide with greater clarity and confidence.
Let’s break each one down further.
Descriptive analytics summarizes historical data to give you a clear, digestible snapshot of past performance, often in the form of charts, tables, dashboards, or interactive reports. It’s the foundation of data analysis, and usually the first step when trying to understand trends or patterns.
How it works
Step 1: Define what you want to analyze
Step 2: Gather relevant data
Step 3: Clean and prepare your dataset
Step 4: Summarize using statistical techniques
Step 5: Visualize findings with BI tools like ThoughtSpot
Real-world examples
Understanding customer behavior: You’ve got survey results, support tickets, and user activity data piling up. Descriptive analytics helps turn that chaos into clarity. You might discover that customers consistently struggle with onboarding or that a particular feature is driving the most engagement, insights that can shape product updates and improve experience across the board.
Tracking financial performance: Descriptive analytics is a go-to tool for finance teams to keep tabs on revenue, expenses, and margins. Whether you’re reviewing quarterly performance or comparing this year’s spend to last year’s, it gives you the context you need to make smarter budget decisions and spot unusual patterns early.
Monitoring supply chain efficiency: From delivery timelines to vendor reliability, descriptive analytics brings much-needed visibility into supply chain operations. By looking at historical trends, teams can pinpoint what’s slowing things down, flag recurring disruptions, and find ways to streamline everything from inventory planning to logistics.
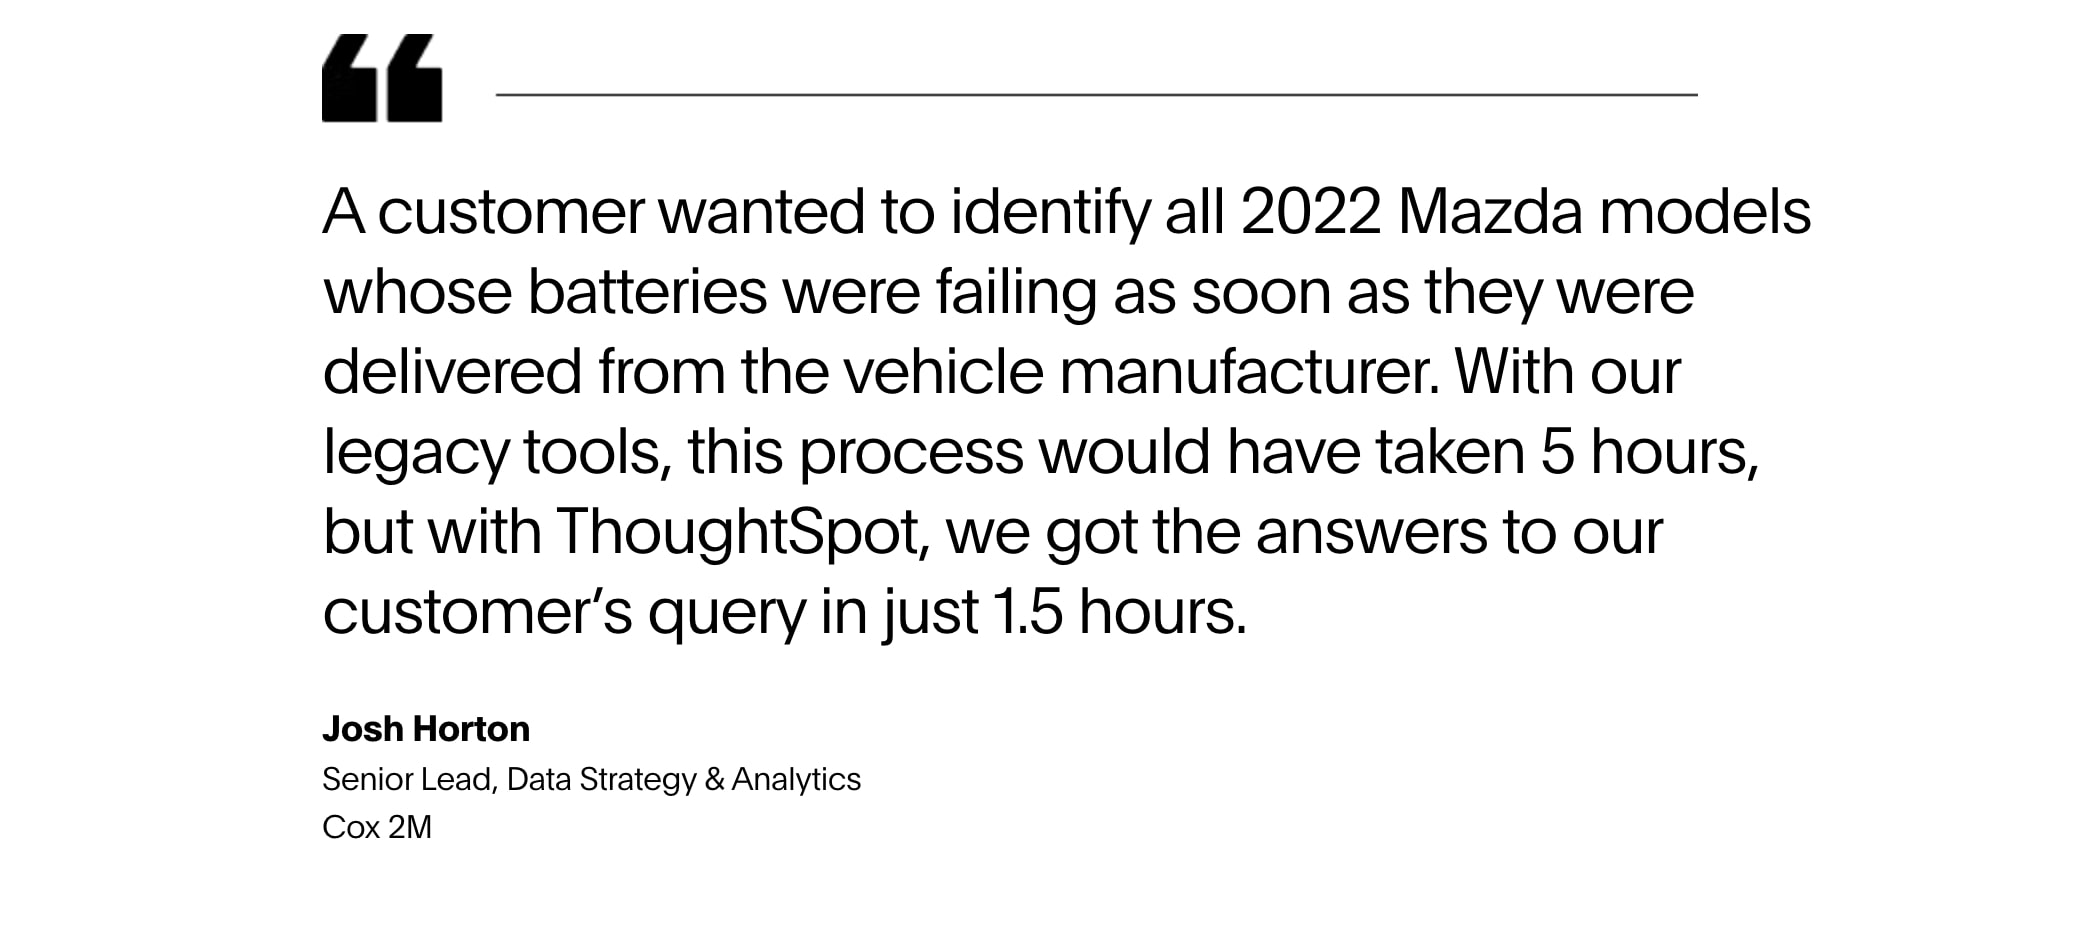
Cox 2M used ThoughtSpot to cut time-to-insight by 76% and reduce reporting costs by $70K. Instead of waiting on static dashboards, teams now get answers instantly using AI-powered search and contextual insights.
When performance unexpectedly dips or soars, you need to know why. Diagnostic analytics digs into the contributing factors using historical data, statistical techniques, and domain context.
How it works
Step 1: Identify the event or anomaly
Step 2: Collect and clean relevant data
Step 3: Apply techniques like regression analysis, anomaly detection, and hypothesis testing
Step 4: Visualize your findings and communicate the story behind the numbers
Real-world examples
Healthcare: When patients keep coming back after treatment, doctors need to understand why. Diagnostic analytics helps analyze patterns across readmission cases, like whether certain procedures, medications, or discharge timelines are linked to better or worse recovery outcomes.
Churn analysis: If cancellation rates suddenly spike, diagnostic analytics can help pinpoint the cause. Maybe a recent pricing update frustrated long-time users, or a buggy feature started causing headaches. Instead of guessing, teams can trace behavior patterns and feedback data to get to the root of the issue.
Traffic drops: Not all performance drops are immediately obvious. Diagnostic analytics lets web and SEO teams drill into data across traffic sources, page performance, and site health to pinpoint the reason behind the decline.
With the team of Spotter AI analysts natively integrated into ThoughtSpot, you can instantly surface the reasons behind anomalies, outliers, and performance shifts. Instead of manually slicing and dicing your data, just ask Spotter: “Why did sales drop in the West region last week?”—and get a contextual breakdown that’s ready to act on or drill into further.
Predictive analytics uses patterns in historical data, combined with statistical models and machine learning algorithms, to make informed guesses about future outcomes. It’s not a crystal ball, but it’s a powerful way to anticipate trends, risks, or opportunities before they hit.
How it works
Step 1: Define the problem
Step 2: Collect relevant historical data
Step 3: Clean the data
Step 4: Choose a modeling technique (e.g., regression, time series, clustering)
Step 5: Train and test your model
Step 6: Apply insights to real-world scenarios
Real-world examples
Inventory planning: You’re launching a new product. How much should you stock? Order too little and you risk stockouts and missed sales. Too much, and you’re stuck with inventory you can’t move. Predictive analytics helps you forecast demand based on past trends, seasonality, and even local buying patterns so you can make sharper calls and keep your shelves balanced.
Sales forecasting: Predictive analytics can alert you when pipeline velocity slows, win rates drop, or key accounts stall, so there’s no need to wait for a nasty end-of-quarter surprise. With tools like ThoughtSpot, sales leaders can track changes as they happen and employ strategic shifts like reassigning reps, reworking outreach, or doubling down on what’s working.
Fraud detection: As scams get more sophisticated, financial institutions are turning to predictive analytics to stay ahead. By analyzing transaction patterns, behavioral signals, and historical fraud data, banks can flag anomalies before damage is done, saving time, money, and customer trust.
Macquarie Bank is one example. Rather than relying on reactive methods, their data team takes a proactive, two-pronged approach: educating customers while using AI and machine learning to spot suspicious activity in real time. On The Data Chief podcast, Chief Data Officer Ashwin Sinha noted that AI is a key component of these cutting-edge methods:
“What prompt engineering and GenAI broadly do is take away the low-value tasks so analysts can focus on the high-impact work.”
That’s becoming an increasingly common theme as more businesses come to rely on tools like AI agents to level up their data infrastructure.
Prescriptive analytics is where data analytics shifts from insight to action. It combines advanced models, business rules, and scenario testing to suggest concrete next steps.
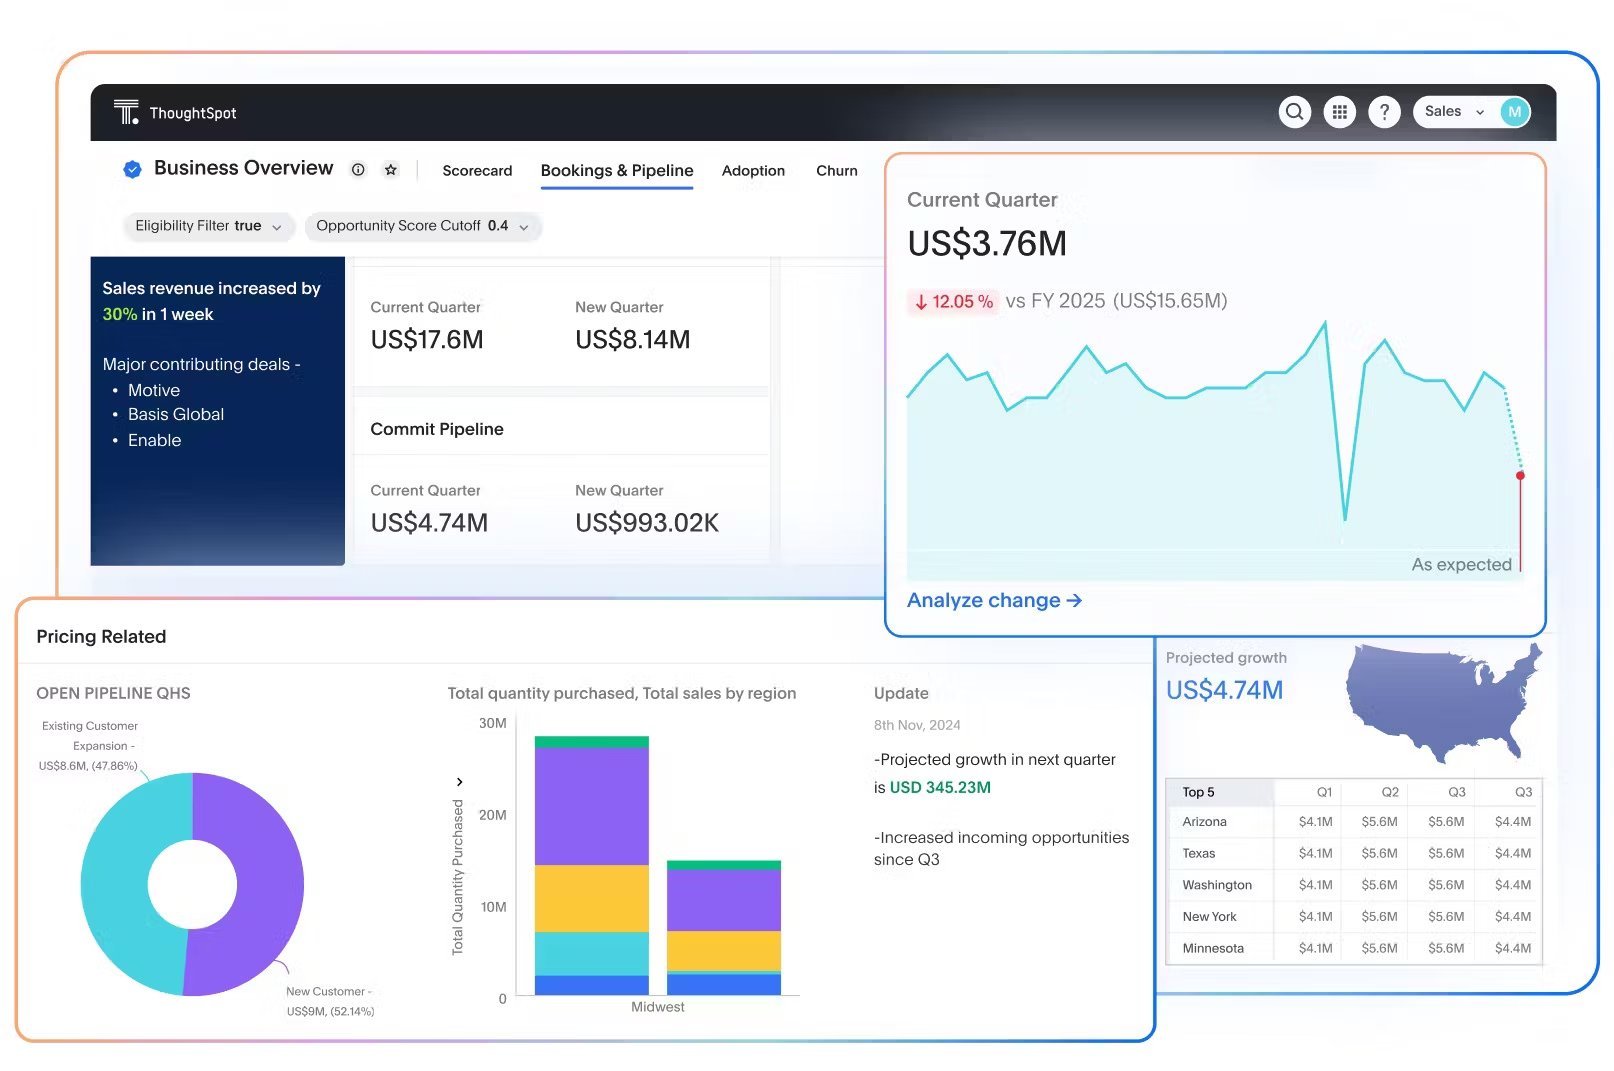
ThoughtSpot is built with natively-integrated AI-augmented dashboards, so you don’t have to wait on custom builds or complex queries. You can simulate scenarios, explore recommendations, and drill down into key drivers, all using a natural-language interface that makes it incredibly simple to follow the numbers where they lead.
Real-world examples
IT backlog management: When internal support queues start piling up, it’s easy for things to fall through the cracks. Snowflake tackled this head-on with prescriptive analytics. Instead of reacting ticket by ticket, they used data to identify patterns, prioritize the most critical requests, and reroute work more efficiently, cutting their IT backlog by 20%.
Employee upskilling: Prescriptive analytics helps HR move beyond mandatory learning modules. Instead, it surfaces personalized growth paths based on role requirements, team needs, and employee goals. So, rather than pushing blanket training programs, you’re helping each person level up in ways that actually move the needle.
Ad campaign optimization: Imagine your cost-per-click jumps from $0.50 to $20 overnight. Without the right systems, you might not catch it until the budget’s gone. Prescriptive analytics not only flags the issue, but suggests how to fix it, whether that’s pausing a campaign, adjusting bidding strategy, or reallocating spend.
Common mistakes to avoid
As you apply these different analytical approaches, watch out for these pitfalls that can undermine your results:
Jumping ahead: If you haven’t established a robust conceptual model for your data, you could be setting yourself up for future issues when your models or data pipelines turn out to be misaligned with your needs.
Correlation versus causation: Two events happening simultaneously doesn't mean one caused the other. Always seek additional evidence before drawing conclusions.
Poor data quality: Inaccurate or incomplete information will produce flawed insights unless you first establish data reliability.
Model overfitting: When predictive models align too closely with training data, they become less accurate on new, real-world information.
Blind trust in AI: While there are tons of AI tools on the market that promise powerful assistance, human oversight remains necessary for context, validation, and final decisions.
On the other hand, don't let perfectionism prevent you from starting. Your data will never be completely clean, but you can still generate valuable insights. As Dr. Katia Walsh says on The Data Chief: "You will never have perfect data, and that's okay... Did we wait for the perfect data? No. Did we wait for even the perfect models? No. Did we make sure that we solve the problem right when we needed it? Yes, absolutely."
Who uses different types of data analytics
Different roles across your organization will apply these analytical approaches in unique ways. No matter what type of role you’re in, however, there’s almost always an opportunity to apply the power of data analytics to your work:
Executives: Use descriptive analytics through high-level dashboards to monitor business health and prescriptive analytics for strategic guidance.
Marketing: Data analytics will allow you to apply descriptive analytics for campaign tracking, diagnostic for customer behavior analysis, and predictive for trend forecasting.
Finance departments: Employ descriptive analytics for reporting, predictive analytics for budgeting, and prescriptive analytics for investment decisions.
Operations and IT: You'll likely use all four types to streamline processes, from performance monitoring to predictive maintenance.
Data professionals: Act as power users, implementing all analytical types to support business stakeholders and build underlying systems.
How to get started with modern analytics
Whether you’re just getting started or looking to level up, here’s how to make sure your analytics stack is actually useful:
If you're new to this:
Start with clean data. It’s not the flashiest step, but it’s the foundation everything else depends on.
Use descriptive analytics to understand what’s already happened and establish your baseline metrics.
Once you’ve got that down, start asking “why” things happened and “what might happen next.”
If you're ready to go further:
Focus on impact. Look for pain points like churn, sales slowdowns, or operational bottlenecks.
Bring in predictive analytics where past patterns can help forecast what’s ahead.
Use prescriptive analytics when you need a clear recommendation, not just a trend.
Skip the dashboard drag and implement agent-powered analytics, so anyone can go from question to answer.
The new breed of agile data analytics
Modern platforms let you move naturally between analytical types. Wellthy, a caregiving benefits platform, implemented ThoughtSpot's search-driven analytics to solve a common bottleneck: analysts overwhelmed by SQL requests while business users waited days for answers. After adding self-service analytics via ThoughtSpot, stakeholders performed their own descriptive and diagnostic analysis through natural language search, freeing analysts for predictive and prescriptive work. Analyst output doubled, monthly active users jumped 281%, and the company saved over $200,000.
Look for platforms that support data exploration through natural language search, letting you ask follow-up questions without SQL knowledge. For teams ready to build predictive and prescriptive models, tools like ThoughtSpot Analyst Studio combine advanced capabilities (SQL, Python, R) with accessibility for business users who need to act on those insights.
When you can move seamlessly from "What happened?" to "Why?" to "What's next?" to "What should we do?"—all in one conversation with your data—you're applying the full spectrum of analytical types where they matter most. Start your free trial to see how this approach transforms your decision-making speed.
Different types of data analysis: Frequently asked questions
1. What's the difference between data analysis and data analytics?
Data analysis refers to the broad process of exploring information to find insights, while data analytics describes the specific methods and tools used to perform that analysis at scale. Think of analysis as the "what" and analytics as the "how."
2. Which type of data analytics should I start with first?
Always begin with descriptive analytics to understand what happened in your business. From there, use diagnostic analysis to discover why events occurred, predictive to forecast what's next, and prescriptive to determine your response.
3. Do I need coding skills to perform different types of data analysis?
Modern analytics platforms eliminate coding requirements for end users through natural language search and AI assistance. While modeling the data still requires technical expertise, once that foundation is in place, business users can ask questions and receive instant visualizations without writing SQL or learning complex interfaces.
4. Can AI automatically recommend the right analytical approach for my business problem?
Yes, modern agentic AI platforms can guide your analysis journey. For example, after showing you a trend through descriptive analytics, an AI analyst might automatically surface the key drivers behind it through diagnostic analysis and suggest relevant follow-up questions.
5. Can I use multiple types of analytics in the same project?
Absolutely. In fact, most high-impact use cases blend multiple types. For example, you might use descriptive analytics to understand churn, diagnostic to pinpoint causes, predictive to flag who’s at risk, and prescriptive to recommend next steps.
6. What’s the biggest blocker to moving from descriptive to predictive analytics?
It's not always technology; it’s often trust and data readiness. Teams hesitate to act on predictive insights if they don’t trust the underlying data or don’t fully understand the models. Clean data and transparent methods go a long way.
7. How do embedded analytics relate to these four types?
Embedded analytics brings all four types directly into the tools your teams already use, like Salesforce, ServiceNow, or Google Sheets, so they can make data-informed decisions in the moment. With ThoughtSpot Embedded, you can embed search, Liveboard Insights, and AI-generated insights right into apps and workflows, turning static interfaces into interactive decision hubs.
8. Can I use multiple types of analytics in the same project?
Absolutely. In fact, most high-impact use cases blend multiple types. For example, you might use descriptive analytics to understand churn, diagnostic to pinpoint causes, predictive to flag who’s at risk, and prescriptive to recommend next steps.
9. What’s the biggest blocker to moving from descriptive to predictive analytics?
It's not always technology, it’s often trust and data readiness. Teams hesitate to act on predictive insights if they don’t trust the underlying data or don’t fully understand the models. Clean data and transparent methods go a long way.
10. How do embedded analytics relate to these four types?
Embedded analytics brings all four types directly into the tools your teams already use, like Salesforce, ServiceNow, or Google Sheets, so they can make data-informed decisions in the moment. With ThoughtSpot Embedded, you can embed search, Liveboards, and AI-generated insights right into apps and workflows, turning static interfaces into interactive decision hubs.


