


When your metrics move, the first question you ask isn’t usually “What happened?” It’s “Why?”
Why did sales dip? Why are customers churning? Why are project timelines slipping?
That is where diagnostic analytics comes in. It’s a core part of modern data analysis that helps you move past surface-level trends and dig into the root causes behind what is going on in your business.
In this guide, we will break down what diagnostic analytics is, how it fits into the broader analytics stack, the techniques behind it, and how forward-thinking companies are applying it today.
Table of contents:
- What is diagnostic analytics?
- Comparing the different types of data analytics
- Benefits of diagnostic analytics
- Types of diagnostic analytics
- How does diagnostic analytics work?
- Diagnostic analytics examples
- Common challenges in diagnostic analytics
- Future trends in diagnostic analytics
- Speed up your ‘why’ with agent-powered analytics
Diagnostic analytics is a type of data analytics that uses past data to find factors and variables that contributed to the outcomes of particular events. It goes beyond simply reporting the numbers and digs into the underlying causes and relationships that explain shifts in performance.
It sits between descriptive analytics (what happened) and predictive analytics (what is likely to happen), acting as the bridge between past events and future strategies. By identifying patterns, correlations, and root causes, diagnostic analytics gives you the context you need to respond with confidence.
Instead of reacting blindly to changes in metrics, you get to ask and answer the question behind the numbers.
For example:
Descriptive analytics: Churn increased 15 percent last month
Diagnostic analytics: Churn increased because customer satisfaction scores dropped after a new support policy was implemented
In short, diagnostic analytics connects the dots, reveals the “why” behind the “what,” and helps your team take smarter action moving forward.
To understand the role of diagnostic analytics, it helps to understand how it connects to the full analytics lifecycle. Businesses that thrive on data rarely rely on a single type of analysis. Instead, they use a layered approach that combines four key types of analytics, each building on the other.
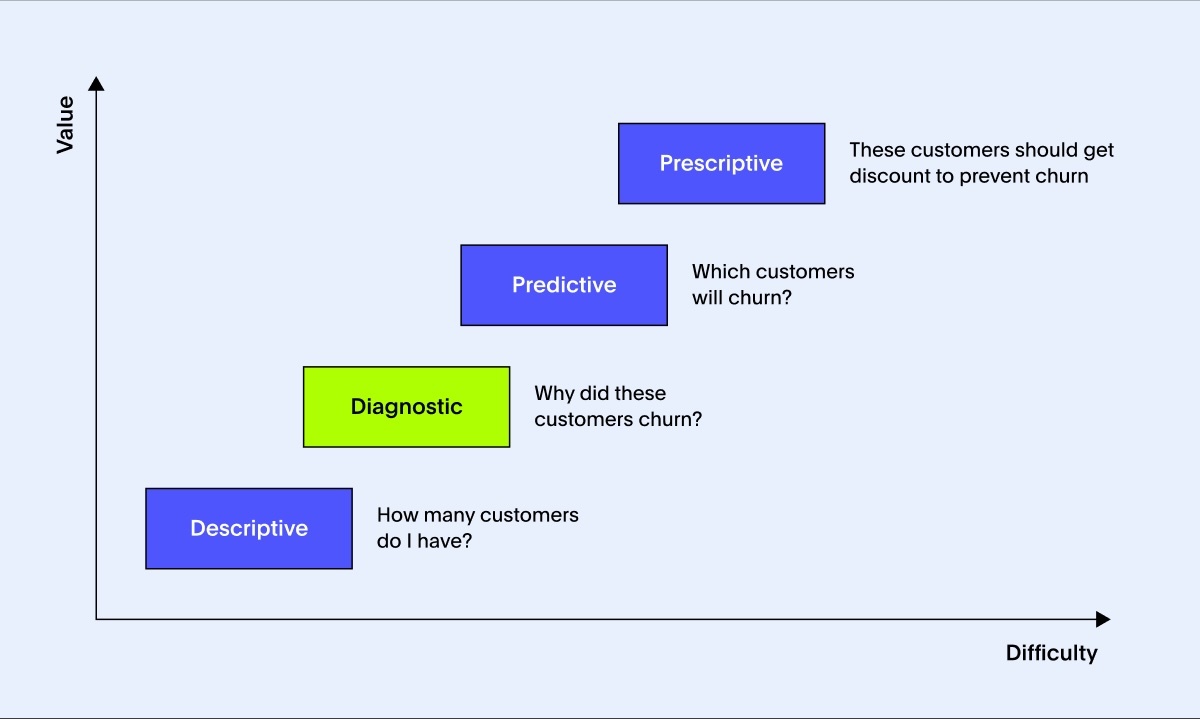
Descriptive analytics
Focuses on what happened
Descriptive analytics summarizes past data to highlight trends, shifts, and outcomes. It helps you understand where your business has been, but stops short of explaining why those changes occurred.
Example: How many customers do I have? → In Q2, you gained 3,200 new customers but lost 660, ending the quarter with 19,840 active customers.
Diagnostic analytics
Answers why it happened
Diagnostic analytics digs beneath surface-level metrics to discover drivers and relationships that explain changes in performance. It gives your team the context they need to act, rather than reacting blindly.
Example: Why did these customers churn? → After reviewing support tickets and onboarding data, you found that over half of the 660 lost customers experienced delays or issues during their first month of service.
Predictive analytics
Looks ahead to what is likely to happen next
Predictive models use statistical techniques and machine learning to forecast future trends. These insights allow businesses to anticipate risks and opportunities rather than simply responding to them.
Example: Which customers will churn? → Your churn model predicts that 1,100 customers who faced early service issues or had limited interaction in their first 30 days are at high risk of leaving in Q3.
Prescriptive analytics
Focuses on what to do about it
Prescriptive analytics turns insights into action. It recommends specific strategies based on diagnostic and predictive findings, helping teams take proactive steps that drive business outcomes.
Example: These customers should get a discount to prevent churn. → Offer a 15% discount to the top 500 at-risk customers and follow up with personalized support or welcome campaigns to re-engage the rest.
When you bring these four types of analytics together, you create a closed-loop system where data drives continuous improvement. Descriptive analytics provides hindsight. Diagnostic analytics adds insight. Predictive analytics offers foresight. And prescriptive analytics drives action.
Many businesses still rely on gut feeling or assumptions when making critical decisions, and that can backfire. Gartner reports that 83 percent of business strategies fail due to faulty assumptions. Diagnostic analytics helps avoid those costly mistakes by offering benefits like:
Clearer visibility
Smarter decisions
Process improvements
Better customer experiences
Risk reduction
Clearer visibility
By digging deep into past data, diagnostic analytics reveals the root causes behind bottlenecks and inefficiencies. With these insights, leaders can streamline workflows, better allocate resources, and shorten lead times.
Smarter decisions
Diagnostic analytics reveals important trends, flags anomalies, and supports root cause analysis. This means decisions are based on facts, not guesswork.
Process improvements
Understanding correlations and cause-effect relationships allows you to pinpoint exactly which parts of your operations need attention. This makes it easier to roll out targeted improvements that boost overall performance.
Better customer experiences
Figuring out why customers churn can feel like trying to solve a mystery. Diagnostic analytics highlights the key moments in the customer journey that trigger churn and spots unusual patterns. These insights help you address unmet needs, tailor experiences, and ultimately keep more customers.
Risk reduction
Spotting risks early is vital for long-term success. Diagnostic analytics learns from past data to improve risk management strategies. For example, banks use it to analyze credit history and repayment behaviors, helping refine lending practices and reduce defaults.
Diagnostic analytics examines data to identify the underlying causes of business outcomes. It’s a crucial step in moving from simply knowing what happened to understanding why it happened and what you might do about it.
To get there, teams use a variety of techniques, each suited for different types of questions and data complexities.
Hypothesis testing
Anomaly detection
Root cause analysis
Correlation analysis
Diagnostic regression analysis
1. Hypothesis testing
This method involves creating a testable assumption about the data, for example, "Did the new marketing campaign increase sales?" Using statistical tests, analysts evaluate whether the observed differences in data are significant or could have occurred by chance. It’s a critical way to validate insights and avoid jumping to conclusions based on random fluctuations.
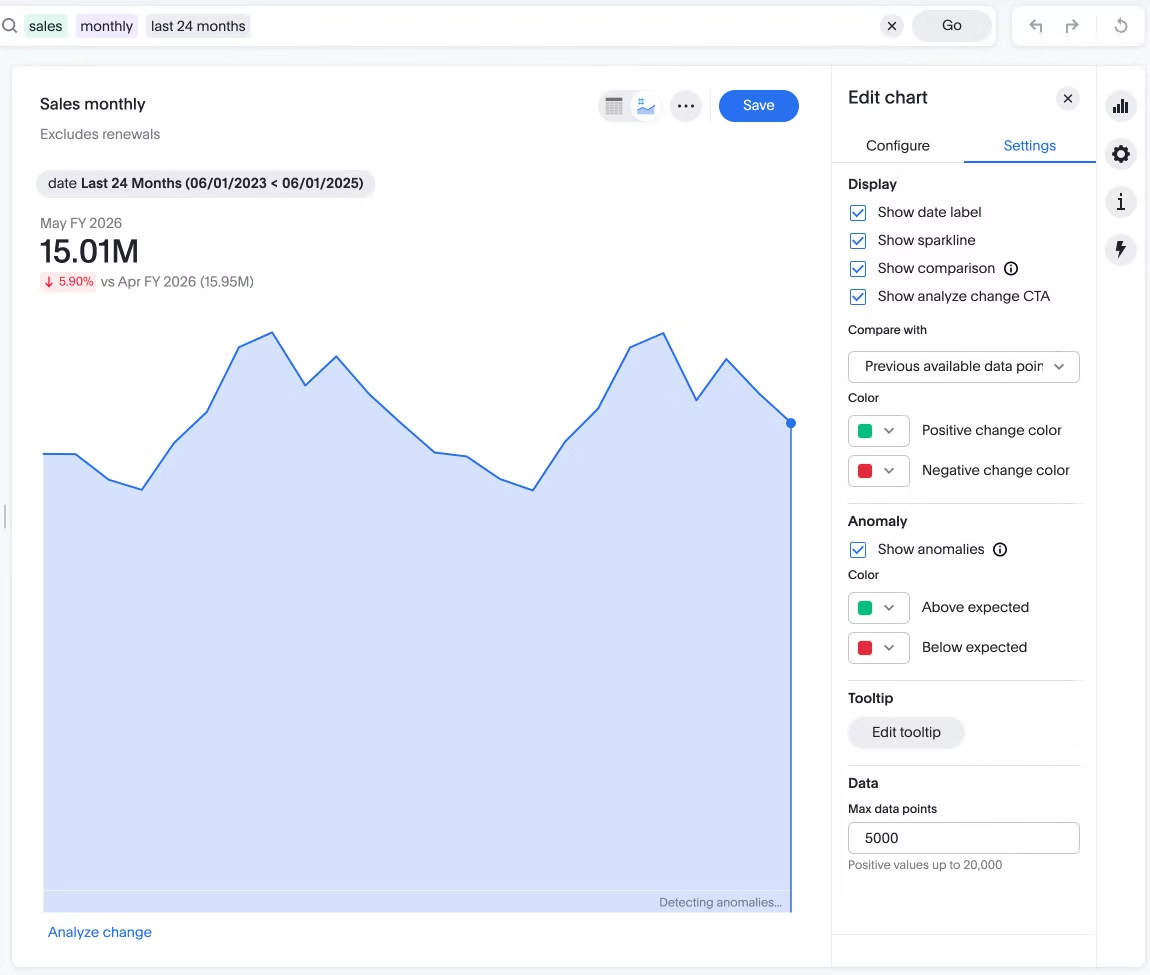
2. Anomaly detection
Anomaly detection is like having a sensor for anything unusual in your data. For example, if website traffic suddenly spikes or drops in a way that doesn’t fit historical patterns, anomaly detection flags it. This can locate emerging problems such as fraud, system failures, or unexpected shifts in customer behavior before they become bigger issues.
3. Root cause analysis
The root cause analysis approach is often used after identifying a problem to trace back to its source. Techniques like the 5 Whys or fishbone diagrams help teams systematically explore potential causes. For instance, if a product recall happens, root cause analysis digs into whether the issue came from manufacturing defects, supplier errors, or process breakdowns.
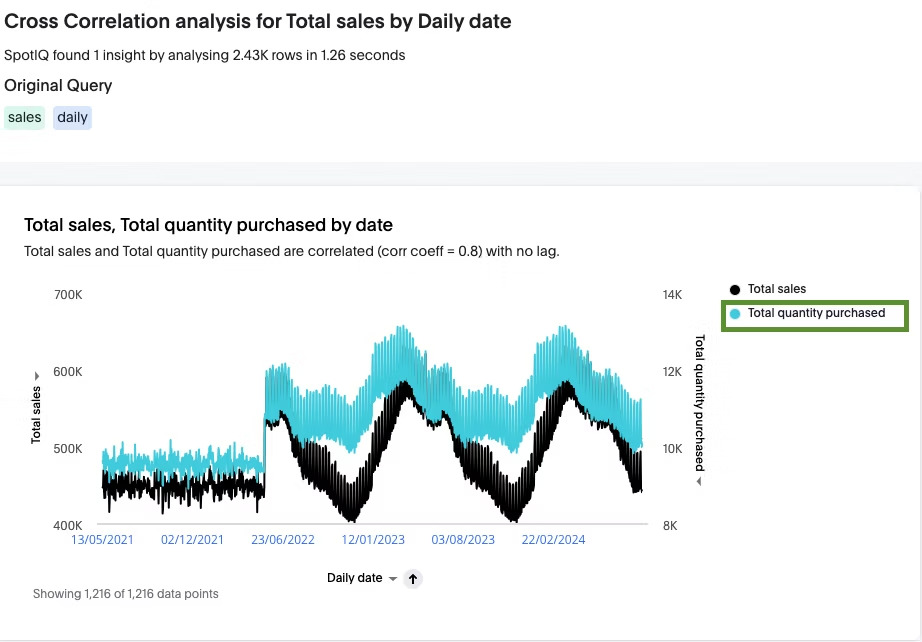
4. Correlation analysis
Not all relationships between variables imply causation, but correlation is a good starting point. If sales dip at the same time customer service complaints rise, correlation analysis quantifies how closely those two metrics move together. It helps prioritize where to dig deeper, but requires further analysis to confirm causality.
5. Diagnostic regression analysis
Regression techniques take correlation further by modeling how multiple factors simultaneously affect an outcome. For example, a retailer might use regression to understand how pricing, seasonality, and advertising together influence monthly sales. This helps estimate which drivers have the biggest impact and by how much.
Beyond these, newer tools like ThoughtSpot’s agent-powered analytics platform let users explore diagnostic questions using natural language queries. This speeds up the process and opens it up to non-technical users, who can simply ask, “Why did product returns increase in Q2?” and get instant, data-driven answers.
ThoughtSpot helps teams dig into root causes faster and make smarter decisions with less dependence on specialized data skills.
Diagnostic analytics isn’t just about running statistical tests; it’s a thoughtful process that combines business context, data expertise, and the right tools to find actionable insights. Here’s a more detailed look at the workflow:
Step 1: Define the problem
Step 2: Collect relevant data
Step 3: Process the data
Step 4: Choose the right analytic technique
Step 5: Apply statistical methods
Step 6: Visualize the data
Step 7: Interpret the results
Step 1: Define the problem
Starting with a clear problem statement helps align the team and focus the investigation. Instead of a vague “Why are sales down?” it might be, “Why did sales drop 10% in the Northeast region in April compared to March?” A well-defined problem narrows the scope and drives more meaningful analysis.
Step 2: Collect relevant data
Data comes from many sources—CRM systems, web analytics, financial records, customer surveys, unstructured data like emails or social media comments, and more. Analysts work to gather data that directly relates to the problem, ensuring they have enough context but avoid noise that can muddy the results.
Step 3: Process the data
Raw data often contains errors, missing values, or inconsistencies that can skew analysis. Data cleaning involves standardizing formats, filling gaps, and removing duplicates. Good data hygiene is critical because diagnostic analytics depends on reliable information.
Step 4: Choose the right analytic technique
Depending on the question and data type, analysts select methods like hypothesis testing, regression, or anomaly detection. For example, if you want to test if a recent policy caused customer churn to increase, hypothesis testing might be the best fit.
Step 5: Apply statistical methods
This step involves crunching numbers using tools like Python, R, or analytics platforms. Analysts quantify relationships, test assumptions, and build models to explain what might be driving the outcomes.
Step 6: Visualize the data
Visualizations make complex data easier to understand. Using data visualization tools, teams can create interactive dashboards that let them slice and dice data by different dimensions, time, geography, and customer segments. This makes patterns and root causes clearer. For example, heat maps might show where customer complaints are concentrated geographically.
Step 7: Interpret the results
Analysis only delivers value when translated into action. Analysts work closely with business leaders to explain findings in plain language and suggest concrete next steps. This might include adjusting marketing strategies, fixing operational bottlenecks, or launching new customer support initiatives.
1. Finance
Diagnostic analytics plays a crucial role in finance, especially in planning and budgeting. By digging into finance KPIs and historical data, you get a clearer picture of business performance and where resources should be focused.
For example, analyzing past expenses can identify irregularities or budget variances across departments. This insight helps pinpoint where money is leaking and guides actions like adjusting budget allocations or launching cost-saving initiatives.
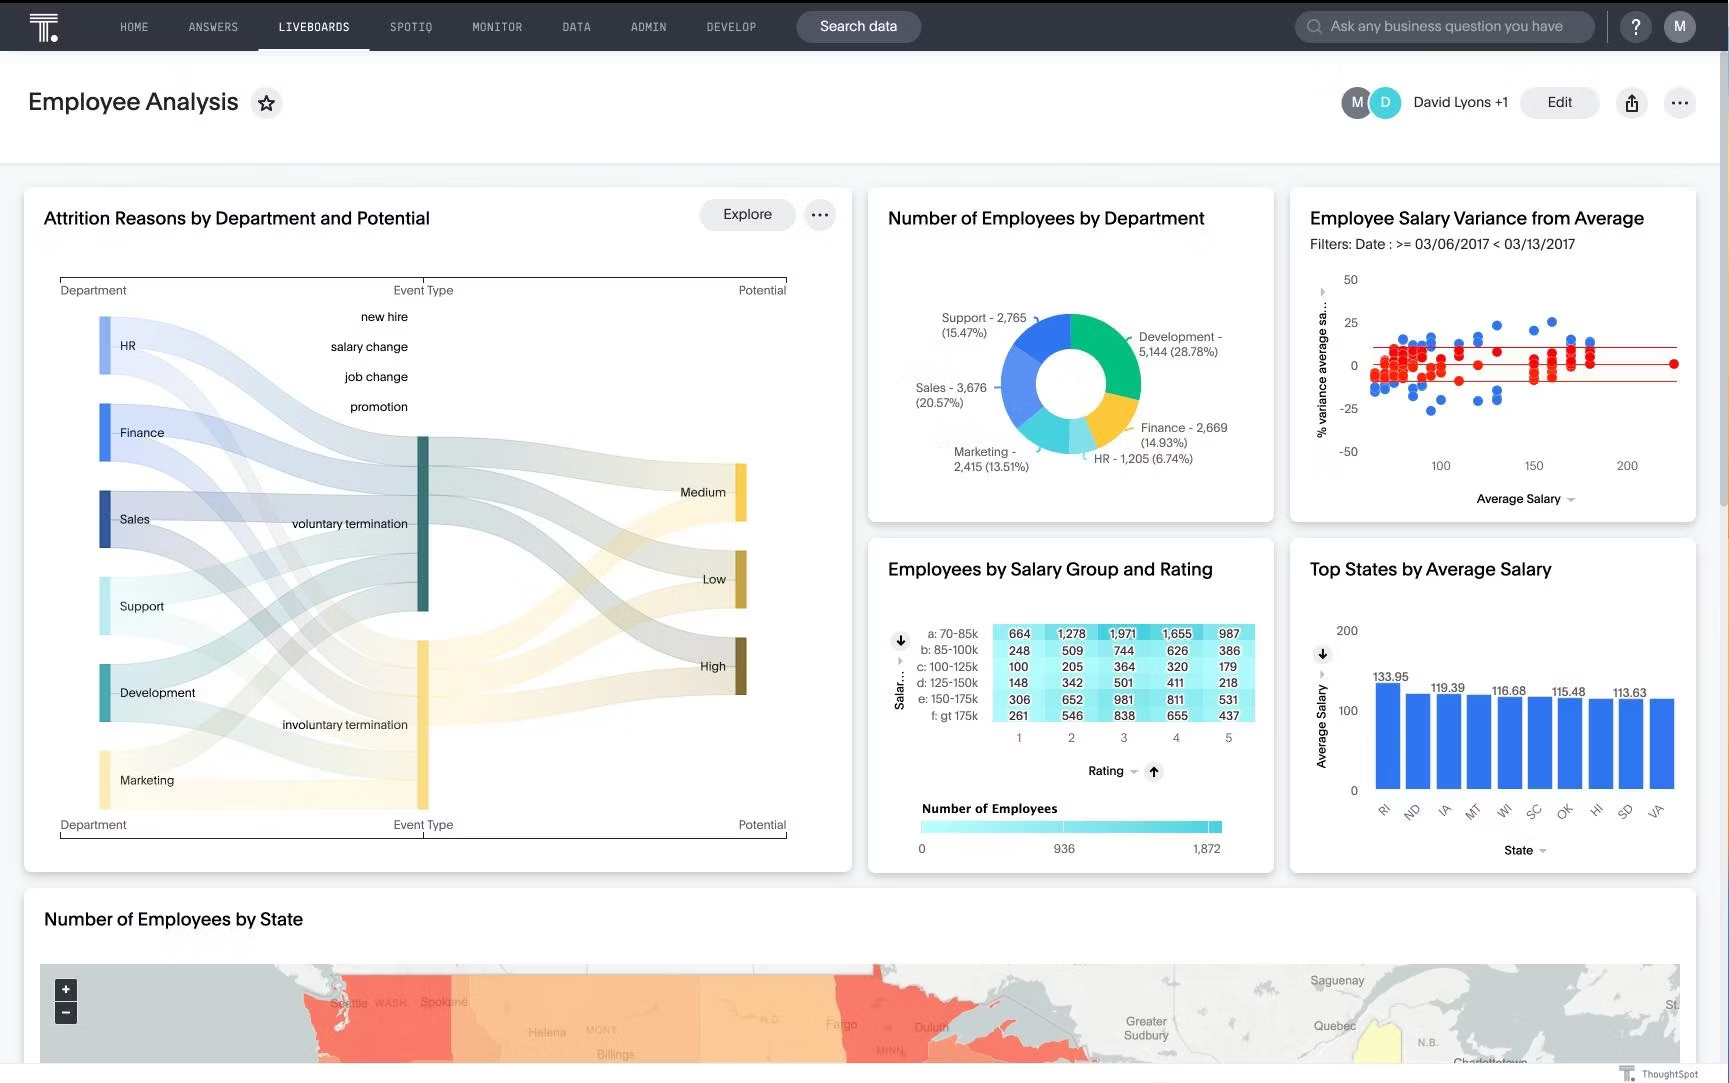
2. Human resources
Gallup research finds nearly 80% of employees worldwide feel unengaged, which often signals issues with motivation, connection, or job satisfaction. Rather than ignoring these red flags, HR leaders can use diagnostic analytics to identify which teams face the highest attrition rates and dig into the causes. These insights help craft targeted strategies to improve employee engagement and build a healthier work culture.
Instead of turning a blind eye to these scenarios, HR leaders can apply diagnostic analytics to understand which department has the highest attrition rate and decipher the reason behind this attrition. Using these insights, you can create strategies to address employee concerns and foster a positive work culture.
3. Digital marketing
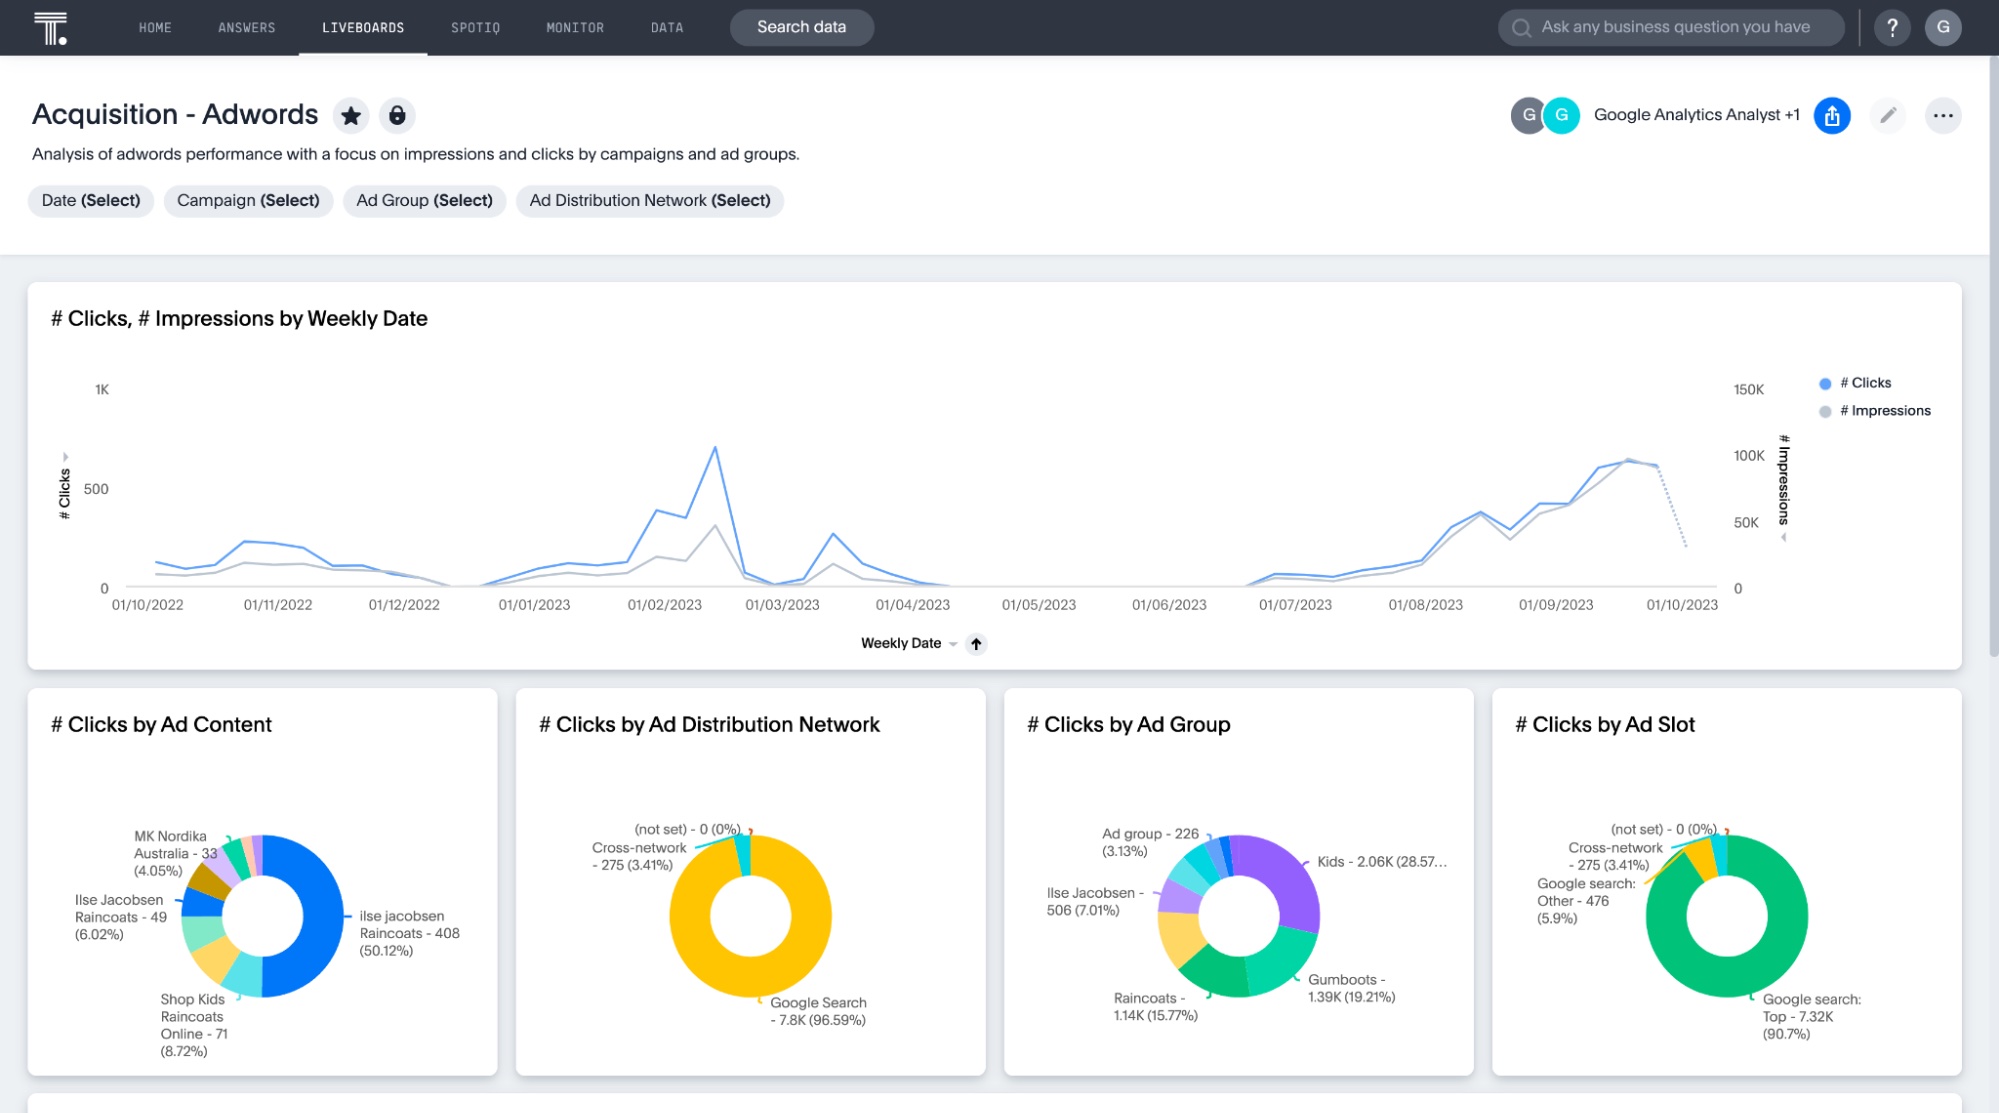
Ever wonder why your ad clicks or impressions are lower than expected? Diagnostic analytics and interactive dashboards let you break down campaign performance by channel, message, or audience segment. This helps identify weak spots, test different approaches, and retarget more effectively, optimizing campaign results without guessing.
4. Marketing and sales
Diagnostic analytics can reveal patterns in customer behavior, such as products frequently bought together. This insight enables targeted cross-selling and personalized recommendations that boost sales.
Canadian Tire, for example, used ThoughtSpot’s analytics to identify cross-sell and upsell opportunities in their pet department. By analyzing the buying behaviors of new pet owners, they suggested relevant products, driving sales up by nearly 20%.
Diagnostic analytics can seriously up your decision-making game, but it’s not always a walk in the park. Here are some bumps you might hit along the way:
Data quality headaches
Data stuck in silos
Mixing up correlation and causation
Missing the bigger picture
Skills gaps
Information overload
Data quality headaches
Bad data leads to bad answers. Think missing records, outdated info, or messy formats. If your data’s a mess, you’ll spend more time cleaning than actually analyzing. For example, a sales report missing key customer info won’t help you figure out why revenue dipped.
Data stuck in silos
When data lives all over the place, in different tools or departments, it’s like trying to solve a puzzle with half the pieces missing. You might spot a trend in your CRM, but if it doesn’t line up with your marketing data, you’re stuck guessing.
Mixing up correlation and causation
Just because two things happen at the same time doesn’t mean one caused the other. Say you notice ice cream sales and shark attacks both rise in summer—does eating ice cream cause shark attacks? No, it’s the weather. Without digging deeper, you could make bad calls.
Missing the bigger picture
Data alone doesn’t tell the whole story. If you don’t consider things like market changes or recent policy updates, you might miss why your numbers shifted. For example, a sudden drop in customer satisfaction might be tied to a new product rollout that customers weren’t ready for.
Skills gaps
Diagnostic analytics needs a mix of data know-how and business smarts. If your team’s light on either, analysis can slow down or miss the mark. That’s why it helps to have people who speak both “data” and “business.”
Information overload
Having tons of data sounds great until you realize it’s hard to focus. Without clear questions or filters, you can get lost in the details and miss the important insights.
Diagnostic analytics is evolving fast, thanks to advances in AI, machine learning, and data integration. Here’s what’s shaping the next wave:
1. Natural language querying gets smarter
Tools like ThoughtSpot’s Spotter are making it easier for anyone, no coding needed, to ask complex “why” questions and get instant answers in everyday language. Expect these interfaces to become more conversational, context-aware, and capable of handling follow-up questions naturally.
2. Real-time diagnostics
Waiting hours or days for analysis is going out of style. Real-time data streaming and instant anomaly detection will let businesses spot issues and root causes as they happen, slashing reaction times and minimizing damage.
3. AI-driven causal inference
Going beyond correlation, future diagnostic analytics will leverage advanced AI to suggest actual cause-and-effect relationships. This will help businesses make decisions based on stronger evidence rather than just patterns.
4. More human-in-the-loop collaboration
Even as AI gets smarter, human expertise will remain vital. Diagnostic tools will evolve to support true human-in-the-loop workflows, letting analysts, domain experts, and decision-makers work together smoothly, validating AI findings, adding context, and ensuring insights are both accurate and actionable.
Agentic AI is reshaping how we interact with data by bridging the gap between questions and actionable answers. With ThoughtSpot’s Spotter, you can surface anomalies, uncover hidden trends, and get trusted answers to complex questions—like sudden sales dips or rising churn—in plain language, no data science degree required. That means faster clarity, smarter decisions, and less reliance on technical teams.
With ThoughtSpot, you don’t just get data; you get context, explanation, and confidence to act.
Discover how ThoughtSpot can sharpen your insights and accelerate your business: Start your free trial today.
FAQs
1. What is the difference between descriptive and diagnostic analytics?
Descriptive analytics summarizes data to tell you what has already happened. For example, sales dropped by 10% last quarter. It’s great for monitoring and reporting, but doesn’t explain the reasons behind changes. Diagnostic analytics goes deeper to uncover the root causes, like a spike in website errors that led to abandoned carts and a sales drop.
2. What is diagnostic data used for?
Diagnostic data is used to identify problems, understand complex relationships between factors, and detect anomalies. These insights allow companies to fix issues quickly, optimize processes, reduce risks, and improve customer experiences.
For example, diagnostic data might reveal a spike in support tickets after a product update, or show that certain marketing channels aren’t converting as expected.
3. How is diagnostic analytics different from predictive analytics?
Diagnostic analytics dives into past data to find the root causes, patterns, or anomalies that explain changes in business performance. For example, it might analyze why sales dropped last quarter or why customer churn increased.
Predictive analytics, on the other hand, uses historical data and statistical models to forecast what’s likely to happen next, like predicting next quarter’s sales or the probability a customer will churn. While diagnostic analytics explains the causes, predictive analytics helps anticipate future outcomes so you can prepare or react proactively.


