


Business intelligence platforms analyze vast amounts of data, requiring visualization engines that balance performance, flexibility, and ease of use. Traditional charting libraries treat each chart type as a distinct entity, requiring separate logic and code for each. This approach leads to code duplication, limited reusability, and reduced maintainability. Additionally, it’s cumbersome to effectively layer or combine visual elements due to these libraries’ rigid composability. This fixed set of predefined chart types restricts expressiveness, making it challenging to explore complex datasets through different lenses or to create custom visualizations.
Charting libraries typically fall along a spectrum ranging from low-level, highly customizable tools like D3.js to high-level, monolithic charting libraries such as Highcharts or Chart.js. Low-level libraries offer granular control and flexibility but require significant development effort. Meanwhile, high-level libraries provide ease of use and rapid development at the expense of customization and flexibility. Innovative businesses like yours are looking for better charting solutions. Today, ThoughtSpot is delivering with our new native visualization engine, Muze.
The Muze team—Ujjal Dutta, Nakshatra Mukhopadhay, Ranajit Baneerji, Rousan Ali, and a few others—set out to address these limitations by adopting a declarative, data-first approach based on a layered Grammar of Graphics (GoG) while weaving into it a Grammar of Interactions. By the end of this year, Muze will be the primary visualization library powering ThoughtSpot’s Agentic Analytics Platform.
Muze occupies a unique position—closer to the flexibility and composability of D3.js, yet offering a higher-level, declarative API that simplifies visualization creation. By leveraging a layered Grammar of Graphics and WebAssembly-powered performance, Muze provides powerful building blocks to create sophisticated, interactive visualizations without the complexity and boilerplate associated with low-level tools. At the same time, Muze avoids the rigidity and limited expressiveness of traditional, high-level libraries, enabling greater customization, scalability, and maintainability.
These unique Muze design principles enable effortless visualization creation through composable layers, allowing seamless integration of multiple visual elements and intuitive data interactions. Its WebAssembly-powered architecture ensures lightning-fast performance, even with large datasets. By enforcing a consistent underlying model of the data, Muze enhances reproducibility, scalability, and maintainability, powering sophisticated, interactive native visualizations in ThoughtSpot. Additionally, Muze empowers developers to create custom visualizations via a Muze Studio, which helps you to create your own charts.
What is Muze capable of?
ThoughtSpot’s new native visualization engine, Muze, is explicitly designed to efficiently build complex, interactive visualizations. The key features:
Complex visualizations can be built using composable layers, allowing for flexible and intricate designs
Efficient data transformation, visualization, and interaction are enabled through rich data operators
Custom interactions can be defined using a physical interaction model, providing nuanced control over user engagement
The look and feel of charts can be customized using style sheets, offering extensive CSS styling options
All interactions are managed through centralized data control, ensuring a single source of truth
Seamless integration with applications or custom UI components is facilitated by the ability to dispatch actions easily
Large datasets are handled efficiently through WebAssembly-powered performance.
Let's see Muze in action
Apart from the general chart types, Muze is capable of building complex charts through:
Faceting
Grouping Axis for Shared Axis Configuration
Extensive sorting support
Ready-to-use cross-interactivity
Muze design principles and architecture
Declarative API
Muze follows a declarative approach, allowing developers to specify what they want rather than how to achieve it. This simplifies code maintenance, enhances readability, and promotes reusability.
Data-First Approach
Unlike conventional libraries that treat visual elements as primary, Muze structures its architecture around data transformations and interactions, ensuring seamless scalability and flexibility. This data-first approach allows developers to focus on meaningful visualizations without worrying about the underlying complexities.
Layered Grammar of Graphics
Muze employs a Grammar of Graphics model to create composable visualizations. Charts are built using layers, where each layer represents a different aspect of the visualization (e.g. axes, gridlines, data points). This approach provides flexibility and control over complex visual representations and enables developers to mix and match various chart components.
High-Level Architecture
At its core, Muze consists of these primary components:
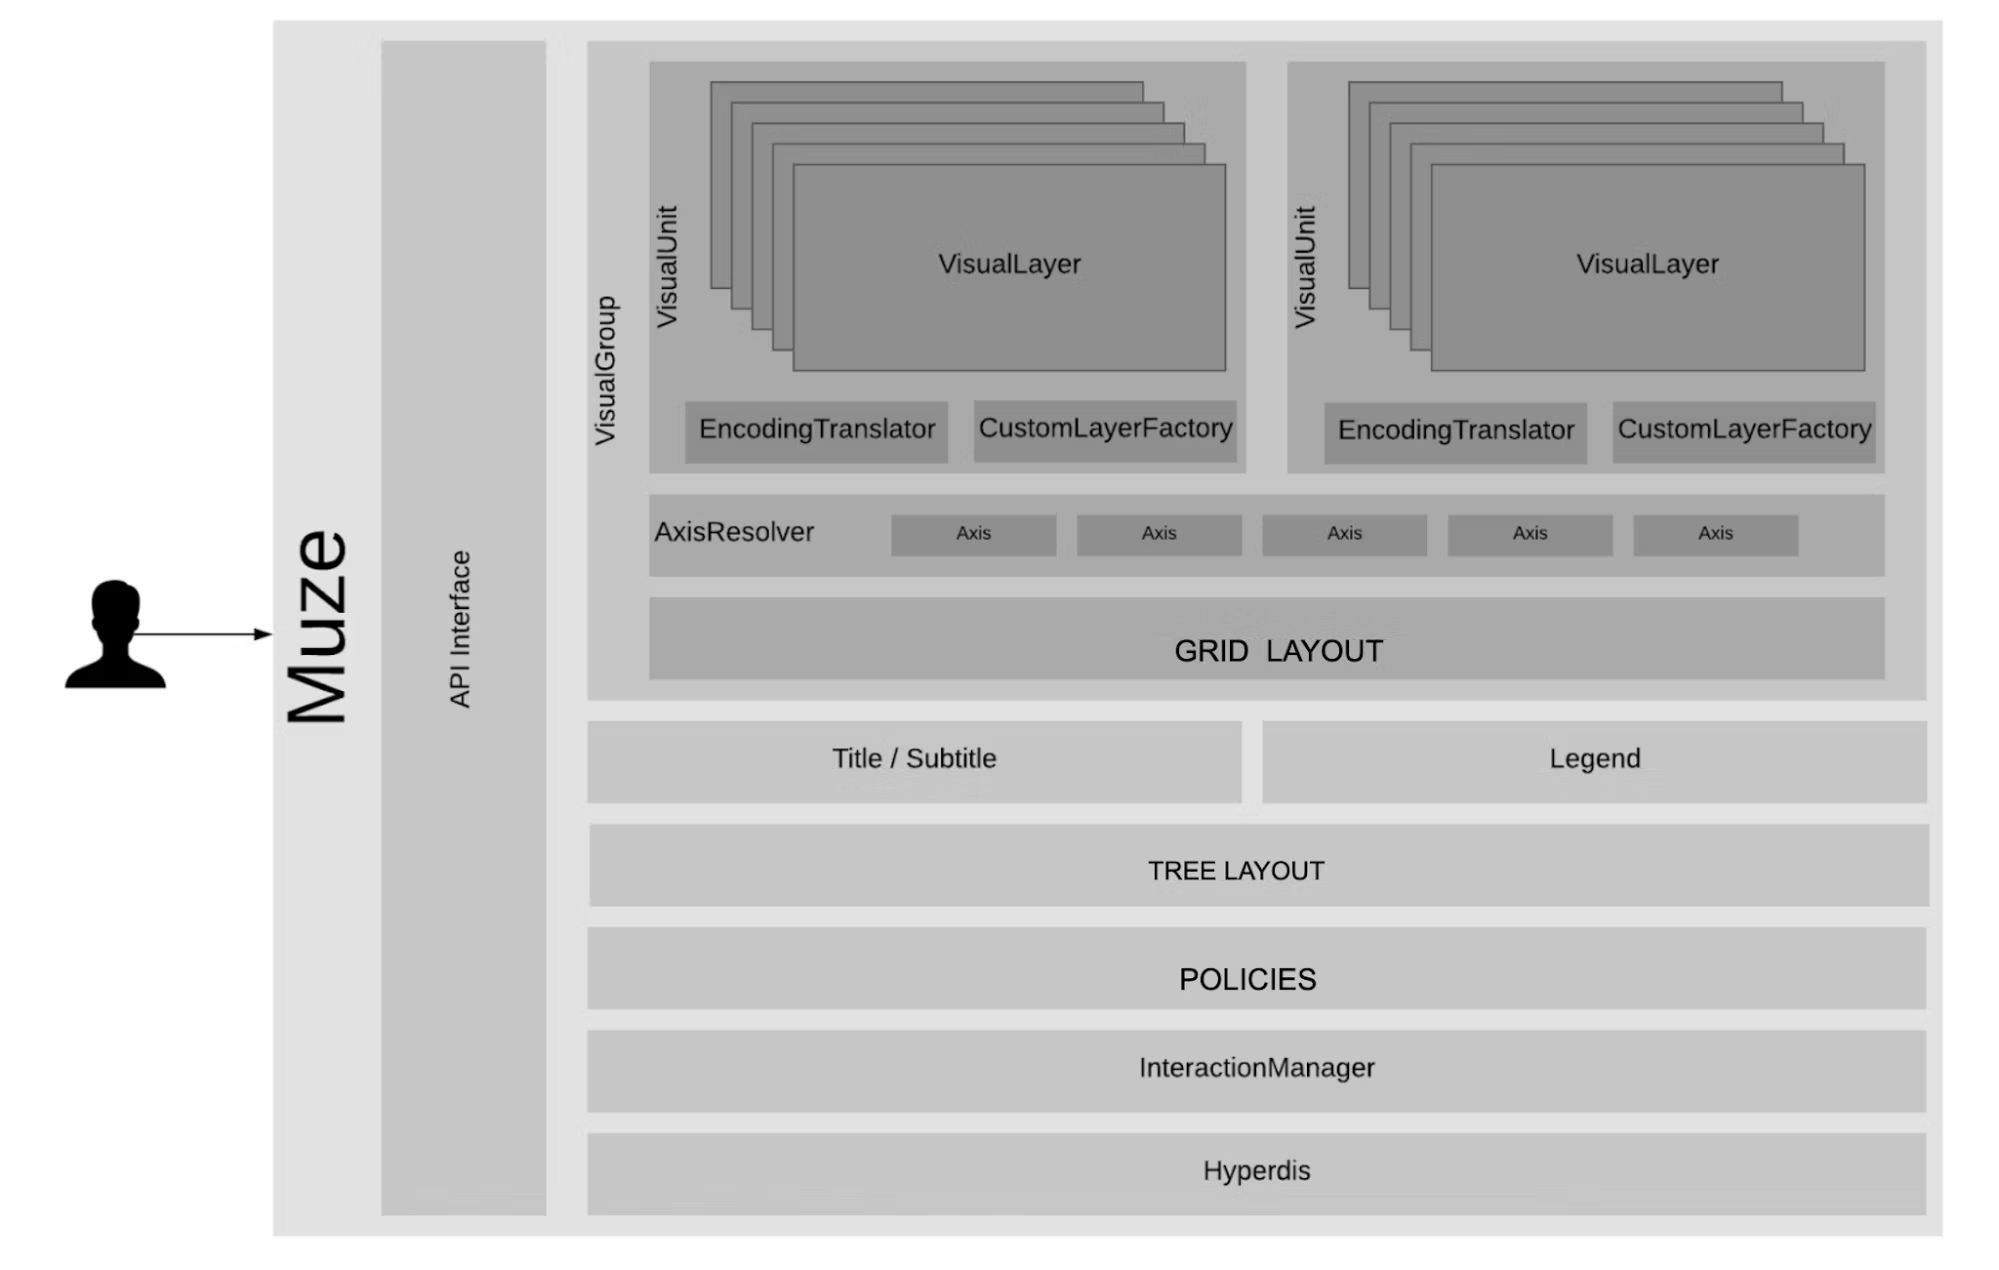
VisualLayers are typically data, marks (bars, lines, points), encodings (position, color, size)
VisualUnits aggregate layers that manage interactions and lifecycle
VisualGroups combine units and axes, enforce encoding policies, faceting, and layouts
Other additional components include titles, subtitles, legends, and tooltips
Immutable Data Engine
Muze uses DataModel, a WebAssembly-powered, immutable data engine designed for high-performance, in-browser data processing. It supports relational operations essential to visualizations such as filtering, aggregation, and deriving new columns, enabling efficient data transformations.
Additionally, the DataModel leverages its immutability by adding any derived DataModels to a directed acyclic graph (DAG), which powers reactive data propagation across visualizations created from these derived DataModels. This ensures that visualizations automatically stay synchronized with underlying data changes and can communicate with each other, thus enabling cross-visualization interactivity.
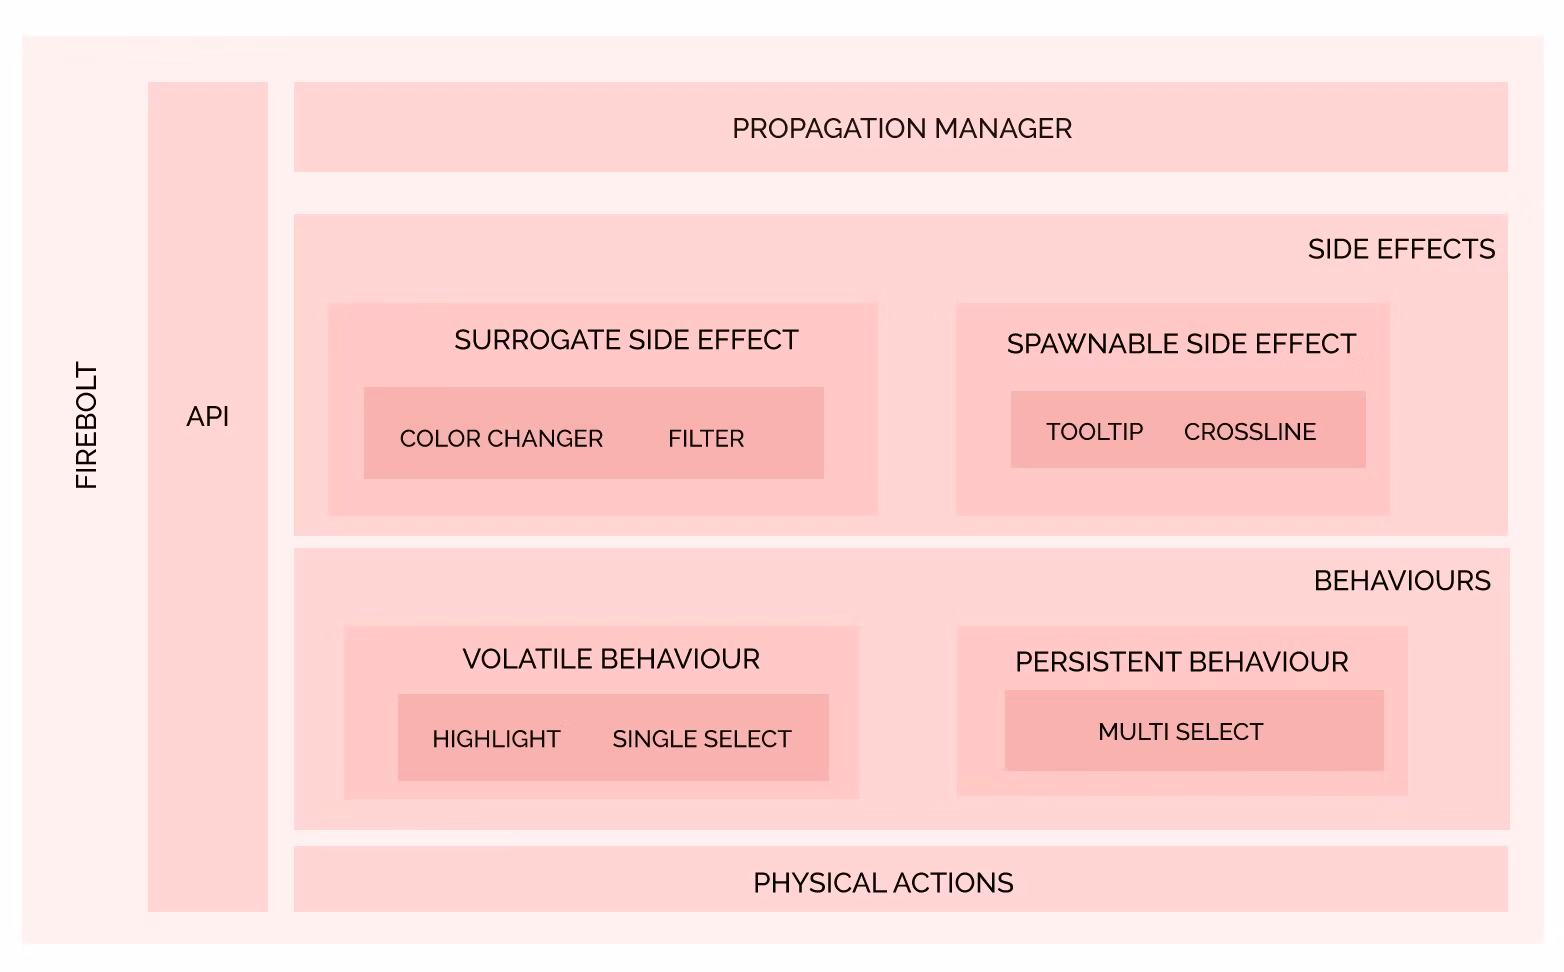
Interaction Model
Muze’s interactivity layer, ActionModel, captures and interprets user interactions through a structured three-part model. The physical model records user actions such as clicks, hovers, and drags, while the Behavioral Model translates these actions into meaningful visualization behaviors. Finally, the Side Effect Model defines visual responses and cross-chart interactions, leveraging the DataModel's DAG and Hyperdis' reactive data propagation to ensure seamless, automatic updates across visualizations.
Performance and optimization
Optimized Rendering Engine
Muze's Rendering Engine leverages Hyperdis, a reactive store that efficiently manages state updates and namespaces for individual chart components, ensuring optimal rendering performance.
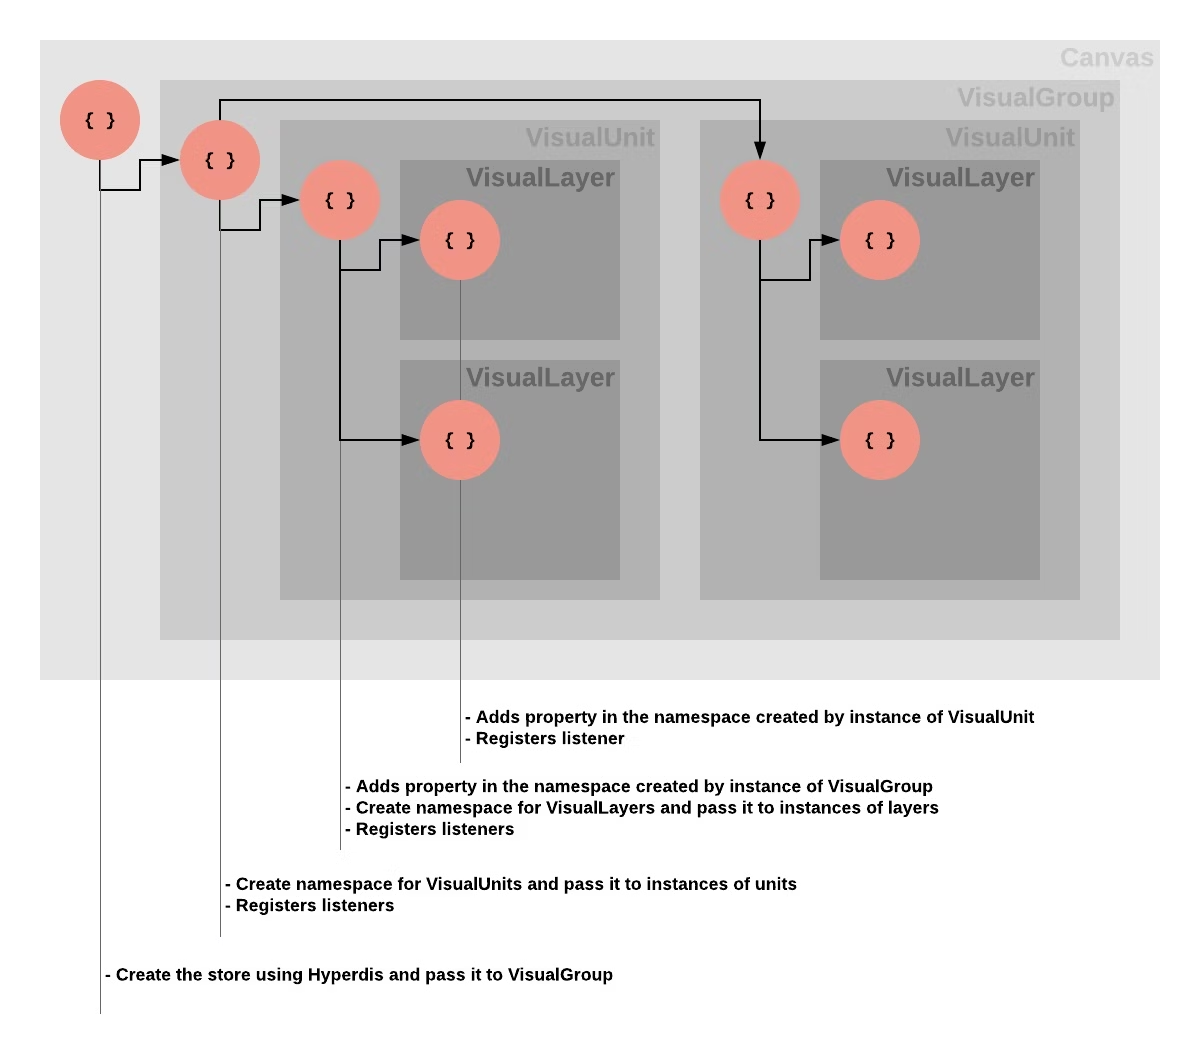
By intelligently scheduling renders between state updates, the Rendering Engine ensures smooth, responsive visual experiences even with complex, multi-layered charts.
Fast, In-Memory Data Processing
DataModel is a minimalistic, in-browser data store, a powerful tabular data representation designed for performance and flexibility. It provides a consistent data format with powerful transformation capabilities inspired by SQL's data manipulation philosophy. While DataModel is optimized for use with Muze, it can be used independently as an in-browser tabular data store for analysis, visualization, or general data management needs.
DataModel leverages WebAssembly to efficiently handle large datasets, providing consistently fast data operations even as data size grows. By compiling performance-critical data transformations to WebAssembly, Muze achieves significant performance improvements—benchmarks indicate up to 30x faster operations compared to equivalent JavaScript implementations. This ensures minimal performance degradation, enabling smooth, responsive visualizations even with millions of data points.
Relational Operations
Row filtering
Column selection
Data grouping and aggregation
Column creation from calculations
Multi-column sorting
Immutable Architecture
Each operation creates a new DataModel instance, ensuring the original data remains unchanged.
Operations form a Directed Acyclic Graph (DAG), allowing efficient tracking of data transformations.
Any node in the graph, which is a DataModel instance, can be visualized with Muze, providing flexibility in exploring intermediate data states.
Data-first Interaction Model
Changes automatically flow through the operation DAG, ensuring visualizations stay updated.
Events propagate from parent to derived DataModels, maintaining data consistency.
Efficient Rendering
Muze employs several advanced rendering algorithms and optimizations to ensure smooth, performant visualizations even with large datasets.
Through virtual scrolling, Muze efficiently renders large pivot tables or highly faceted charts by only drawing visible portions, significantly reducing DOM overhead.
To improve initial render performance, Muze employs deferred event listener attachment and event delegation, attaching listeners after initial rendering and minimizing memory usage.
For managing large datasets, Muze provides pagination support, breaking tables or visualizations into manageable pages to prevent DOM bloat and maintain responsiveness.
Ensuring smooth user interactions, Muze uses an asynchronous render pipeline, scheduling rendering tasks asynchronously to allow synchronous or high-priority code to execute first.
To optimize perceived performance, Muze prioritizes rendering of critical visual elements first, deferring less critical text labels to subsequent frames.
Muze achieves efficient data transfer between WebAssembly and JavaScript through zero-copy data transfer, significantly reducing memory overhead and improving performance.
For rapid data transformations, Muze utilizes Rust compiled to WebAssembly for high-performance relational algebra operations directly in-browser.
To accelerate data loading times, Muze leverages Web Workers for parallel data ingestion, ingesting multiple datasets concurrently and minimizing main-thread blocking.
Looking forward
Muze will continue to evolve with planned enhancements. For example, we’re looking forward to sharing our AI-assisted Muze Studio. This experience will help users generate complex visualizations via natural language interactions with Muze's unique structured and declarative interfaces. With feature enhancements and innovations like these, you can unleash new levels of creativity into visualizations and data storytelling. Stay tuned for future announcements in this space!
Additionally, the Muze framework will evolve to add further WebGPU rendering power, empowering you to visualize larger datasets with improved accessibility, expanded interaction models, and broader native support for advanced visualizations and animations.
To learn more about Muze, visit our detailed documentation page here.
Elevate your analytics experience today
At ThoughtSpot, we’re dedicated to continuously improving the data experience, helping your business achieve faster time to insights and improved outcomes for everyone.
New to ThoughtSpot? Request a demo today.


