


We rely on data to cut through the noise, spot patterns, and make smarter calls. But if that data is a mess? You’re basically building your insights on sand. Duplicate entries, inconsistent formats, missing values, wrong information—it all adds up and leads to decisions people don’t trust (or just ignore).
As the saying goes: garbage in, garbage out.
And if your teams don’t trust the data? They’re not going to use your BI tools, no matter how self-serve or AI-powered they are.
That’s why data cleaning matters. It’s not just a box to check; it’s foundational to getting real value from your modern data stack.
Table of contents:
- What is data cleaning?
- Common data quality issues and how to fix them
- Benefits of data cleaning
- How to clean data?
- Step 1: Identify data discrepancies using data observability tools
- Step 2: Remove data discrepancies
- Step 3: Standardize data formats
- Step 4: Consolidate data sets
- Step 5: Check data integrity
- Step 6: Store data securely
- Step 7: Expose data to business experts
- Best practices for data cleaning at scale
- Make your data cleaning tool the backbone of smarter decisions
Data cleaning is the process of turning raw, messy data into organized, decision-ready data. That means fixing errors, filling gaps, removing duplicates, and aligning formats, so your business intelligence efforts aren’t slowed down by second-guessing every dashboard.
What can you expect from clean data?
Speed up analysis across teams
Reduce rework and reporting errors
Build trust in your data strategy
It’s the foundation that keeps your analytics from falling apart under pressure.
But data cleaning doesn’t exist in a vacuum, it’s just one part of the larger data preparation process. To really understand its role, it helps to see how it compares to two other common terms: data transformation and data wrangling.
Data cleaning vs. data transformation vs. data wrangling
These terms often get used interchangeably, but each one focuses on a different part of getting data ready for use. Understanding the differences helps you choose the right tools and techniques and communicate more clearly with your team.
Term What it means When it happens Data cleaning Fixing errors, filling in gaps, and standardizing formats Early in the pipeline, before data is modeled or analyzed Data transformation Converting data into a usable format or schema During pipeline processing Data wrangling Reorganizing or reshaping raw data for a specific use Right before analysis or visualization
In cloud-native environments, these workflows increasingly blend together as part of automated data pipelines.
As modern data stacks become more complex, data quality issues become harder to spot and more painful when they surface. With data pouring in from dozens of tools and owners scattered across teams, problems are often introduced without anyone noticing.
The root of the problem?
Rapid ingestion, third-party integrations, and decentralized ownership.
All of these introduce inconsistencies that don’t always show up until someone’s trying to use the data, whether that’s in a dashboard, an AI-generated insight, or a simple search.
Here are some of the most common issues, how they happen, and why they matter:
1. Missing or incomplete data
Blank or half-filled fields are one of the most common problems and one of the easiest to miss. Maybe your CRM didn’t require a phone number, or maybe a bulk import skipped over product descriptions. Either way, missing data leads to blind spots in analysis, faulty segments, and broken filters.
Fix: Enforce stricter validation rules at the source, and flag key fields that should never be empty.
2. Duplicate records
It’s shockingly easy to end up with the same customer, order, or product entered multiple times. One might have come from an API, another from a manual upload, and a third from a marketing sync. Left unchecked, these duplicates inflate metrics and can break joins in your warehouse.
Fix: Use unique identifiers wherever possible, and automate deduplication during your data pipeline.
3. Inconsistent formats and categories
One tool logs “United States,” another says “US,” and someone else enters “usa.” Or one team logs dates as DD/MM/YYYY while another uses MM-DD-YY. These formatting mismatches silently break dashboards and make filtering or aggregating data unreliable.
Fix: Standardize formats during ingestion, and apply mapping logic to normalize key fields like dates, locations, and categories.
4. Outliers and anomalies
Outliers aren’t always bad, but when they’re caused by data entry errors or sync glitches, they can warp trends, skew averages, and throw off automated models. A single extra zero in a transaction amount might turn into a million-dollar “sale.”
Fix: Flag and review extreme values before they enter analysis layers, especially for fields used in KPIs or sales forecasting.
Data isn’t just a byproduct of business anymore; it is the business. From real-time personalization to AI-generated forecasts, modern companies are putting data at the center of every decision, product, and workflow.
But the more your business depends on data, the more it suffers when that data is off. A few inconsistencies might’ve flown under the radar back when reports were quarterly and static. Today, they break dashboards, mislead models, and chip away at trust.
Data cleaning matters because it keeps your foundation solid even as the speed, volume, and impact of data use keep accelerating.
1. Trusted data builds user confidence
If the numbers don’t add up, neither will your strategy. When business users run into errors or inconsistencies, they start relying on gut instinct instead of dashboards. Clean data helps rebuild that trust, so users can stop second-guessing and start acting.
2. Faster, more accurate decision-making
When the data works, people move faster. No one wants to waste time debugging a report or figuring out why filters aren’t working. Clean data clears the path, so teams can move from question to answer to action without the usual back-and-forth or delay.
3. Enabling self-service analytics at scale
You can’t explore data confidently if the filters don’t work or the numbers don’t match up. When your data is clean, self-service analytics tools become faster and easier to use. You get answers you can trust, without chasing down your analyst.
4. Powering AI and automation
AI is only as smart as the data it trains on. Clean, consistent data leads to better predictions, more relevant personalization, and fewer false positives. Whether you’re training models or triggering workflows, unreliable inputs produce unreliable outputs.
Data cleaning isn’t a one-and-done task. As new data keeps flowing in, errors and inconsistencies creep back in, too. That’s why most cleaning workflows follow a repeatable set of steps that can be automated, scaled, and built into your broader data pipeline.
Before you fix anything, you need to know what’s broken. This step involves profiling your datasets to flag missing values, outliers, duplicate rows, inconsistent categories, or anything else that looks off. Tools may help surface these issues automatically, but human judgment still plays a role, especially when deciding what’s actually an error versus what’s just unusual.
Redundant entries inflate metrics and clog analysis. Use logic-based matching, like identical email addresses or near-identical names, to merge or remove duplicates. It’s also a good time to get rid of stale, irrelevant, or out-of-scope records that don’t serve the use case.
Is it “United States” or “USA”? “Q1 2025” or “Jan–Mar”? This step is about making data consistent across sources. That includes standardizing date formats, units of measurement, and categorical values so your data is filterable, joinable, and easy to analyze. Without this consistency, dashboards break and filters mislead.
Gaps in data can stop analysis cold or worse, skew your outputs. Depending on context, you might use techniques like forward fill, interpolation, or averages to fill in blanks. In other cases, it might be better to leave the gaps, exclude the rows, or escalate the issue.
Once cleaned, datasets often need to be stitched together. That might mean breaking down silos, mapping columns between sources, or loading into a centralized store like a data warehouse or data lakehouse. This step helps reduce redundancy and makes downstream analysis more efficient.
💡Data lake vs data warehouse: 7 Key differences you should know
Run a quick sanity check. Do totals add up? Do categories follow business rules? Catching errors at this stage prevents confusion in data visualization and reporting down the line. Validation might also involve comparing results to source-of-truth systems, spot-checking key records, or confirming that the cleaned data aligns with your data model and business logic.
The best data cleaning doesn’t happen in a black box. Make sure your transformations, assumptions, and fixes are logged, whether it’s through version-controlled scripts, comments, or metadata. This gives other teams visibility and helps your organization maintain trust in how data is handled.
It’s one thing to clean a few messy spreadsheets. It’s another to clean millions of rows flowing through dozens of tools, owned by different teams, all changing constantly. Scaling data cleaning is hard—pipelines sprawl, workflows get tangled, and no one’s quite sure who owns what.
Solving this takes more than just better tooling; it requires a clear strategy, smart automation, and tight alignment between technical teams, analytics engineers, and business stakeholders. Here’s how to stay ahead:
1. Make governance the foundation of your cleaning efforts
You can’t fix what you haven’t defined. Start by setting clear, shared standards for what “good” data looks like, from acceptable formats and field requirements to how categories should be labeled. Then tie those standards back to your data governance policies, so cleaning becomes part of the system, not just a last-minute fix when something breaks.
2. Automate the repeatable, and flag the rest
Scaling data cleaning means taking the manual work off your team’s plate. Build logic into your pipelines for common issues like missing values or inconsistent formatting, but don’t assume automation catches everything. Set thresholds, flags, and review steps for edge cases that need a human look. It’s not about replacing judgment, it’s about saving time for where it matters most.
3. Involve business users in the feedback loop
Data analysts and domain experts are often the first to spot bad data, but too often, they’re left out of the fix. Give business users a way to flag issues, suggest improvements, and stay in the loop when rules change. Cleaning becomes a lot easier (and more effective) when the people using the data are part of the process.
4. Treat data quality as a moving target
Data isn’t static, and your cleaning strategy shouldn’t be either. As sources update, new fields appear, or systems evolve, old assumptions can break. Keep tabs on changes with regular checks for drift, missing values, and weird outliers. Continuous monitoring isn’t overhead – it’s insurance.
Clean data is only half the equation. To get real ROI from your data cleaning efforts, your teams need a way to use that data confidently, quickly, and at scale.
That’s where ThoughtSpot comes in. As the Agentic Analytics Platform, ThoughtSpot makes clean data far more valuable by putting it to work through intuitive search, AI-driven agents, and live, AI-augmented dashboards.
Here’s how:
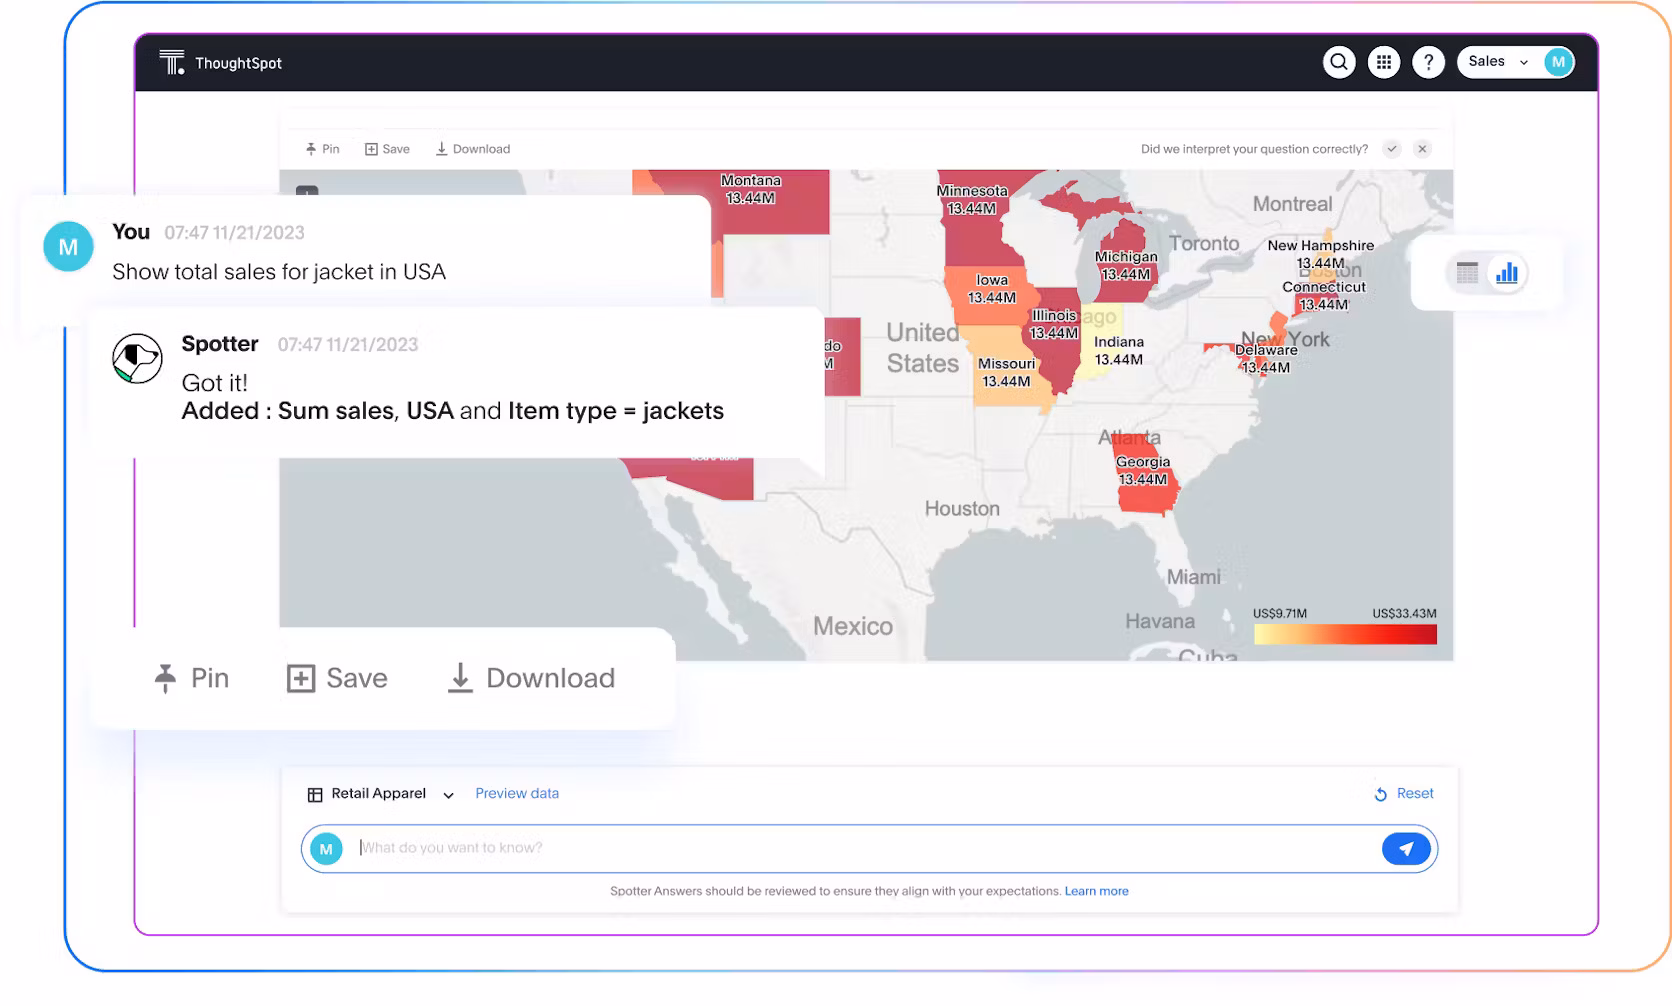
Search-based analytics
Let anyone explore trusted data using natural language. Whether you’re asking “Which campaigns drove the most revenue last quarter?” or “Where are sales dropping?”, ThoughtSpot’s search experience makes it easy to go from question to answer. If your data is clean, the answers aren’t buried in dashboards; they’re a quick search away.
Live queries on cloud data
ThoughtSpot connects directly to your cloud platforms like Snowflake, BigQuery, Databricks, and more, so you’re always working with real-time data that’s fresh, governed, and trusted. Your analytics stay in sync with your systems—no delays, no data extracts, and no outdated insights.
Spotter, your AI analyst
Spotter helps business users go beyond the “what” and get to the “why.” Whether it’s identifying a sudden drop in revenue, spotting outliers in customer behavior, or finding correlations in performance, Spotter scans your clean data for meaningful patterns and explains them in plain language. It’s just like having an analyst on call.
ViewSQL + TML
Clean data only stays clean if everyone speaks the same data language. With ViewSQL and TML (ThoughtSpot Modeling Language), your team can define and reuse business logic, like “net revenue” or “active user,” across every dashboard and search. That means fewer mismatches, less duplication, and more consistent, trusted answers at scale.
When your data is ready and your tools make it usable, your teams can finally stop wrestling with spreadsheets and start moving with confidence.
Book a demo to see it in action.
FAQs
1. What’s the difference between data cleaning and data transformation?
Data cleaning is about fixing problems like removing duplicates, filling gaps, and standardizing formats before analysis begins. Data transformation, on the other hand, is about converting data into a different structure or format, often as part of prepping it for a specific use or system.
2. What makes manually cleaning data so challenging?
Manually cleaning data is tough because it doesn’t scale and takes up a lot of time. You're often dealing with thousands (or millions) of rows, inconsistent formats, missing values, and duplicates that usually spread across different tools or teams.
It also requires deep context to know what’s actually an error versus what’s valid. Without that, it’s easy to introduce new mistakes while trying to fix old ones. And because manual work often happens in spreadsheets or untracked scripts, there’s usually no audit trail, making it hard to explain or repeat the process later.
3. What’s the difference between data cleaning and data cleansing?
In practice, there’s no real difference—data cleaning and data cleansing are used interchangeably. Both refer to the process of fixing or removing incorrect, incomplete, duplicate, or inconsistent data to make it analysis-ready. Some teams prefer one term over the other, but they mean the same thing: getting your data into a state you can trust.


