


When you sit down with a business dashboard, what’s the first thing you want to know?
What happened?
Are sales up or down? How did the customer engagement trend last month? Which regions outperformed the forecast?
This is where descriptive analytics comes in. It’s the backbone of business reporting—summarizing what has already happened so teams can monitor performance, spot patterns, and inform next steps. Without it, you’re flying blind.
In this guide, we’ll break down what descriptive analytics is, how it fits into the broader analytics stack, techniques you can use, and how leading companies apply it today.
Table of contents:
Descriptive analytics is the practice of analyzing historical data to summarize what happened in your business. It focuses on aggregating, organizing, and presenting past performance data in ways that make trends and patterns easier to see.
You might not realize it, but descriptive analytics is all around you: monthly sales reports, marketing campaign dashboards, employee attrition charts, and quarterly financial statements, all are powered by descriptive analytics.
The goal isn’t to predict the future or diagnose problems (that’s where predictive and diagnostic analytics come in). Descriptive analytics is about giving you a clear snapshot of what’s already occurred so you can monitor business health and inform decisions.
Descriptive analytics is the bedrock of data-driven decision-making. It’s the first layer in what’s often called the analytics maturity curve, and every other type of analytics builds on it.
If you don’t understand what happened, it’s impossible to figure out why it happened, what’s likely to happen next, or what you should do about it.
Here’s how the four main types of analytics stack up:
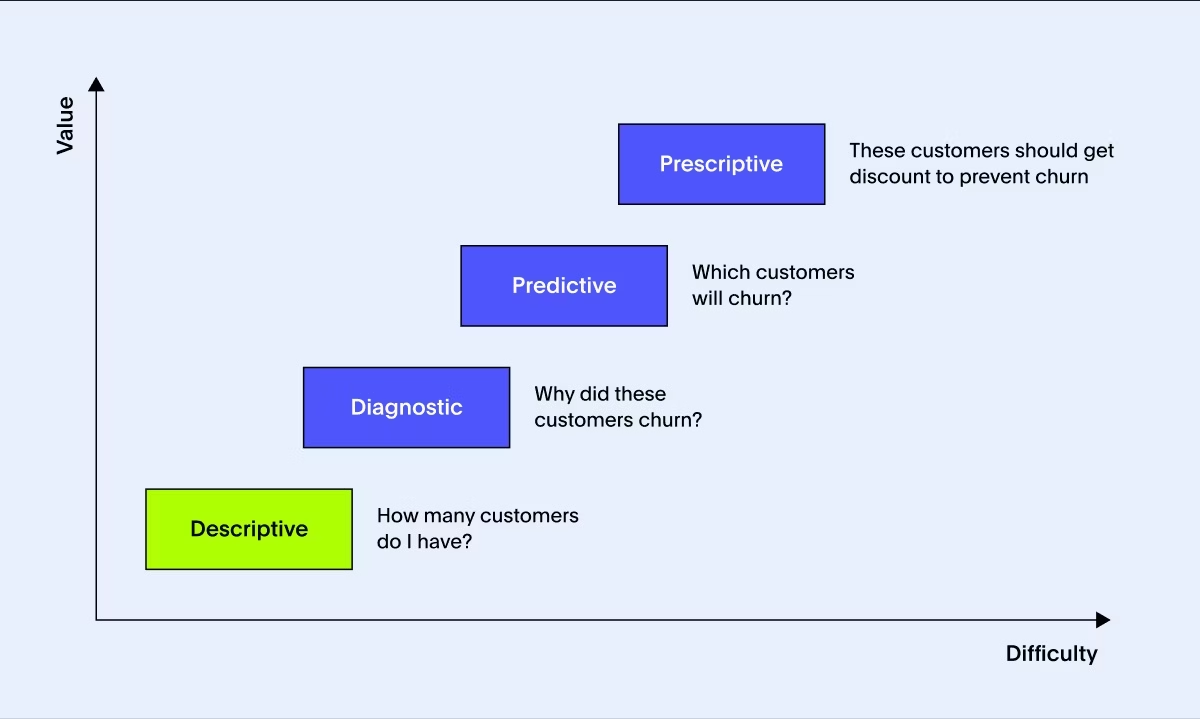
Descriptive analytics: What happened?
Example: How many customers do I have?
Provides a snapshot of past performance so you can monitor business health.
Diagnostic analytics: Why did it happen?
Example: Why did these customers churn?
Digs into the underlying reasons and patterns behind the numbers.
Predictive analytics: What is likely to happen next?
Example: Which customers will churn?
Uses historical data to anticipate future behavior.
Prescriptive analytics: What should we do about it?
Example: These customers should get a discount to prevent churn.
Recommends actions based on data to drive better outcomes.
Descriptive analytics might be the most foundational layer of analytics, but when you do it well, it can drive a big impact across your business. Here’s how it helps:
Clear business visibility
Smarter decision-making
Early detection of issues
Better communication and alignment
Foundation for deeper analysis
1. Clear business visibility
You can’t manage what you can’t see. Descriptive analytics gives you a reliable view of what’s happening across your business, without relying on instinct or guesswork. Whether it’s sales trends, churn patterns, or product performance, you’ll always know where things stand.
2. Smarter decision-making
When you understand what’s changed and where, you can base decisions on facts, not assumptions. Descriptive analytics helps you move from reactive to proactive, spotting emerging opportunities or risks early.
3. Early detection of issues
Trend analysis and continuous monitoring help you catch problems before they escalate. For example, a sudden dip in customer engagement or a spike in support tickets can trigger action before it impacts revenue.
4. Better communication and alignment
Dashboards and visualizations make insights accessible across your teams. When everyone is looking at the same version of the truth, it’s easier to align on priorities and drive coordinated action.
With ThoughtSpot, you can share Liveboards across your organization, so decision-makers stay connected to the metrics that matter most.
5. Foundation for deeper analysis
You can’t skip straight to predictive or prescriptive analytics without understanding what’s already happened. Descriptive analytics lays the groundwork, helping you prioritize where to dig deeper and build more advanced models.
Having data isn’t enough, you need a structured process to turn it into insights that teams can actually use. A good descriptive analytics workflow helps you move from raw information to clear reporting that drives decisions.
It starts with asking the right questions and ends with creating shareable, interactive views of your results. Here’s how the process typically works:
Step 1: Define your key questions
Step 2: Collect relevant data
Step 3: Clean and prepare your data
Step 4: Aggregate and analyze
Step 5: Visualize and share results
Step 6: Monitor and iterate
Step 1: Define your key questions
Every effective analytics process starts with asking the right questions. Descriptive analytics works best when your questions are specific and tied to business priorities.
Instead of a vague “How are we doing?”, a sharper question would be “How did revenue change last quarter?” or “Which marketing channels are driving the most leads this month?” or “How is employee retention trending in our engineering teams?” Clear questions help focus the analysis and make your findings more actionable.
Step 2: Collect relevant data
Once you know what you want to answer, you need to gather the right data. Descriptive analytics typically pulls from multiple systems—your CRM, financial systems, web analytics tools, HR platforms, and more. The goal is to create a comprehensive, trustworthy data set. The more fragmented or inconsistent your data, the less confidence you’ll have in the results.
Platforms like ThoughtSpot make this easier by connecting directly to modern cloud data warehouses, so you can analyze fresh, live data instead of static exports.
Step 3: Clean and prepare your data
Raw data is rarely analysis-ready. Before running any summaries or building dashboards, you need to clean and prepare it. This includes standardizing data formats, removing duplicate records, filling in missing values, and checking for errors.
Clean data helps ensure the accuracy of your insights. With ThoughtSpot, you can also apply filters and logic directly in the dashboard experience, making it easier to keep data clean and consistent without requiring extensive ETL or data engineering effort.
Step 4: Aggregate and analyze
Once your data is prepped, you move into the analysis phase. This is where descriptive techniques come in; aggregation, grouping, segmentation, and trend analysis help you turn raw data into useful summaries. You might calculate totals, averages, maximums, or growth rates, and break them down by time period, region, product, or customer segment.
Step 5: Visualize and share results
Data only drives action when it’s easy to understand. Visualization plays a critical role here. Interactive dashboards and clear charts help decision-makers spot trends, compare metrics, and understand performance at a glance.
Step 6: Monitor and iterate
Descriptive analytics isn’t a one-time effort. The best-performing companies treat it as an ongoing process. Once you’ve built your key dashboards and reports, set them up to refresh automatically. Make a habit of reviewing them regularly in leadership meetings or team stand-ups. This continuous monitoring helps you catch new trends early and course-correct quickly.
Here are a few examples of how descriptive analytics can help businesses maximize the potential of their data:
1. Finance
A business’s success relies on its ability to mitigate risks and capitalize on opportunities. By dissecting complex financial data with descriptive analytics, you gain a profound understanding of your organization's current financial state. The insights from past financial trends can help you identify risks early on and take preemptive measures to improve processes, ultimately improving the company’s bottom line.
For example, take a look at this finance dashboard. Finance teams leverage descriptive analytics to analyze their company's short-term assets and liabilities. These insights help the team create effective strategies to maintain optimal liquidity while maximizing profitability.
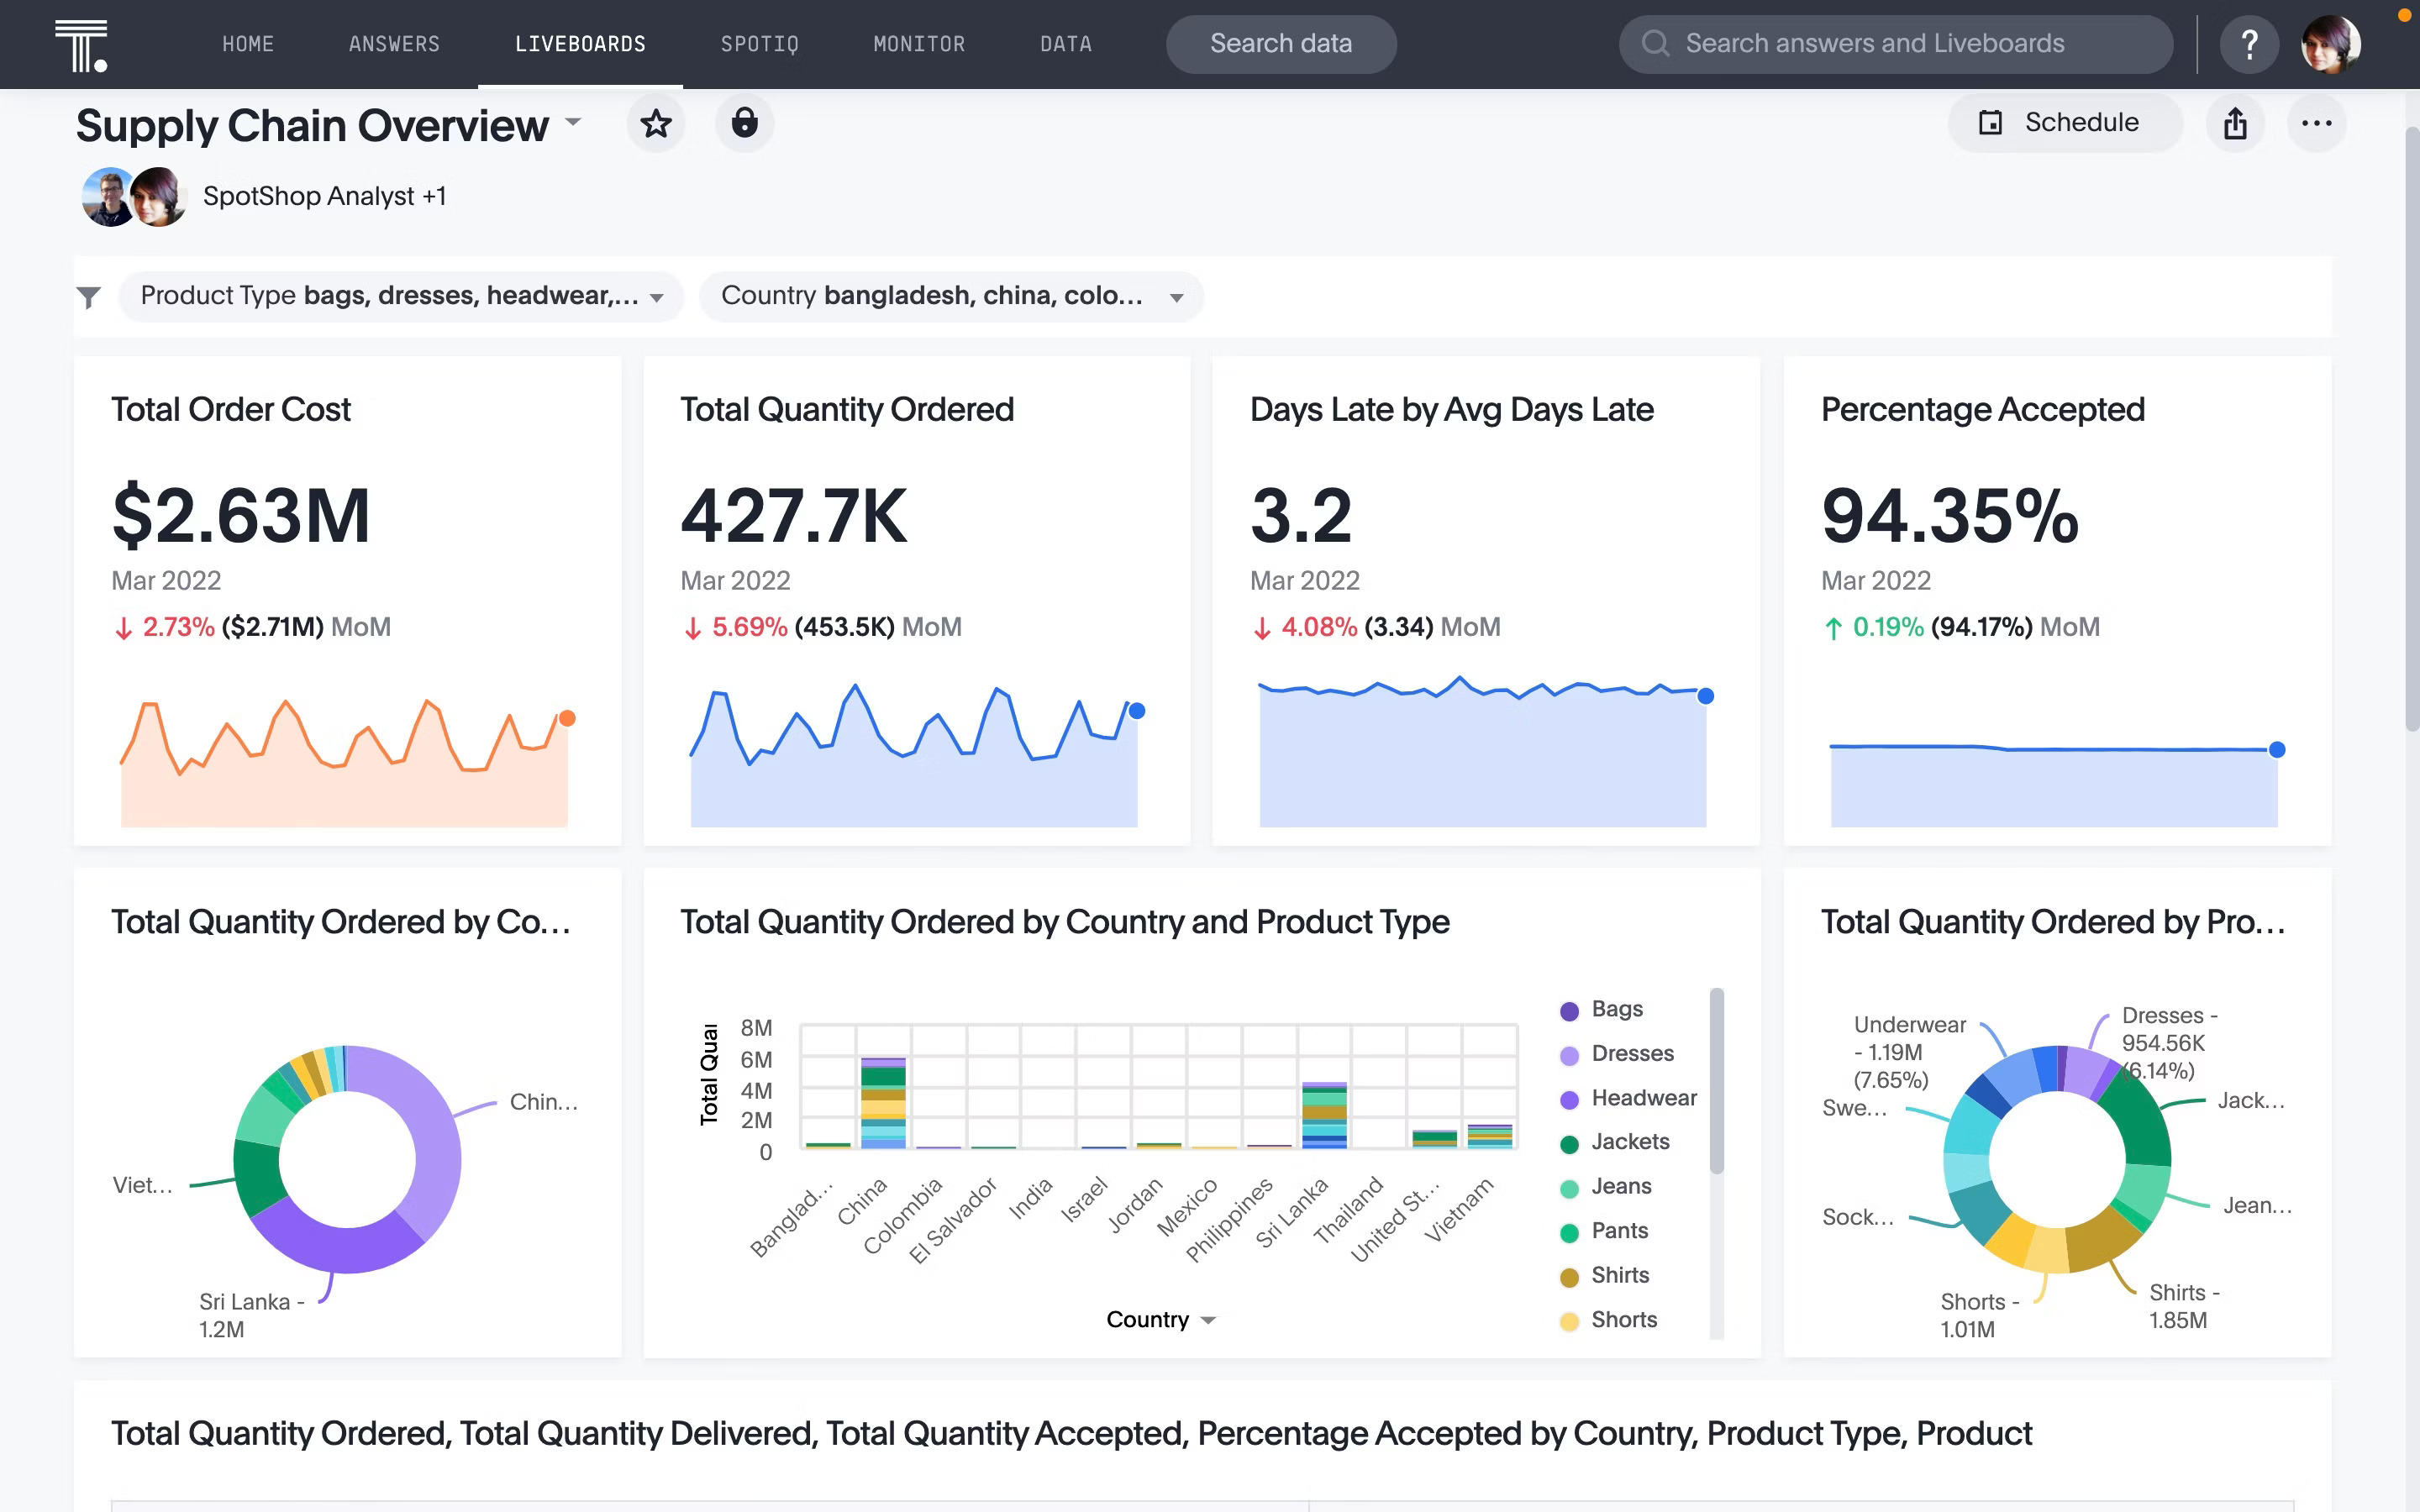
2. Inventory management
Companies lose millions due to poor inventory planning. In fact, research by Oracle shows that holding or carrying costs related to inventory planning can add up to 20–30% of your overall business cost. This creates an immense need for operational leaders to drill into data, keep track of what products or services are in stock, and see where they have shortages or overstock.
3. Marketing
Leveraging descriptive analytics, marketers gain a holistic picture of how prospects and current customers interact with their marketing campaigns. Analyzing different metrics helps you gain a performance snapshot of different campaigns, allowing you to recognize which campaigns or channels deliver the best ROI and optimize budget allocation accordingly.
For instance, here at ThoughtSpot, our marketing team uses descriptive analytics techniques such as change analysis and the monitor function to understand how prospects and customers interact with our marketing campaigns. Here’s how Katie Dunn, our former Senior Manager of Demand Generation, uses ThoughtSpot Liveboards to gain a deep understanding of performance metrics:
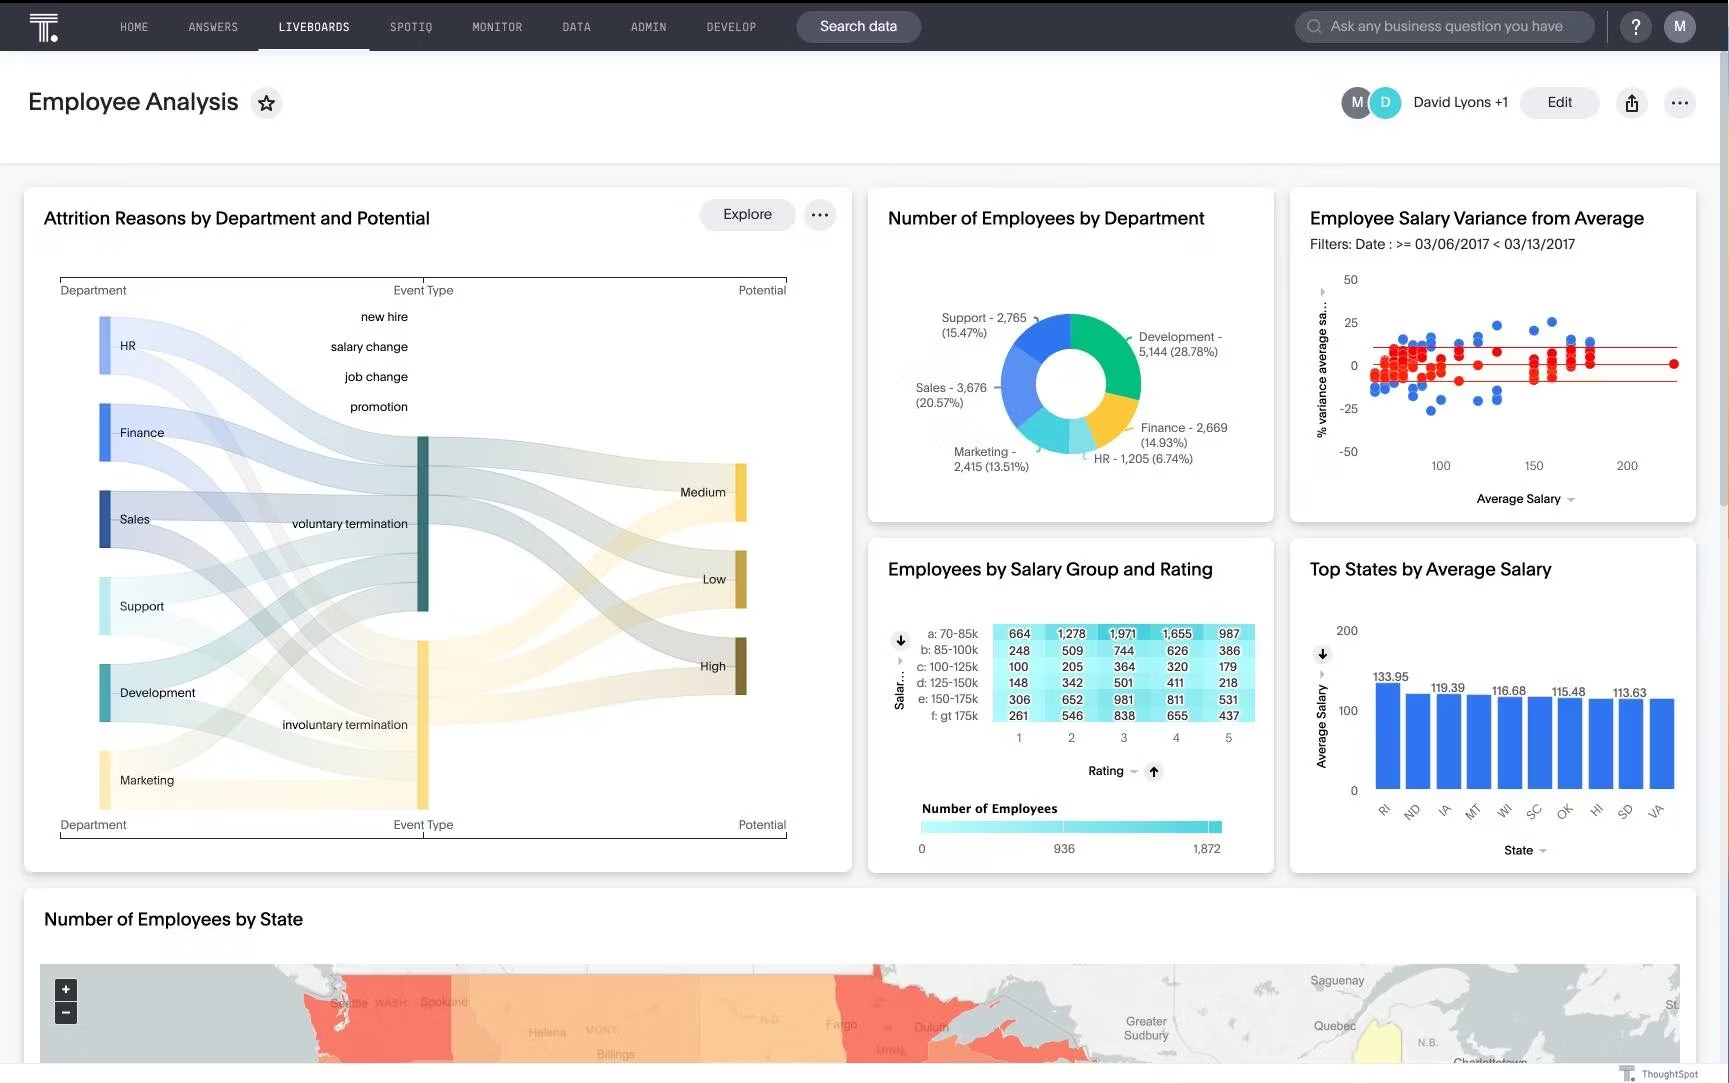
4. HR
With descriptive analytics, you can dig deep into HR metrics and past workforce data to understand what’s affecting employee performance. Depending on the insights you find, you can create targeted retention strategies, identify departments with the highest attrition rate, or take measures to improve overall employee satisfaction.
Let’s take a look at ADP, for instance. In an episode of The Data Chief, ADP’s Chief Data Officer, Jack Berkowitz, shares how the company leverages national payroll data around military members and veterans and found a significant pay gap. To address this, they create a set of planning tools that allow businesses to analyze compensation disparities, a perfect example of data monetization.
5. Sales
When used strategically, descriptive analytics helps sales managers gain visibility into their pipeline. You can unlock valuable trends in your sales data, including revenue, conversion rates, and sales growth over time. Armed with these insights, you can better understand customer behavior, adapt to changing market conditions, and stay on top of your sales goals.
Like any analytics practice, descriptive analytics has its pitfalls. Here are a few to watch for:
Data silos
Data quality issues
Over-reliance on averages
Static reports
Lack of context
1. Data silos
Data silos disrupt your business, because when your data lives in disconnected tools and departments, building a unified, accurate view is tough. And ultimately, fragmented insights lead to inconsistent decision-making.
ThoughtSpot integrates with your existing cloud platforms and apps, helping you analyze data wherever it lives.
2. Data quality issues
Bad data leads to bad insights. Incomplete, inconsistent, or duplicate data can distort your reporting and erode trust. Investing time in data cleaning and preparation is critical here.
3. Over-reliance on averages
Averages can hide important variability. Always look beyond the mean, explore distributions, segment your data, and pay attention to outliers that might signal hidden opportunities or risks.
4. Static reports
Static reports can go stale fast. In a dynamic business environment, you need dashboards that refresh automatically and reflect the latest data.
With ThoughtSpot, you can build interactive Liveboards that always stay current and explore them in real time through natural language search.
5. Lack of context
Descriptive analytics shows what happened, but it won’t tell you why. If you stop here, you risk acting on incomplete information. That’s why it’s so important to pair descriptive analysis with diagnostic and predictive techniques and to leverage tools like ThoughtSpot’s Spotter to accelerate that deeper exploration.
Understanding what happened in your business isn’t optional. It’s the starting point for every decision you make, from how you manage inventory to where you invest marketing dollars to how you grow customer relationships.
But too often, traditional reporting tools slow things down, forcing you to wait on static reports or wrestle with outdated dashboards. That’s where a modern approach makes all the difference.
With ThoughtSpot, you can explore live data on your own terms, ask questions in natural language, and instantly visualize trends and patterns. You’ll spend less time chasing numbers and more time driving impact.
Ready to see what happened and what you can do about it? Book a ThoughtSpot demo and experience agent-powered descriptive analytics in action.
FAQs
1. What is the difference between descriptive and diagnostic analytics?
Descriptive analytics focuses on summarizing past performance to give you a clear picture of what happened. Diagnostic analytics goes a step further, helping you understand why something happened by exploring the root causes and relationships in the data.
2. How is descriptive analytics used in business?
Descriptive analytics is used across business functions:
In sales, to monitor pipeline and conversion trends
In marketing, to analyze campaign performance
In finance, to track revenue, expenses, and profitability
In HR, to monitor employee retention and engagement
In operations, to manage inventory levels and supply chain performance
It provides a factual view of past and current performance to guide decisions.
3. Can non-technical users perform descriptive analytics?
Yes — especially with modern, user-friendly platforms. Tools like ThoughtSpot allow business users to ask questions in natural language, explore interactive dashboards, and generate insights without deep technical or SQL knowledge.


