


According to Statista, by the year 2025, there will be over 24 billion interconnected devices globally. The ever-expanding universe of digital touchpoints generates valuable data, and that data holds the actionable insights for those who have the power and will to explore it.
Enter digital dashboards—or Liveboards, as we call them. These innovative data visualization tools are the bridge between raw data and actionable intelligence. In this article, we’ll explore why digital dashboards have such a foothold in BI, what separates a dashboard from a liveboard, and real-world examples showing the business value of Liveboards.
Table of contents:
A digital dashboard is a visual interface that displays key metrics, data points, and performance indicators in a consolidated and easily digestible format. Think of it as a control panel that provides a snapshot of your organization's or a project's performance at a glance. From sales figures and website traffic to inventory levels and customer satisfaction scores, digital dashboards can visualize a wide range of data.
Digital dashboards are powerful tools that offer a wide range of features to help you visualize, analyze, and interpret data effectively. However, it’s important to note that not all business dashboards are created equally.
These real-time dashboards offer a modern approach to data visualization and analytics, overcoming the constraints of legacy BI tools and empowering you to extract real-time business value from your data. Unlike traditional dashboards, Liveboards facilitate instant access to insights, seamless collaboration, and easy information sharing throughout the organization.

Key features of modern digital dashboards
Real-time data updates: Stay in the loop with real-time updates that ensure the information displayed on your dashboard is always current. Whether you're tracking sales numbers, website traffic, or project milestones, you can rely on up-to-the-minute data to inform your decisions and actions.
Interactive visualization: Visualize your data with interactive charts, graphs, and maps that bring your metrics to life. With dynamic visual elements, you can easily spot trends, patterns, and outliers within your data, making complex information more accessible and understandable at a glance.
Key Performance Indicators (KPIs): Keep your finger on the pulse of your organization or project with prominently displayed KPIs. These critical metrics provide a snapshot of performance against your goals, helping you track progress and identify areas for improvement with ease.
Interactive elements: Dive deeper into your data with interactive features like drill-down and filter capabilities. You might also appreciate features like hover-over tooltips that provide more insights into the chart or graph you’re viewing. These interactive elements help you explore specific data points, uncover hidden insights, and gain a deeper understanding of your metrics through interactive exploration.
Alerts and notifications: Stay informed and proactive with customizable alerts and notifications. Set up automated alerts for critical thresholds or milestones, ensuring you're alerted to important developments and can take timely action when needed.
Data integration: Consolidate data from multiple sources into a single, unified dashboard for comprehensive analysis. Digital dashboards integrate with databases, spreadsheets, APIs, and other systems to access all your data in one place, eliminating silos and streamlining your workflow.
Collaboration and sharing: You can share insights, reports, and dashboards with colleagues and collaborate on data analysis projects. With ThoughtSpot’s note tiles, you can provide important directions for how to read or use a specific visualization.
Security and access controls: Protect your sensitive information with robust security features and access controls. Safeguard your data with user authentication, role-based permissions, and data encryption, ensuring that only authorized users can access confidential information.
1. Marketing digital dashboards
Marketing dashboards provide a comprehensive and real-time overview of metrics about marketing activities. These dashboards are designed to aid marketing professionals, managers, and stakeholders in monitoring and analyzing the performance of various marketing initiatives and campaigns.
Benefits of marketing digital dashboards
Performance tracking: With a marketing dashboard, you can track the performance of your campaigns and initiatives in real time. Monitor metrics like website traffic, conversion rates, email open rates, social media engagement, and advertising performance to assess effectiveness and make data-driven decisions for optimization.
Campaign optimization: Access real-time data and insights to quickly identify which marketing campaigns are performing well and which need improvement. Adjust campaign tactics, messaging, targeting, and budgets to maximize ROI and achieve your marketing objectives.
Cross-channel insights: Gain a holistic view of marketing performance across channels such as email, social media, search, and display advertising. Understand how different channels interact and influence each other to develop effective marketing strategies.
Competitive analysis: Benchmark your performance against competitors using competitive analysis features in some marketing dashboards. Compare metrics such as market share, brand sentiment, and advertising spend to identify opportunities and threats in the competitive landscape and adjust your strategies accordingly.
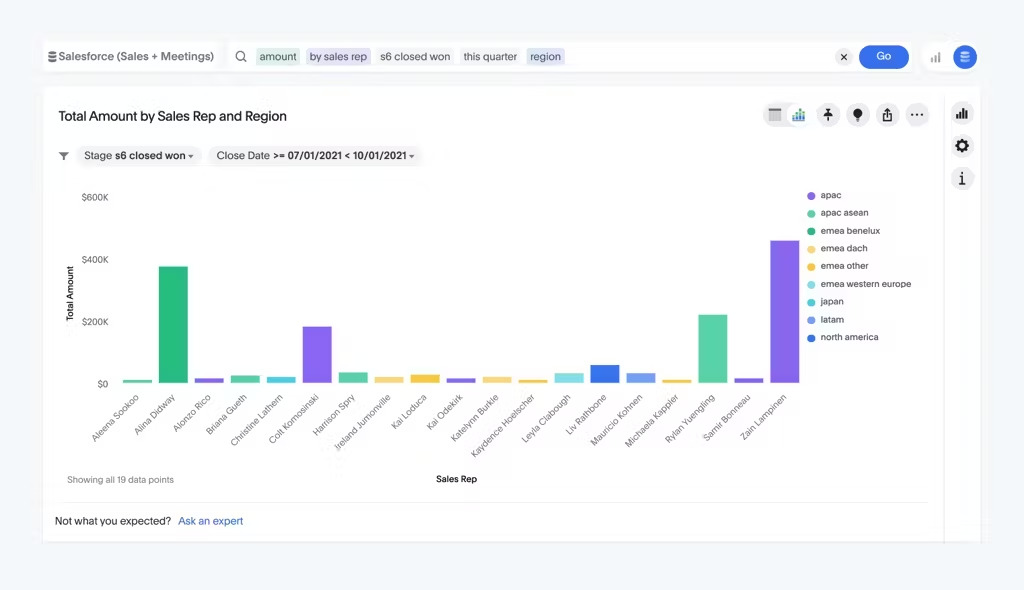
2. Sales digital dashboards
A sales dashboard provides you with a visual representation of key sales metrics and performance indicators, offering actionable insights into your sales activities and outcomes. It enables you to track sales performance, analyze trends, and make decisions to drive revenue growth and improve sales effectiveness.
Benefits of sales digital dashboards
Visibility and transparency: Sales dashboards provide visibility into sales activities and outcomes across the organization, fostering transparency and accountability. Sales managers can easily track the performance of individual sales reps, teams, and products, promoting a culture of accountability and performance.
Forecasting and planning: Sales dashboards facilitate sales forecasting and planning by providing historical sales data, trend analysis, and predictive analytics. Sales managers can use this information to forecast future sales performance, set realistic targets, and develop sales strategies to achieve their goals.
Optimized allocation: With insights from sales dashboards, sales managers can allocate resources more effectively by identifying high-potential opportunities and focusing sales efforts where they are most likely to yield results
Competitive advantage: By identifying trends, opportunities, and competitive threats, sales teams can adapt their strategies and tactics to stay ahead of the competition and drive business growth.
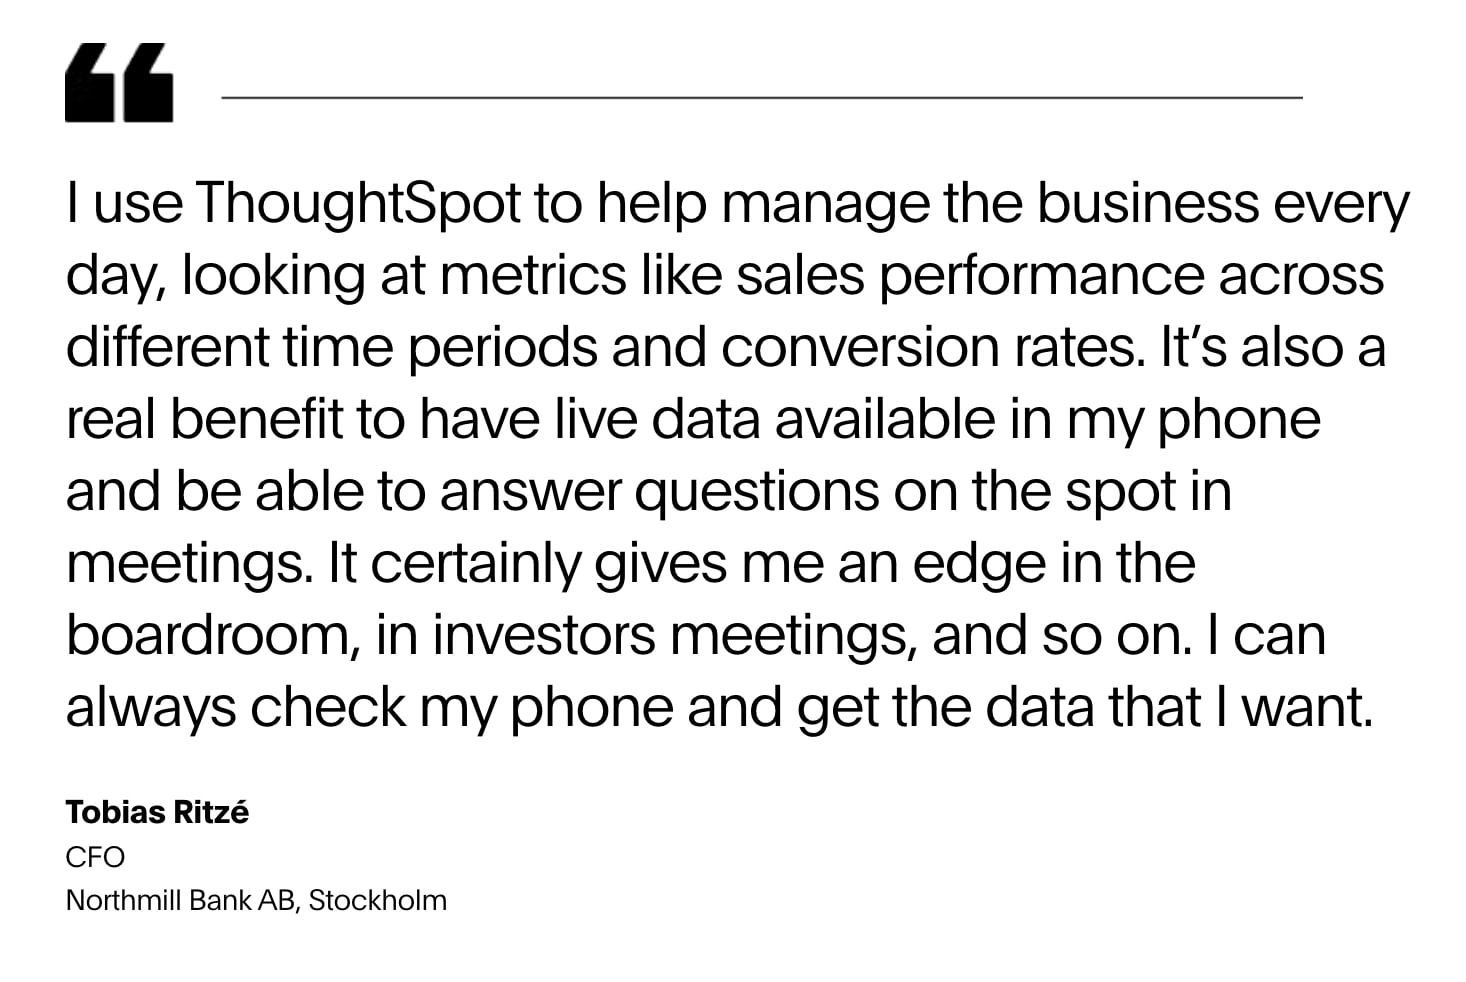
With its data team spending endless hours building reports using its legacy BI tool, Northmill was looking for a robust, future-proof modern data stack and self-service analytics platform. By using ThoughtSpot to develop Liveboards for users across finance, marketing, products, and customer service, Northmill achieved an impressive 30% increase in conversion rates.
Here’s what Tobias Ritzé, CFO of Northmill Bank has to say about ThoughtSpot:
3. Financial digital dashboards
A financial dashboard is a go-to tool for gaining a comprehensive and real-time overview of financial metrics and performance indicators. Specifically crafted for finance professionals, executives, and stakeholders, these dashboards allow you to monitor and analyze the financial health and performance of your organization.
Benefits of financial digital dashboards
Real-time insights: With financial dashboards, you gain access to up-to-date information on key financial metrics. You can make decisions based on the most current data available.
Improved decision-making: By presenting financial data in a clear and visually appealing format, dashboards enable you to quickly identify trends, patterns, and areas of concern.
Enhanced financial visibility: Dashboards offer you a comprehensive overview of financial performance, including revenue, expenses, cash flow, and profitability. You gain a clear understanding of your organization's financial health at any given moment.
Efficient resource allocation: With insights into budget utilization, expense trends, and resource allocation, financial dashboards help you optimize spending and allocate resources more effectively to maximize profitability in alignment with your goals.
Consider the case of Modern Restaurant Concepts, where the implementation of ThoughtSpot's financial dashboards by former Finance Director Lisa Sauer empowered General Managers nationwide. With instant access to sales and labor data, Liveboards facilitated prompt analysis, streamlining budget allocation and promoting clear goal alignment for growth initiatives.
“To get the information we needed, we would have to check Point of Sales and Excel reports. This was a huge reason we moved to ThoughtSpot - we needed the ease of use and flexibility that other systems couldn’t provide us.”
4. HR digital dashboards
An HR dashboard is a digital tool that provides HR professionals and managers with a visual representation of key HR metrics and performance indicators. It offers insights into various aspects of human resources management, including employee engagement, recruitment, retention, performance, and workforce analytics.
Benefits of HR digital dashboards
Increased efficiency: By consolidating HR data from various sources into a single dashboard, HR professionals can save time and effort that would otherwise be spent manually collecting and analyzing data from multiple systems or sources. These efficiency gains allow HR teams to focus on more strategic activities that drive value for the organization.
Improved transparency: HR dashboards promote transparency by providing visibility into key HR metrics and performance indicators. This transparency fosters accountability among HR professionals and managers, as well as among employees, who can access relevant HR information and track their own performance metrics.
Better talent management: HR professionals can track recruitment metrics such as time-to-fill, cost-per-hire, and source of hire, allowing them to assess the effectiveness of recruitment efforts and make data-driven decisions to optimize the hiring process.
Enhanced employee engagement: HR dashboards can include metrics related to employee engagement, such as employee satisfaction scores, engagement survey results, and turnover rates. By monitoring these metrics, HR professionals can identify areas of concern and take proactive measures to improve employee engagement and retention.
Having explored various examples and applications of digital dashboards across business functions, let's now look at how a cutting-edge solution like ThoughtSpot pushes the boundaries of data analytics. ThoughtSpot provides dynamic and interactive visualizations, delivering real-time insights precisely when and where they're needed, empowering you to make data-informed decisions with confidence.
Here are some ways Liveboards deliver distinct value-
SpotIQ uses AI-assisted analytics to uncover hidden insights.
Verified dashboards establish data governance and maintain quality standards throughout your organization.
Drill anywhere from high-level analytics to granular insights on billions of rows of data.
Speed and scale on complex data models
Real-time KPI monitoring via ThoughtSpot Monitor
Data on-the-go enables real-time data tracking on your mobile devices, empowering you to make data-driven decisions anywhere and anytime.Empowering strategic decision-making with AI-powered insights
As businesses strive to keep pace with rapid decision-making demands, adopting digital dashboards plays a pivotal role in effectively managing dynamic data flows. Empower your teams with the tools they need to make informed, real-time decisions with ThoughtSpot Liveboards.
Start your data-driven journey with a live demo of ThoughtSpot.


