Imagine you are buying an air conditioner for your home. Naturally, you would search the internet to research options, compare prices, assess product descriptions, look for reviews, or even go to a store to check out the product in person.
This type of consumer behavior represents an excellent opportunity for brands. Being present and creating engaging customer touchpoints during the purchasing process helps you guide the decision-making process. To truly understand customer behavior, you need to leverage your customer relationship management (CRM) system—turning your sales, marketing, and customer service data into actionable insights.
Here, we will break down how you can uncover hidden customer insights and trends with your CRM dashboards so you can build consumer loyalty through personalization and segmentation.
Table of contents:
A CRM dashboard is a visual interface that provides a snapshot of your CRM data, including key performance indicators and metrics. These dashboards, or as we call them Liveboards, consolidate tons of data from your CRM system and serve as a centralized hub for all your sales, marketing, and customer-related information.
These interactive tools empower you to track, analyze, and visualize real-time KPIs, such as sales performance, customer demographics, lead generation and customer service data.
1. Analyzing customer behavior
Customer experience is a priority for all businesses, but eliciting positive emotions across hundreds of touch points is easier said than done. Luckily, CRM dashboards combine customer data from various touchpoints like emails, calls, website interactions, social media engagements, and purchases into a single source of truth. Doing so allows you to visualize the overall customer journey. Understanding this funnel will help you identify trends, pinpoint pain points, and capitalize on emerging opportunities.
For example, leveraging ThoughtSpot’s AI-powered Liveboards, Neobank Northmill was able to analyze massive amounts of user data and pinpoint where exactly people tend to drop off in their sign-up process. These insights empowered Northmill to improve its onboarding process, boosting the conversion rates by a whopping 30%.
“It is all about being as relevant and personal as possible so users’ personal finance can benefit from the insights. It can be getting a notification of a discount deal at your favorite cafe or a tailored offer to lower the cost of your insurance,”
2. Enhancing personalization
As Dr. Katia Walsh, Chief Global Strategy and AI Officer at Levi Strauss & Co., said in an episode of The Data Chief, “No two customers are the same—so why should your sales and marketing strategies be the same?”
With CRM dashboards, you gain visibility into your customers’ past interactions, campaign performance data, and engagement metrics. This will help you gain a deeper understanding of your target audiences and what works for them. Use these insights to craft personalized marketing messages, create targeted ads, and place tailored product recommendations at the right place and time, helping you deliver highly relevant campaigns and drive ROI.
Here’s how Katie Dunn, our former Senior Demand Generation Manager uses ThoughtSpot to understand how prospects and customers interact with our marketing campaigns:
3. Improving retention
Ideally, your customer success team should focus on finding insights that help customers achieve their goals, instead of wasting time on tedious activities like manually processing data or writing complicated queries. By giving your team modern, AI-powered dashboard tools, you empower them to keep track of all customer interactions and queries.
Analyzing this data also helps you identify customer pressure points. With visibility, you can improve response times, personalize support, and work towards proactive issue resolution, leading to more satisfied—and loyal—customers.
Consider Wellthy. By using ThoughtSpot’s interactive Liveboards, Wellthy’s care team could visualize all patient data and segment members based on their specific needs. Doing so helps Wellthy’s Care Coordinators offer tailored experiences and personalized support, boosting customer loyalty.
Watch this segment from Beyond 2023 to learn how Wellthy is capitalizing on the Modern Data Stack with ThoughtSpot.
CRM dashboards help your sales and marketing teams keep track of real-time KPIs and make informed decisions. However, not all dashboard tools have these real-time data processing capabilities. To ensure that you choose the best tool for your business, here are some factors to consider for a better ROI:
1. Focus on scalability
Your CRM software generate enormous amounts of data, which will continue to grow as you succeed. To analyze such complex datasets, you need a scalable data analytics tool with real-time processing features to help you gain a comprehensive view of your data. Ensure that your dashboard tool has the technical scalability to handle large volumes of data and offers AI assistance for data modeling so your team can focus more on analyzing data and spend less time on manual processing.
2. Supports interactivity
Interactive data visualizations are key for creating compelling data stories. With the ability to drill into data and explore specific data points, you encourage users to engage with data and identify important trends, patterns, and insights. Furthermore, modern analytics tools allow users to add notes or highlight a few data points to add more context to their data story, leading to faster decision-making.
Here’s how ThoughtSpot’s search-driven data experience empowers users to find hidden insights using interactive elements such as drill-downs and filters:
3. Compatible with AI-driven technologies
You know that GenAI is a powerful tool for productivity. For instance, by leveraging AI-powered analytics solutions like ThoughtSpot, you can ask complex questions about your CRM data in natural language and get AI-driven insights and visualizations. Such actionable insights help you get to the ‘why’ faster and drive business value.
4. Allows customization
Legacy dashboard tools often require technical expertise to update or reengineer. With a self-service analytics tool, you can create dashboards easily using a drag-and-drop interface and pre-built templates. It also allows you to customize the look and feel of your dashboard, including choosing different types of charts, colors, and widgets. This helps you showcase your findings in an easy-to-understand format.
Just as every business goal is unique, CRM dashboards come in various forms, each offering a nuanced perspective. Let’s take a look at some of the top CRM dashboard examples to see how they can help you make informed business decisions:
1. Sales pipeline dashboard
This CRM dashboard provides an overview of the various stages of the sales process, from lead generation to deal closure. Using this dashboard, sales leaders can gain insights into all deals and opportunities in the pipeline, allowing them to track progress, identify opportunities, and make informed decisions to optimize sales strategies. Here are some of the top KPIs in a sales pipeline dashboard:
Pipeline value: Measures the total value of all deals currently in the pipeline. This KPI represents the potential revenue your team could generate if all opportunities are successfully closed
Sales cycle length: The average time it takes for the leads to move through the sales pipeline, from initial contact to closure
Sales opportunities: Measures potential sales deals or prospects who have shown interest in purchasing your product or service
2. Campaign performance dashboard
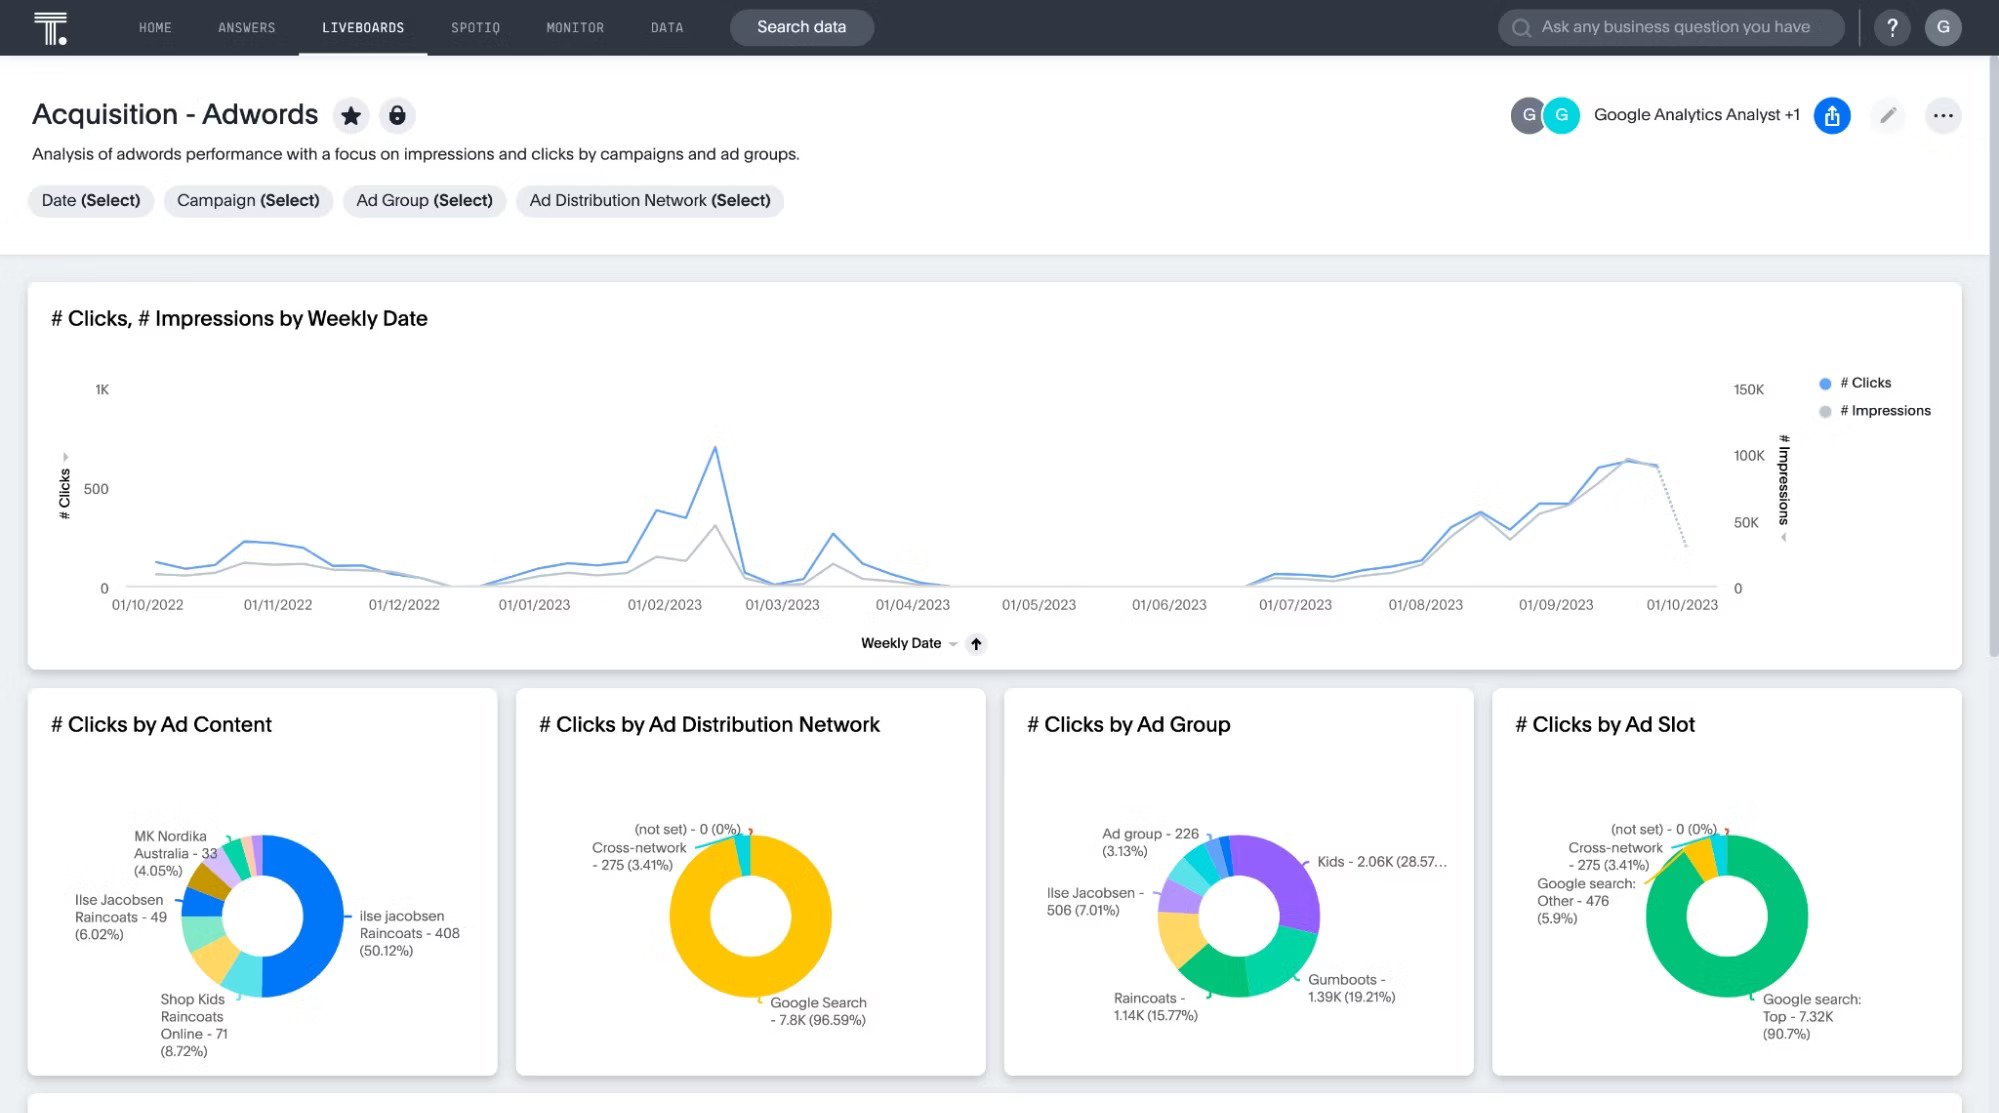
Marketing leaders use this CRM dashboard to gain a high-level view of ongoing campaigns and monitor customer behaviors. It helps them identify opportunities to improve customer experience across channels and create targeted content. A campaign performance dashboard may include the following metrics:
Click-through rate (CTR): A ratio that shows how many people clicked on your ad compared to the total number of views
Cost per acquisition (CPA): Determines the cost of acquiring a new customer
Conversion rate: Total percentage of users who completed a desired action (e.g. made a purchase or filled out a form) after clicking on your ad or video campaign

3. Lead generation dashboard
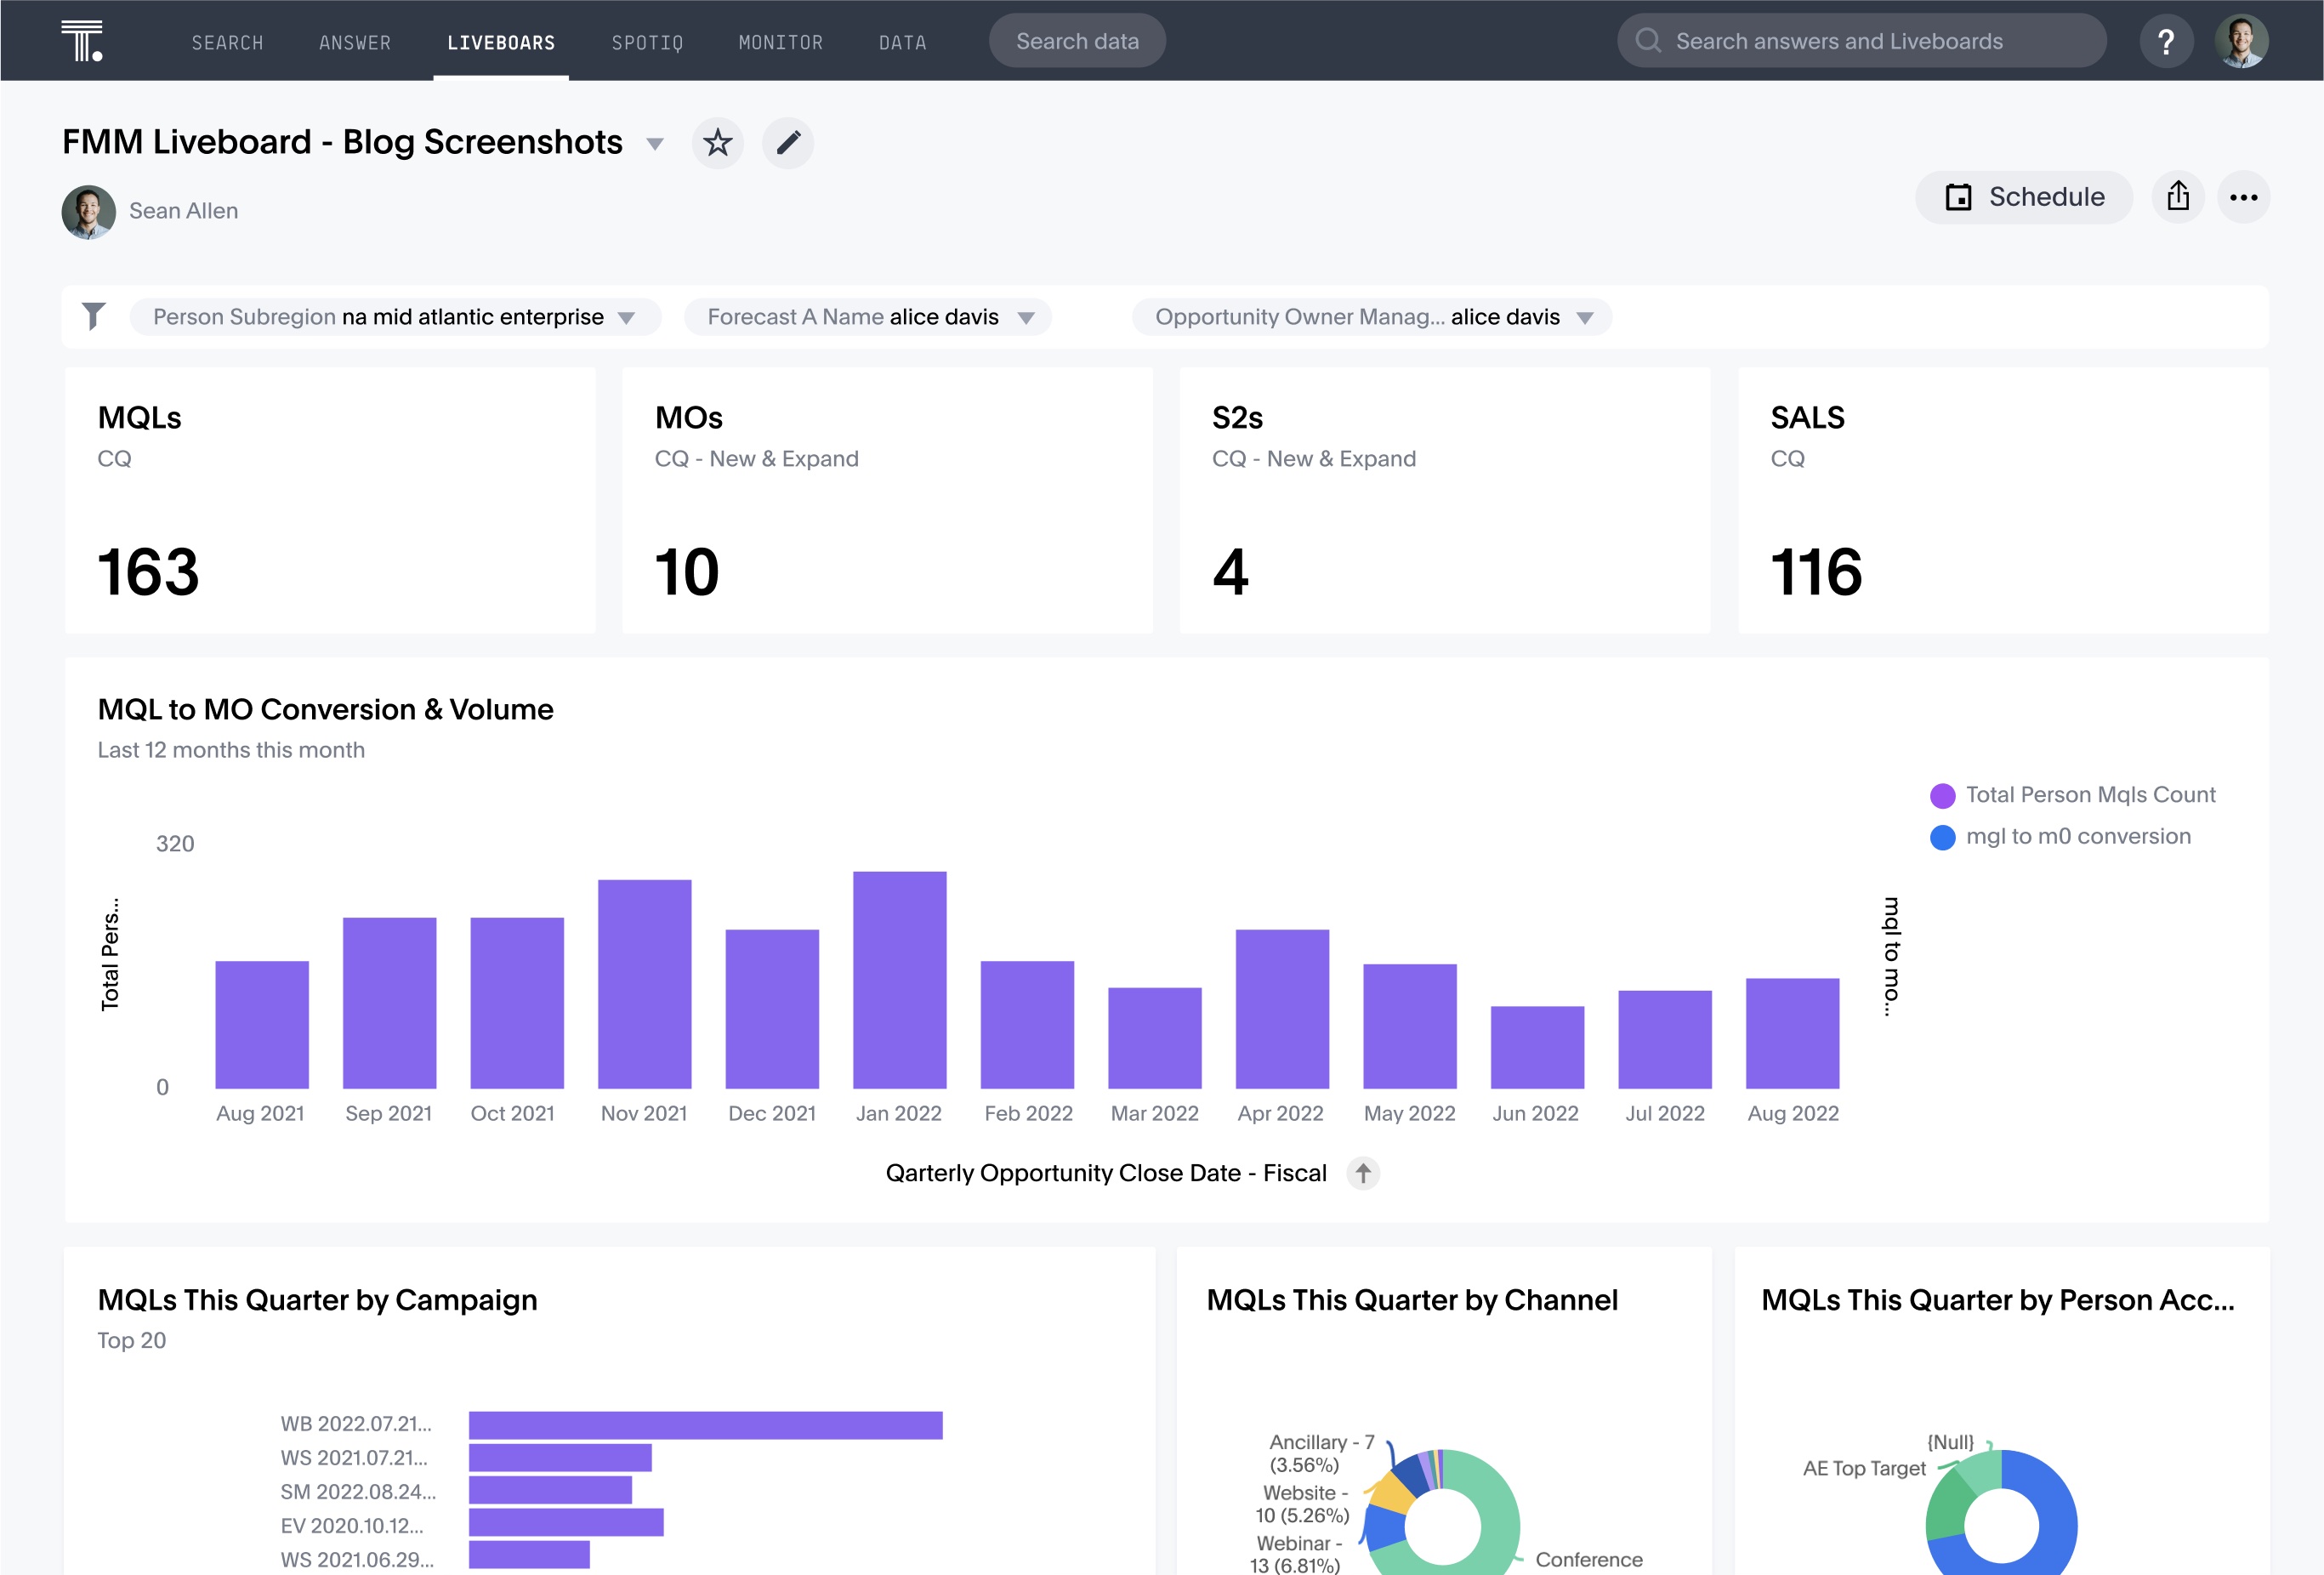
This CRM dashboard helps your marketing team assess the effectiveness of their lead generation strategies. It offers a visual representation of key metrics and indicators that help your team evaluate how marketing efforts are converting to potential pipelines and bookings. Here are the top marketing KPIs in a lead generation dashboard:
Marketing qualified leads (MQLs): Measures the total number of people who have shown interest in your company’s products or services based on your marketing efforts
Sales qualified leads (SQLs): Measures the total number of leads who have been vetted by the marketing team and are ready to engage with the sales team
Cost per lead: Calculates the average amount it takes to generate a lead\

4. Activities dashboard
An activity dashboard shows a summary of all the actions taken by sales representatives, including calls made, emails sent, meetings scheduled, and time spent on prospecting. It helps the sales team track their performance and gain valuable insights into the efficiency of their efforts to convert leads into customers. An activity dashboard includes the following sales KPIs:
Monthly calls made by sales rep: Total number of phone calls initiated by sales representatives within a specified time period
New business meetings scheduled: Total number of meetings arranged by the sales representatives or account managers within a specified time period
Response time: The average time taken to respond to customer inquiries, requests, or messages
Today’s consumers are overwhelmed by choice, making it hard for your brand to stand out. ThoughtSpot’s AI-Powered Analytics can help you move the needle.
With ThoughtSpot, you combine all your CRM, marketing, and sales data into a single source of truth—providing the insights you need to make smart investments, drive engagement, and build loyal customers.
Turn your CRM data into a competitive advantage. Request a ThoughtSpot demo today.


