


According to Statista, the total amount of data created, captured, copied, and consumed globally is expected to reach 149 zettabytes by the end of 2024. To put that into perspective, it’s an overwhelming volume—one that could make even the most data-savvy teams feel swamped.
But the real challenge isn’t gathering data anymore; it’s turning that data into clear, actionable insights that actually drive smarter decisions and create real business impact. That’s where the right data analytics software comes in. From intuitive platforms for non-technical users to advanced tools for data pros, the right tool can change the way your team works, solves problems, and stays competitive.
In this guide, we’ll explore the best data analytics tools for 2026. We’ll break down their key features, use cases, and what sets them apart. Whether you’re just starting with analytics or choosing the right data analytics platform for your team, this guide will help you find the tool that turns all that data into your next big opportunity.
What is data analytics?
Data analytics is the process of examining and interpreting large sets of data to find insights that help you make better decisions. It’s about spotting patterns and trends in the data that can guide your strategies and improve results.
What if you could pair your expertise with tools that help you make sense of complex data faster? That’s the power of data analytics software. Acting as a supportive partner, it works alongside you to identify trends, predict future outcomes, and make data-driven decisions. These tools simplify complex data into easy-to-understand visualizations, allowing you to act quickly on insights while they handle the analysis.
The best data analytics software in 2026
- ThoughtSpot Analytics: Best overall for AI-powered business intelligence (BI)
- Tableau: Good for interactive data visualization
- Power BI: Good for integration with Microsoft services
- Python: Good for advanced data manipulation and machine learning
- SQL: Good for querying structured data
- Microsoft Excel: Good for basic reporting and data manipulation
ThoughtSpot Analytics is a modern, AI-driven business intelligence (BI) and data analytics platform that helps you democratize data analytics across your organization. Whether you’re a technical or business user, ThoughtSpot lets you ask and answer business-critical questions using natural language queries. Unlike traditional BI tools that rely on pre-built dashboards and SQL expertise, ThoughtSpot provides real-time, actionable insights at scale, helping you foster a self-service data culture within your team.
Core features:
1. Spotter, your AI analyst: ThoughtSpot's Spotter is your AI Analyst, designed to deliver actionable insights for any data and any question, all in real-time. You can ask questions in plain English, such as “What were our sales last month?” or dive into more complex queries. Spotter then autonomously analyzes the data and generates accurate visualizations and reports. Spotter empowers everyone, from business teams to data leaders, to access data-driven insights instantly.
2. Real-time insights with Liveboards: Liveboards in ThoughtSpot let you create and interact with dynamic, real-time dashboards. You can apply filters and drill down into specific data points, with updates happening instantly. This feature is perfect for teams that need real-time insights to make fast decisions. For example, marketing teams can track campaign performance as it unfolds and adjust strategies on the fly with the latest data.
3. Embedded analytics: With ThoughtSpot’s embedded analytics, you can seamlessly integrate interactive liveboards into your apps, websites, or platforms. This lets your users explore data directly within the tools they already use, without the need to build custom data analytics solutions. It’s especially useful if you’re part of a SaaS platform or an enterprise looking to offer data-driven insights as part of your product experience.
4. AI-driven recommendations and anomaly detection: ThoughtSpot’s AI capabilities do more than just reveal insights. Its algorithms proactively recommend next steps, like predicting trends or identifying anomalies in your data. For instance, if sales in a specific region suddenly decline, the system will flag this anomaly, allowing your team to investigate and respond quickly.
Pros:
Spotter provides easy access to data from anywhere, at any time.
It empowers business users with self-service analytics, enabling everyone on the team to explore and generate insights without needing technical expertise or support from data teams.
It integrates seamlessly with top cloud data warehouses, offering fast and dependable data access.
Cons:
Some advanced features may require additional training for users to fully leverage their capabilities.
Reviews
Take a look at these G2 reviews, showcasing how ThoughtSpot is empowering users across industries with actionable insights and data-driven decisions.
“I like how intuitive simple queries can be to create. Sometimes, it is as straightforward as just typing in the question you want to answer with your data - especially since the AI-Answer functionality has been available.”
“The interface of ThoughtSpot is incredibly user-friendly, especially for people like me who struggle with challenging data. It enables us to create reports, dashboards, and handle data without requesting Power BI assistance. The search feature on ThoughtSpot is incredibly quick compared to other search engines. It's like having a data finding quick capability. We no longer waste a ton of time searching for data manually thanks to this.”
Pricing
14-day free trial
Essentials: $1250 /month (20 users)
Pro: Custom
Enterprise: Custom
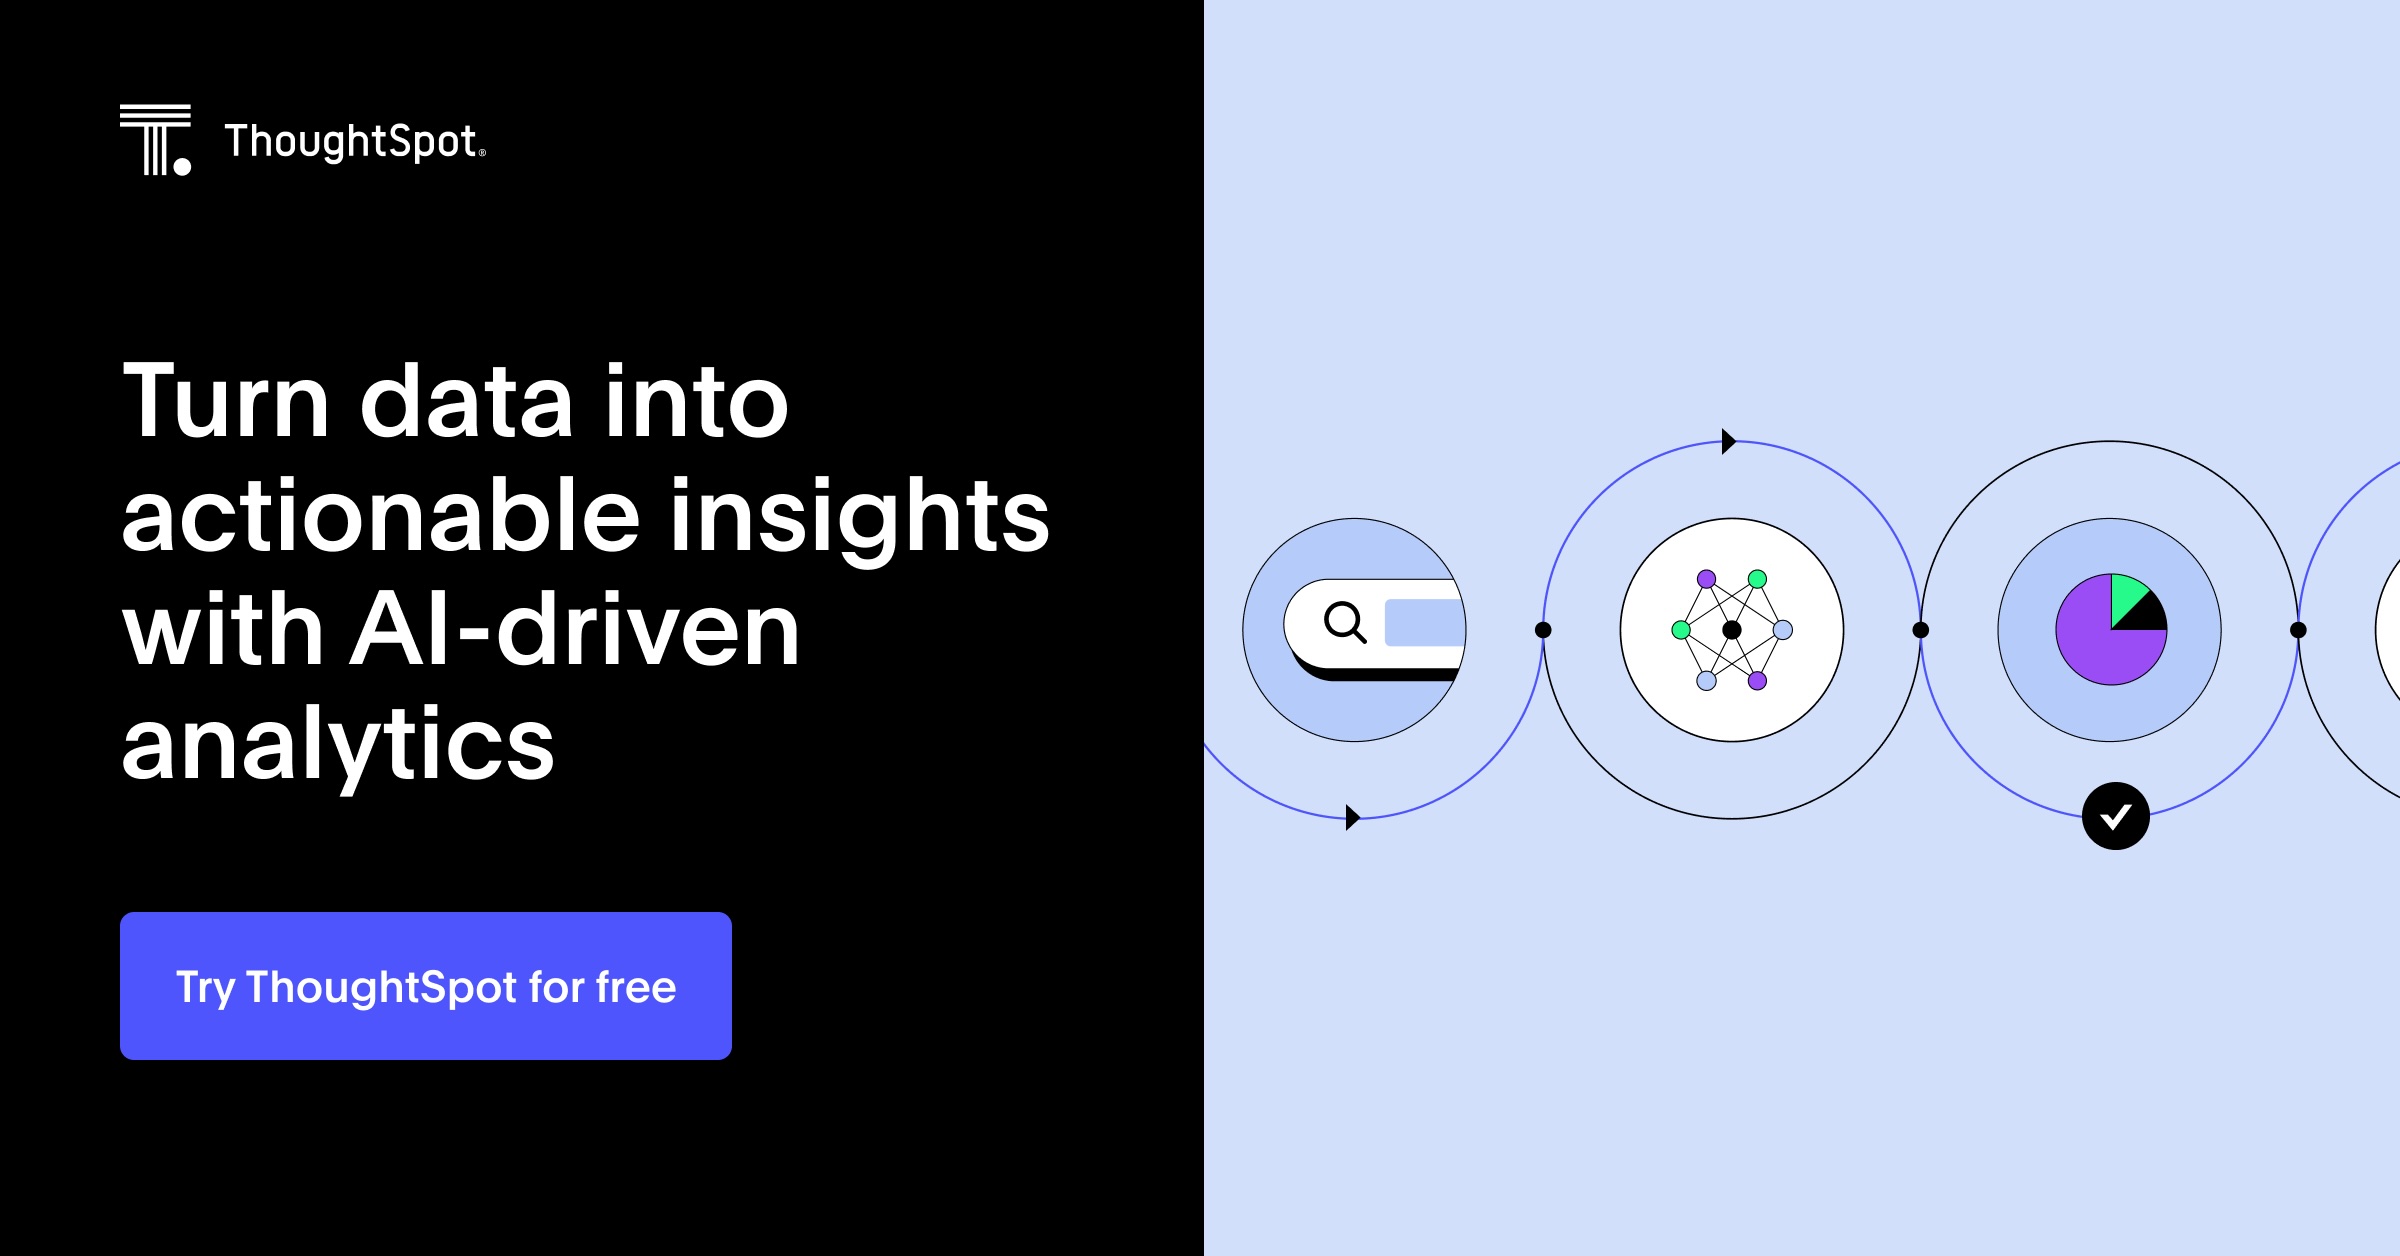
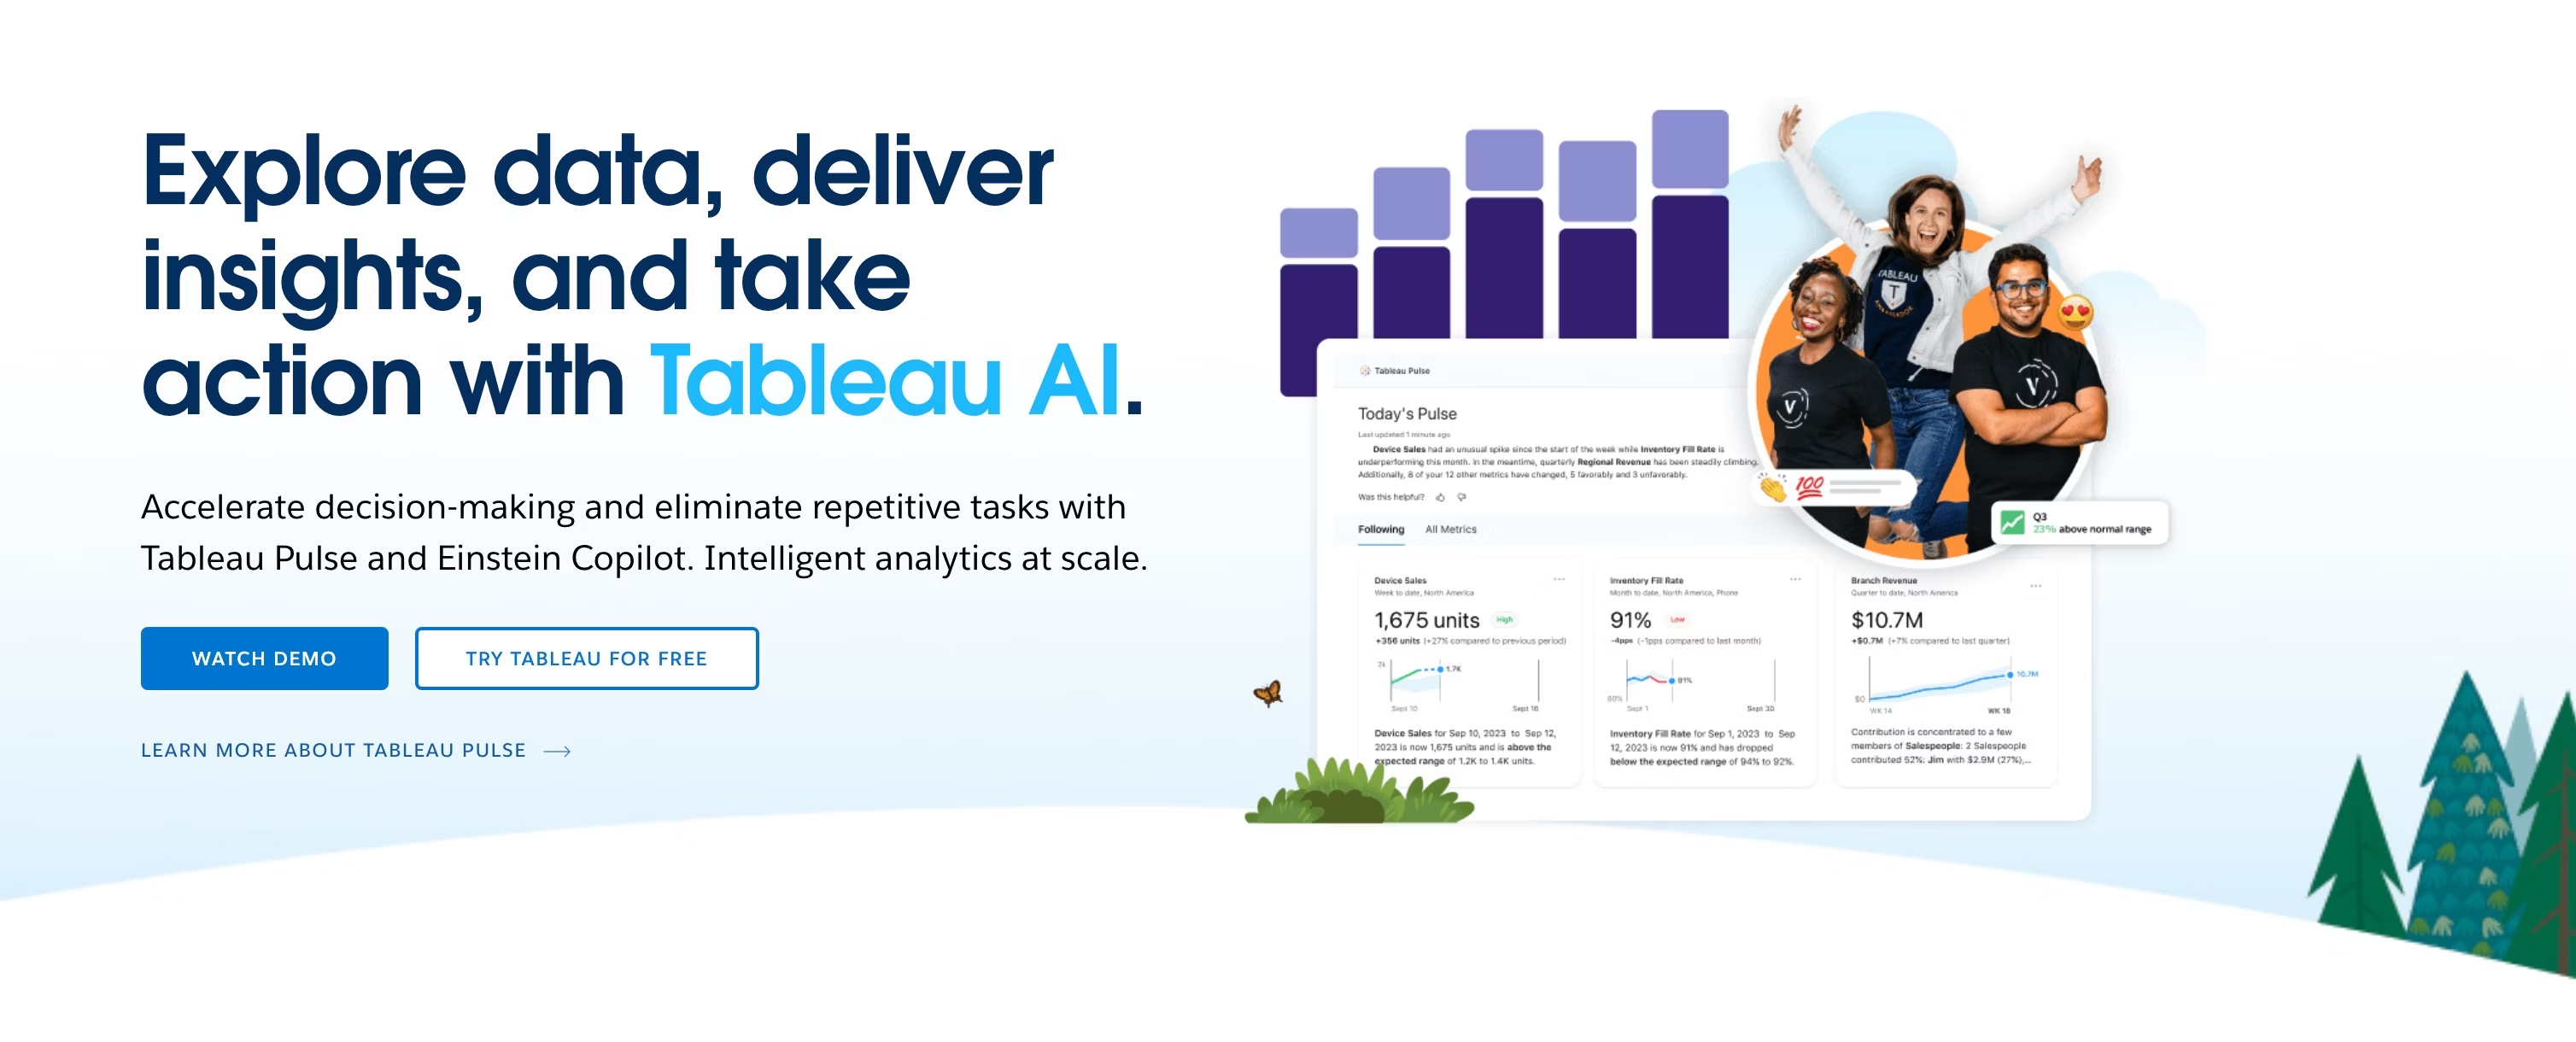
Tableau is a data analysis tool focused on interactive data visualization. Developed in 2003 and acquired by Salesforce, it helps organizations turn raw data into visuals that aid decision-making. It is used by analysts and business users for its ability to handle complex data and create dashboards with minimal technical expertise. Its wide range of data integration options makes it suitable for organizations of all sizes.
Core features:
Interactive dashboards: Users can build dashboards that allow for filtering, drilling down, and sharing visuals to monitor key metrics.
Data integration: Tableau connects to various data sources, including Excel, SQL databases, cloud platforms, and APIs, enabling a comprehensive view of the data.
Tableau prep: A tool designed to assist with data cleaning and preparation, making it easier to organize raw data into a format suitable for analysis.
Pros
Interactive dashboards for data analysis.
Customizable visualizations to meet different needs.
Integrates with various data sources.
Cons
Advanced features can be difficult for new users to navigate.
May experience performance issues with large datasets.
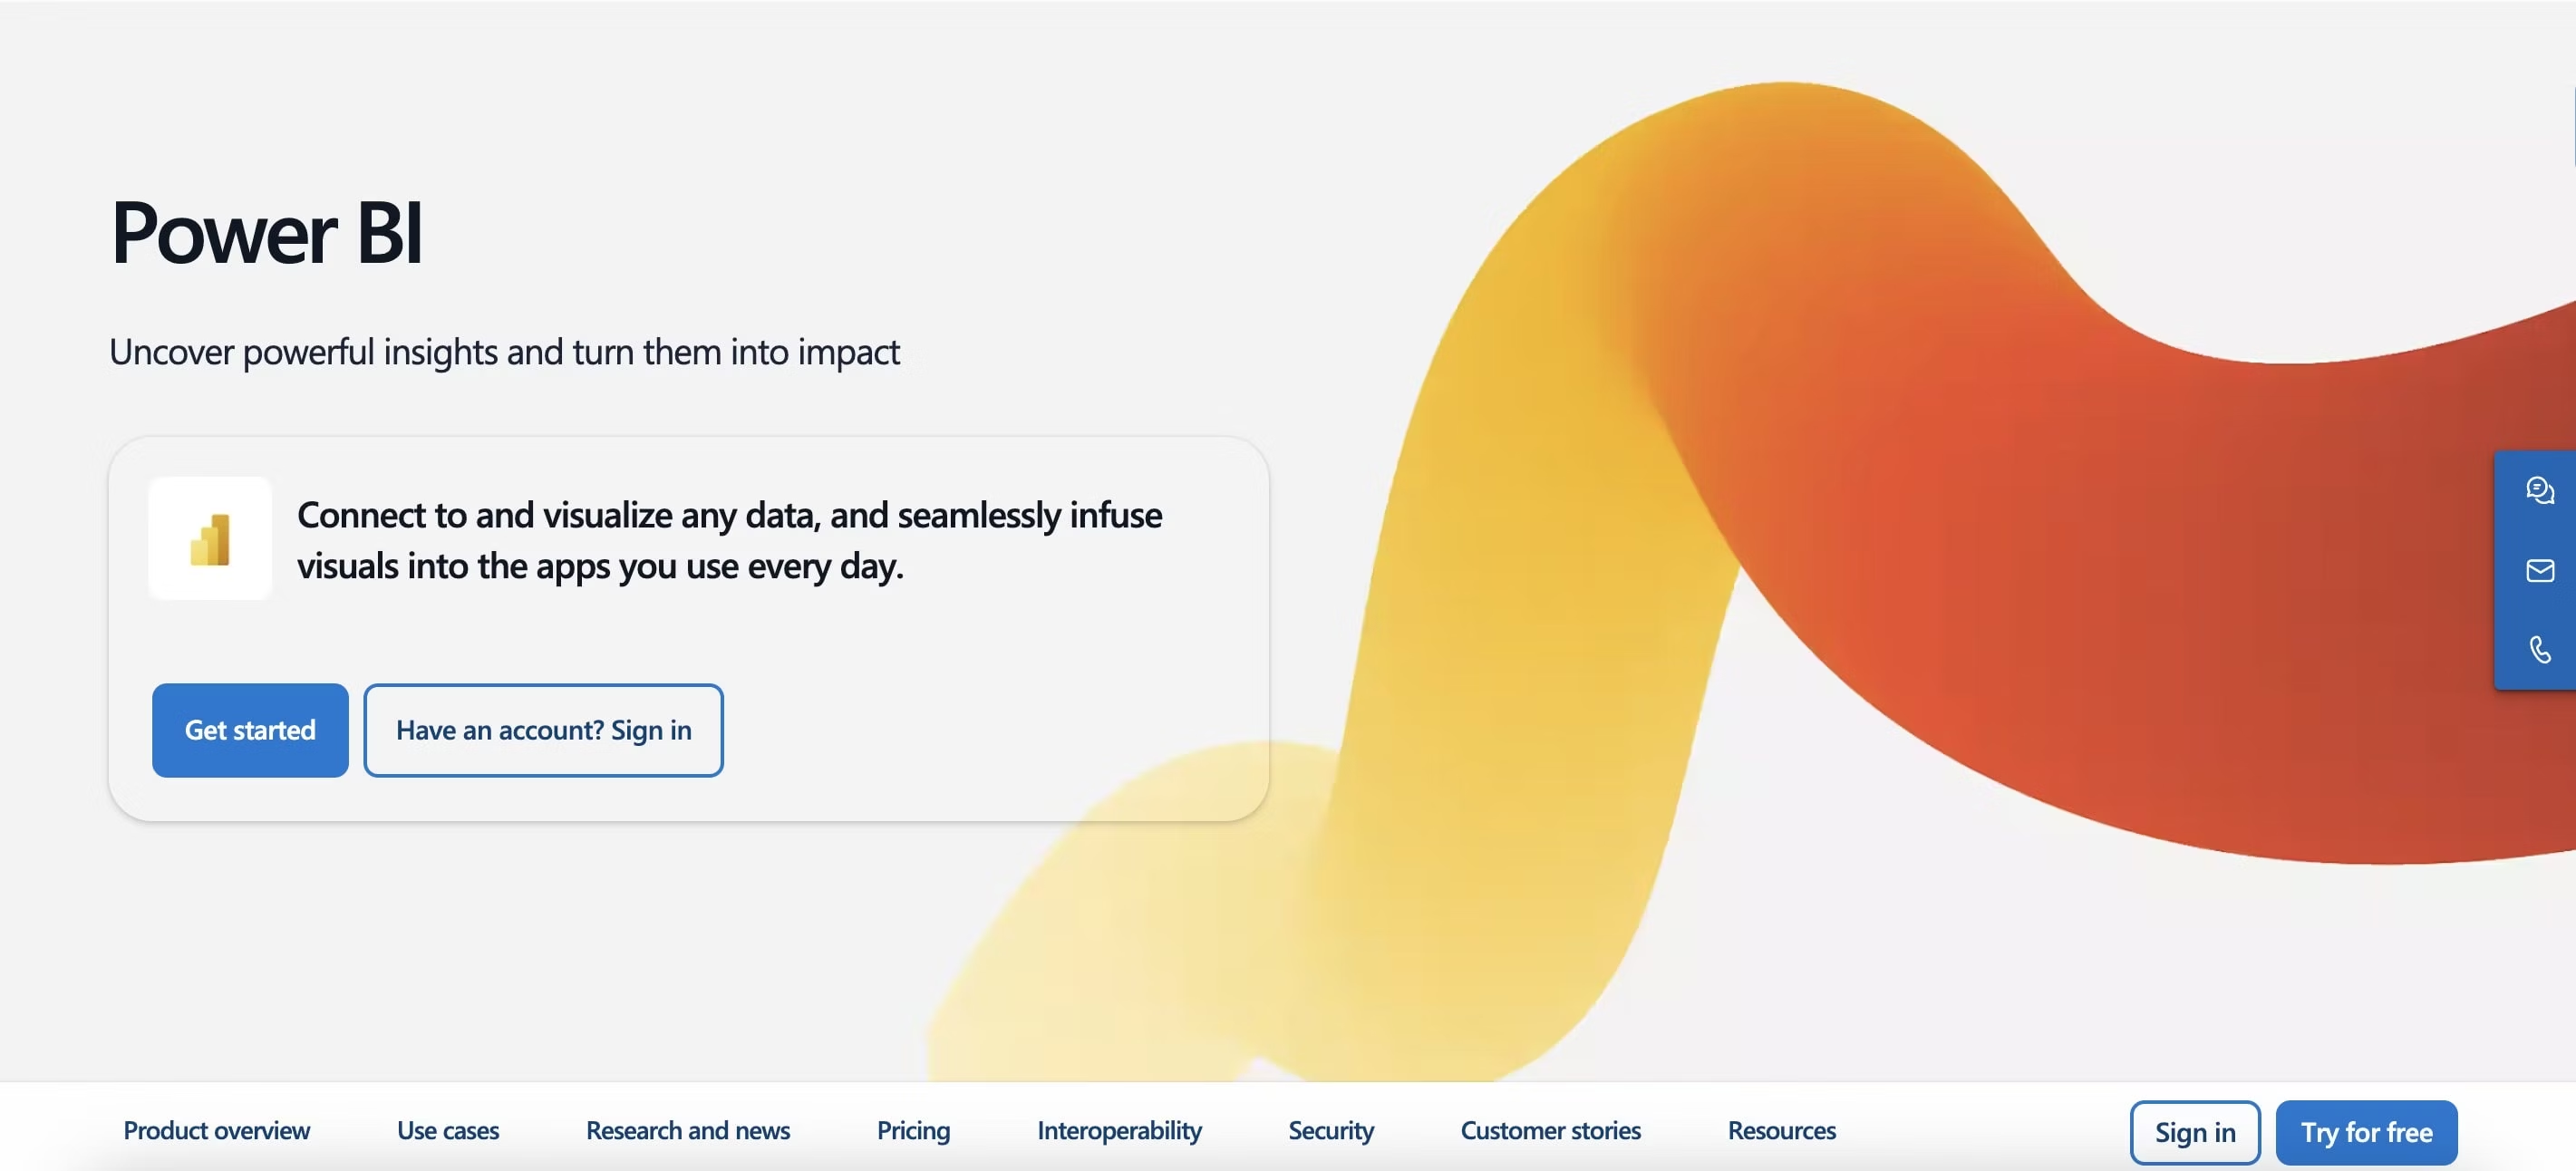
Power BI is a data analysis tool that offers a drag-and-drop interface for extracting insights and understanding data context. It integrates with various Microsoft products and provides AI features to assist with building dashboards. Users can clean data, define relationships, and create dimensions to improve data exploration and analysis.
Core features:
Interactive dashboards: Power BI allows users to visualize data in real-time with interactive charts and graphs. Users can drill down and filter data to find insights and understand relationships.
Change analysis and data modeling: Users can compare data across different time periods to identify trends and anomalies. Data modeling helps define relationships between data sources for deeper data analysis.
Data connectors: Power BI connects to various data sources, including databases, cloud services, and Excel, streamlining data consolidation and ensuring analyses are based on current data.
Pros
Power BI integrates smoothly with Microsoft services like Excel and Azure, making it ideal for organizations already using these tools.
AI features like Microsoft Copilot automate insights and report generation, enhancing the user experience.
Cons
Basic features are user-friendly, but advanced tools may require a steeper learning curve.
The licensing structure can be confusing, potentially leading to unexpected costs.
💡 Relevant read: 10 Power BI alternatives for data-driven insights
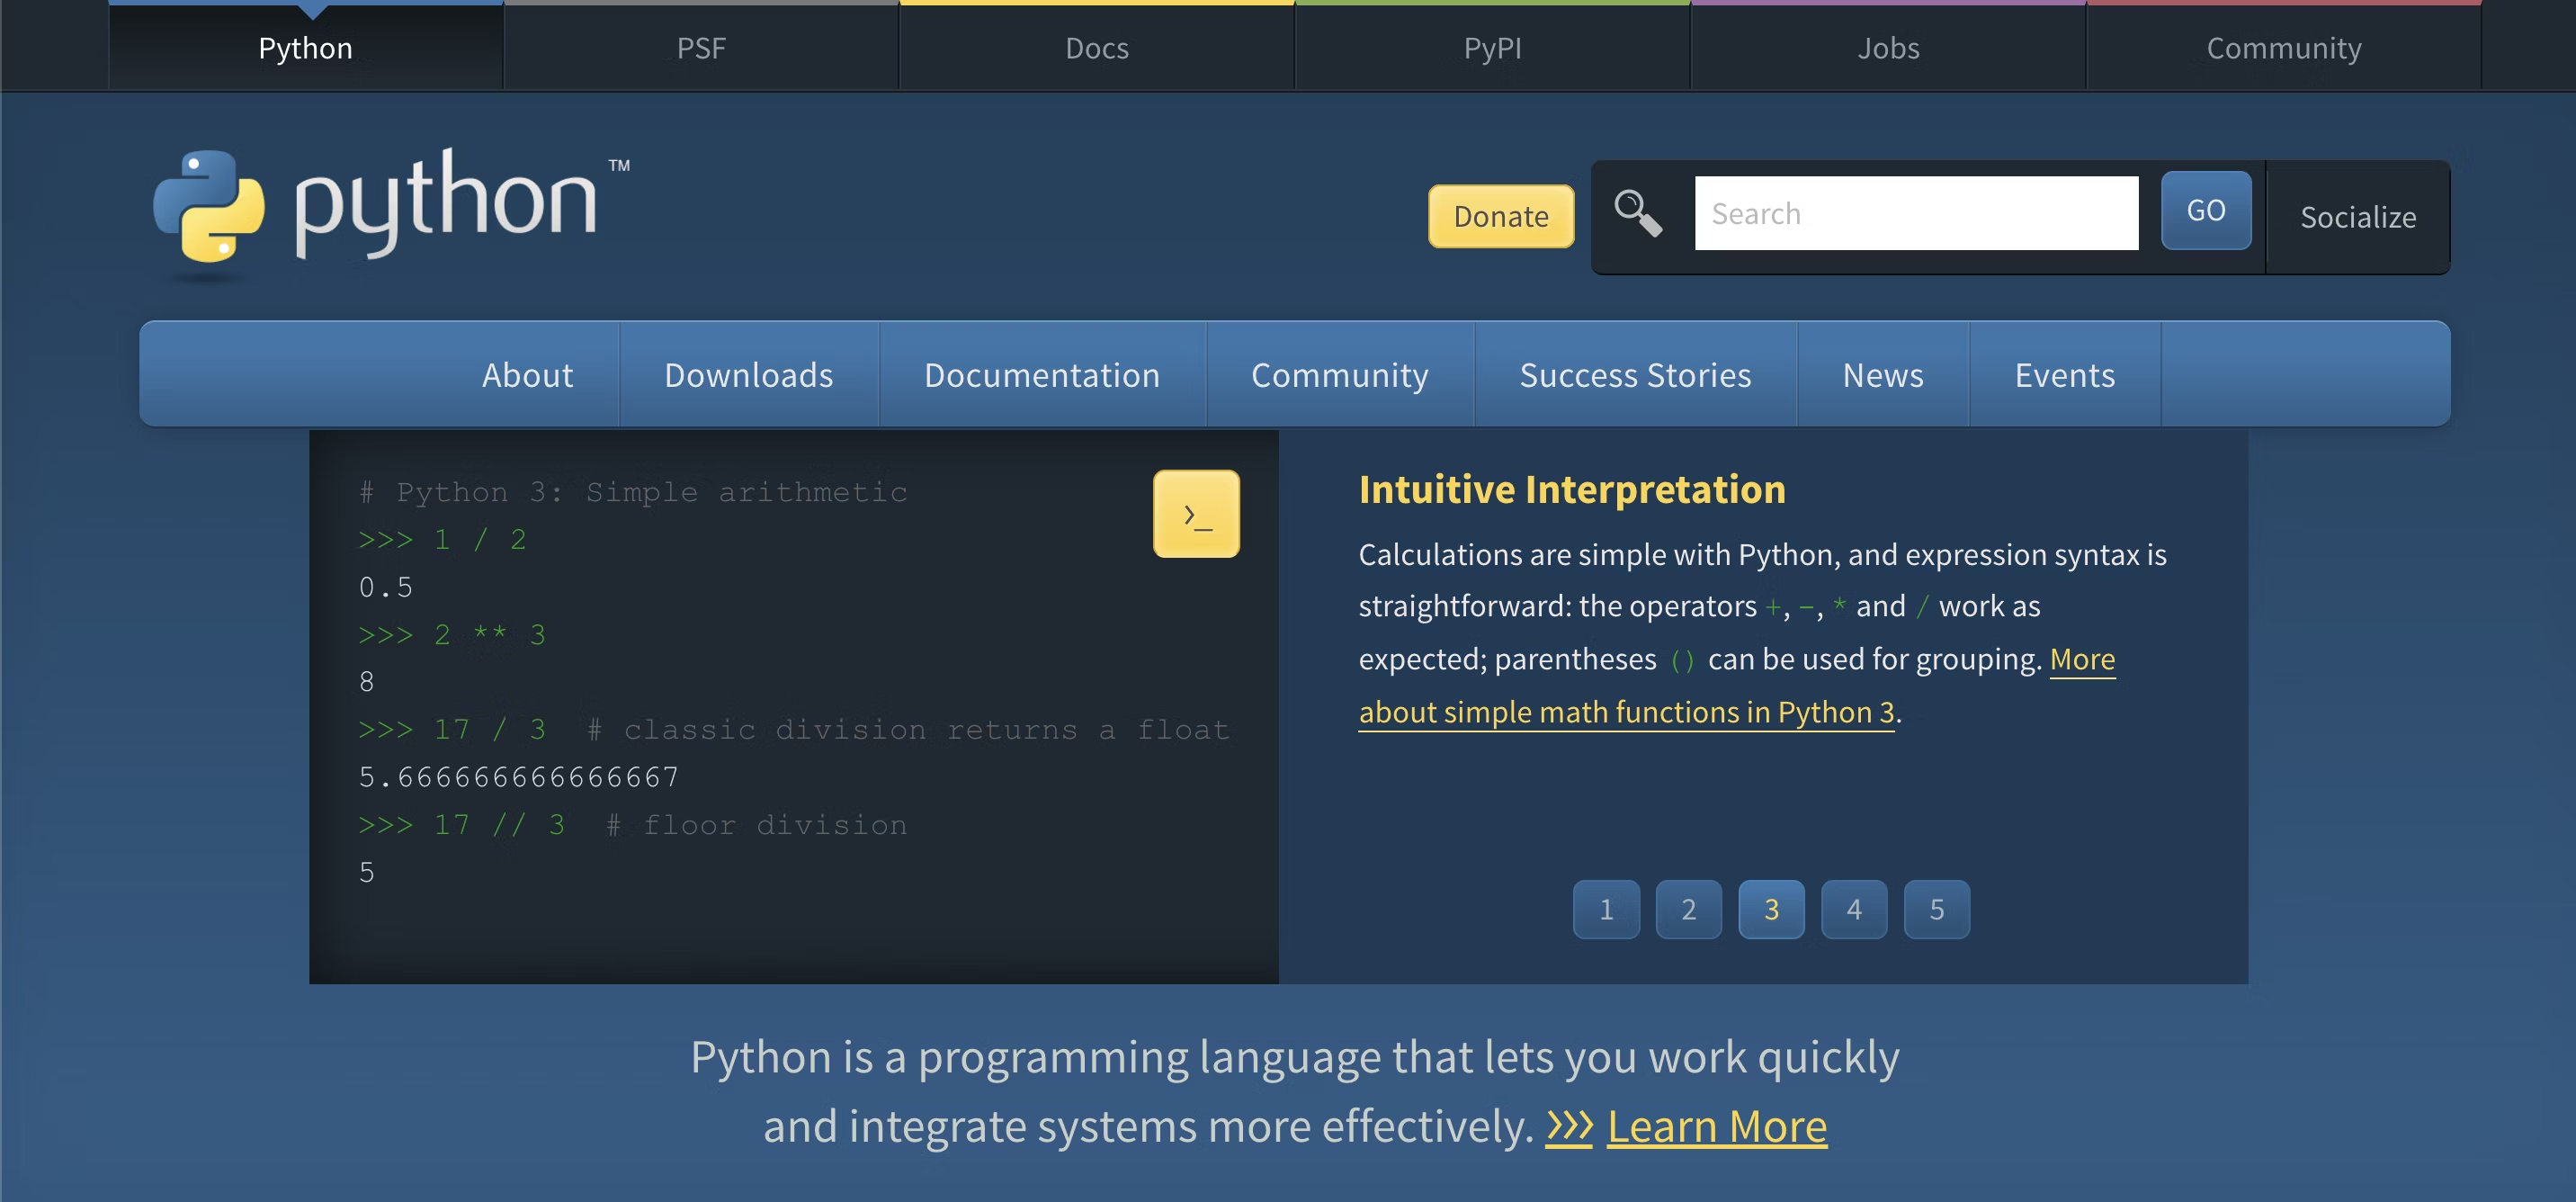
Python is an open-source programming language used for data analysis, machine learning, and automation. Its straightforward syntax and wide range of libraries make it popular for tasks such as data cleaning, visualization, and building machine learning models. Python’s flexibility allows it to support a variety of data-related tasks, from basic analysis to complex algorithm development.
Core features:
Data manipulation with Pandas and NumPy: Pandas and NumPy offer tools for cleaning, transforming, and analyzing data. DataFrames allow for efficient handling of large datasets.
Machine learning: Libraries like Scikit-learn, TensorFlow, and PyTorch support the development and training of machine learning models for tasks like classification, clustering, and regression.
Automation and scripting: Python automates tasks such as ETL processes, helping to streamline workflows and save time.
Pros:
Open-source, with a large community and a wide range of libraries.
Flexible for data manipulation, visualization, and machine learning tasks.
Scalable, capable of handling large datasets and complex computations.
Cons:
Requires programming knowledge, which may limit accessibility for beginners.
Slower performance compared to compiled tools for very large data processing tasks.
SQL (Structured Query Language) is used to query and manage data in relational databases. It is essential for retrieving, analyzing, and manipulating structured datasets. SQL is commonly used in building data pipelines, integrating with BI tools, and generating reports for business analysis.
Core features:
Data querying and filtering: Users can perform precise queries on structured data with SQL, including filtering, sorting, and aggregating for specific analyses.
Data joins and relationships: SQL allows combining data across multiple tables through joins, creating a unified view from different sources.
Data integrity and validation: By enforcing constraints, SQL ensures data remains accurate, consistent, and reliable for reporting and analytics.
Pros
Essential tool for querying structured databases efficiently.
Optimized for large datasets with reliable performance.
Integrates seamlessly with most BI tools and data warehouses.
Cons
Requires knowledge of SQL syntax, which can be a barrier for beginners.
Limited functionality for visualization without additional tools.
Microsoft Excel is a spreadsheet tool used for organizing, analyzing, and reporting data. It handles tasks like financial reporting, data entry, and calculations through features such as formulas, pivot tables, and charts. While it is effective for small-scale tasks, it has limitations when working with large datasets or performing complex data analysis.
Core features:
Data entry and formatting: Excel allows users to input and organize text, numbers, and dates while applying formatting options like font styles, colors, and borders to improve clarity.
What-if scenarios: Tools like Scenario Manager and Goal Seek enable users to analyze different outcomes by adjusting inputs. This is useful for financial modeling and decision-making.
Collaboration and sharing: Multiple users can edit a document simultaneously when stored on cloud platforms like OneDrive or SharePoint. Features like change tracking and comments support real-time collaboration.
Pros
Familiar platform that most users are comfortable with, ensuring easy adoption.
Strong data manipulation and analysis tools, such as functions, formulas, and pivot tables.
Handles diverse data types with extensive customization options through formatting and advanced features.
Cons
Performance issues or crashes when working with large datasets.
Complex formulas and references can increase the risk of errors in large or detailed spreadsheets.
Features to look for in data analytics software
1. Ease of use
The best data analytics software shouldn’t feel like you need a manual to get started. A clean, intuitive interface and tools like natural language search make it easy for anyone, whether they’re a data expert or not, to find insights quickly. The easier it is to use, the faster your team can get value from it.
2. Scalability and flexibility
As your business grows, your data analytics software needs to keep up. It should handle increasing amounts of data and more complex analyses without slowing down. Flexibility is just as important. Whether you’re automating weekly reports to save time or running advanced analytics, the software should adapt to your needs seamlessly.
3. Real-time data processing
Decisions are only as good as the data behind them. That’s why real-time processing is a must. It allows you to analyze up-to-the-minute information, helping you react quickly. For example, you can adjust a marketing campaign in real-time or catch a sudden drop in sales before it turns into a bigger issue.
4. Integration with other tools and platforms
Juggling multiple tools to get a clear picture is inefficient. Your analytics software should connect easily to other platforms you already use, like your CRM, cloud storage, or finance tools. This keeps your data centralized and allows you to pull insights without constantly switching between systems.
Benefits of using data analytics software
Data analytics software isn't just for crunching numbers—it's a powerful tool that reshapes how businesses operate, make decisions, and improve processes. From identifying hidden trends to streamlining workflows, the benefits are clear and impactful.
1. Improves decision-making process
When you have real-time, accurate data at your fingertips, you can make smarter decisions. Take a retailer, for example, who can use analytics to spot struggling stores and reallocate resources. In healthcare, predictive tools help anticipate patient needs, so care can be tailored accordingly, leading to better outcomes.
2. Identifies patterns and trends in data
By looking closely at the data, you can spot trends that might not be obvious at first. E-commerce businesses often track purchasing behavior to predict product demand. These patterns help adjust inventory and marketing efforts to align with customer expectations.
3. Increases efficiency and productivity
With automation, your team can skip the tedious data crunching and focus on what matters most. For example, finance teams can automate their monthly reports, freeing up time for more strategic work. In manufacturing, real-time data can highlight inefficiencies on the production line, helping teams act quickly and keep things running smoothly.
4. Reduces costs and risks
When you have the right insights, you can avoid unnecessary expenses and minimize risks. For example, using analytics to track your supply chain can help you spot potential disruptions before they cause trouble. Similarly, fraud detection tools can monitor transactions in real-time to prevent financial losses.
How to choose the right data analytics software for your business?
1. Assess business needs
Choosing the right data analytics software starts with understanding your business needs. What problems are you trying to solve? For instance, if you're a small team needing basic reporting, a simpler tool like Excel might suffice. But if you need in-depth, AI-powered insights for large datasets, you might lean toward a data analytics solution that knows your requirements and helps you find the right fit, avoiding overspending on unnecessary features.
2. Work within budget constraints
Budget plays a key role in selecting the right software. You don’t want to overspend on a tool with features you won’t use. Some tools have a one-time purchase fee, while others work on a subscription model with tiered pricing based on the number of users or features. Solutions like ThoughtSpot offer scalable pricing to fit various business sizes. Make sure the tool aligns with both your needs and budget.
3. Evaluate user-friendliness
User-friendliness can make or break a tool’s effectiveness. Look for software that your team can easily learn and use. To get a better sense, read user reviews, watch product demos, and, if available, request screenshots or short videos of the interface. Some data analytics platforms also offer comprehensive documentation or community forums where you can see real users asking questions and providing feedback on ease of use.
4. Make use of trial periods or demos
Many data analytics software solutions offer trial periods or demos to help you evaluate their features before committing. This allows you to test the software in real-world conditions and determine if it’s the right fit. ThoughtSpot, for example, offers a 14-day free trial so you can experience how its AI-driven insights and user-friendly interface work in your organization. Taking advantage of these trials ensures that you make a confident, informed decision.
Power your business with data analytics today
From basic tools to advanced data analytics platforms, we’ve explored options that cater to different business requirements. Each offers unique features to help you make better decisions. If you’re looking for a seamless experience that brings AI-driven insights straight to your fingertips, ThoughtSpot is your solution.
Discover how ThoughtSpot can elevate your business–sign up for a free trial.


