


Keeping track of your sales data and pinpointing which metrics truly matter can be overwhelming. The right key performance indicators (KPIs) can help you monitor progress and ensure your team’s success. But with so many metrics and data points to track, how can you know where to start?
To streamline this process, we've curated a comprehensive list of the sales metrics and KPIs top sales teams are tracking. Whether you're a seasoned sales executive or a growing sales rep, mastering these metrics will help you benchmark performance, paving the way for strategic decision-making and sustained growth.
Table of contents:
Sales KPIs are measurable values that indicate how effectively a company is achieving its sales objectives and goals. These sales metrics help evaluate the performance of sales teams, departments, or individuals, providing insights into various aspects of the sales process. While they vary depending on the organization's goals, industry, and specific objectives, the goal remains the same—helping businesses assess their performance and identify areas for improvement in the sales process.
Sales metrics and KPIs are often displayed and tracked through a sales dashboard. This visual representation empowers sales managers and stakeholders to monitor performance, identify trends, and make data-driven decisions to increase productivity.
Like other business KPIs, sales KPIs help keep your team accountable and moving in the right direction. Specifically, they can improve the way you:
Measure success: Sales KPIs provide a clear and measurable way to assess your sales efforts. They enable you to track progress toward sales goals, allowing you to understand whether you are on track to achieve your revenue targets.
Identify performance trends: By monitoring sales metrics and KPIs over time, you can identify patterns and trends in sales performance. This can help you understand what strategies are working well (e.g. what accounts or personas to target) and where improvements may be needed.
Focus on key areas: By highlighting key areas such as conversion rates, average deal size, or customer acquisition cost, sales KPIs can help you allocate resources more effectively and make informed decisions about where to invest.
Diagnose team issues: When sales performance falls short of expectations, your sales metrics can help pinpoint the root causes of the problem. By following the “AIR” concept, you can see leading indicators of success or problem areas, allowing you to pivot in time to act. This allows you to identify bottlenecks, inefficiencies, or opportunities for improvement so you can take corrective action before they throw off your whole quarter.
Create alignment with strategic business objectives: Setting KPIs that align with strategic business objectives and goals is one of the smartest ways to measure your sales performance. By tracking these KPIs, you can ensure that your efforts are in lockstep with overall company objectives.
Motivate sellers: Sales KPIs can also help you hold individual sellers or regional teams accountable for their performance. Clear targets and regular monitoring of KPIs can motivate sales professionals to strive for excellence and achieve their goals.
To keep it simple, I like to organize these metrics into the AIR structure: Activities, Indicators, and Results. To look only at results is shortsighted, as it does not leave room for steering action early enough to make an impact before it’s too late to adjust and respond.
Activity metrics concentrate on quantifying the actions taken by sales representatives, including automated outbound calls made, emails sent, meetings scheduled, and time spent on prospecting. These metrics provide insights into the efforts of the sales team and their engagement with prospects and customers.
1. Monthly calls (or emails) per sales rep
Measuring the number of calls (or emails) each sales rep is making every month provides insight into overall team engagement and activity. When reps are highly active, there is a greater potential for generating leads and closing deals. However, you must also consider the quality of interactions alongside quantity to ensure effectiveness.
One way to do this is by leveraging technology, such as an outbound dialer, using cold email tools to streamline outreach processes, allow sellers to automate touchpoints, and allow them to spend more time personalizing their communication with hot leads.
2. New business meetings
The new business meetings sales KPI measures the number of meetings arranged by the sales team within a specific timeframe, focusing on efforts to generate leads and create opportunities with potential clients. By tracking the number of meetings scheduled, you can assess the effectiveness of your lead-generation efforts and the ability of the sales team to create opportunities for engagement with potential clients.
To improve this KPI, identify your ideal customer profile and develop targeted outreach campaigns to reach prospects who fit that profile. If your potential clients are primarily on LinkedIn, consider personalizing your messaging to improve engagement. This will help you craft messages that resonate with your audience, increasing the chances of building meaningful connections. Incentivize prospects to schedule meetings by offering exclusive promotions, discounts, or access to valuable resources. Create a sense of urgency or scarcity to motivate prospects to take action and schedule a meeting.
Indicators are metrics that provide insight into the effectiveness and efficiency of sales activities. They help sales managers assess the health of the sales pipeline and identify areas for improvement.
3. Sales opportunities
Sales opportunities refer to potential sales deals or prospects that have shown interest in purchasing a product or service from your company. These prospects have progressed through the initial stages of the sales process and have been identified as qualified leads with a genuine potential to convert into customers.
By understanding the characteristics of successful sales opportunities and identifying areas for improvement, you can increase your conversion rates, accelerate sales cycles, and ultimately drive revenue growth.
4. Sales targets
Sales targets serve as a clear benchmark for measuring your sales performance. Targets are typically based on factors such as historical sales data, market trends, business objectives, and growth projections.
They should be both challenging and achievable in order to motivate your sales team to do their best work. To get this process right, a strong relationship between finance (top-down view) and sales operations (bottom-up view) is critical to success.
5. Sales forecasting accuracy
Sales forecasting accuracy is a sales metric that can be used for evaluating the precision and reliability of a company's sales forecasts. This KPI measures how closely the predicted sales figures align with the actual sales results over a specific period. By accurately predicting future sales, businesses can better plan inventory levels, allocate sales and marketing resources, and set realistic revenue targets. To calculate the sales forecasting accuracy, use the formula below:
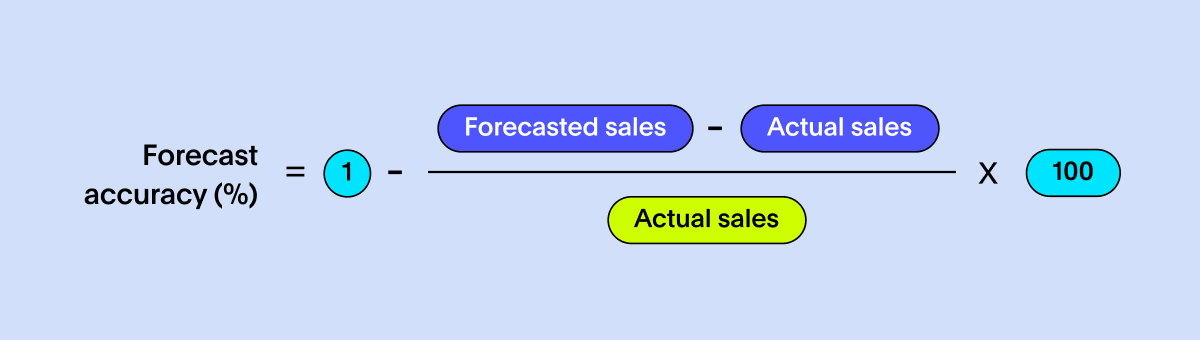
Improving sales forecasting accuracy requires a combination of effective processes, data analysis, and continuous refinement. Continuously evaluate and refine the forecasting methods and models used by your organization. Ensure that the data used for sales forecasting is up-to-date.
Foster collaboration and communication between sales, marketing, finance, and other relevant departments. By sharing insights and aligning strategies, you can improve the accuracy of sales forecasts and enhance decision-making across the organization.
6. Stage conversions
Stage conversions KPIs provide valuable insights into the effectiveness of the sales or marketing funnel in moving prospects through various stages toward conversion or sale. By tracking stage conversions, you can assess the efficiency of your sales, identify areas for improvement, and optimize strategies to enhance overall performance.
Improving stage conversions involves implementing strategies to enhance the effectiveness of each stage of the sales or marketing funnel. This includes developing clear buyer personas to tailor messaging, creating compelling content that addresses prospect needs, optimizing user experience across digital touchpoints, and implementing automated lead nurturing campaigns.
Results are the outcomes of sales efforts, such as closed deals, revenue generated, profit margins, customer satisfaction scores, and market share gains. Tracking results allows sales teams to evaluate their performance against targets and objectives, identify successful strategies, and make data-driven decisions to improve future performance.
7. Monthly sales growth
Monthly sales growth tracks the percentage increase or decrease in sales revenue from one month to the next. This sales metric provides insight into your sales efforts over time, allowing you to assess momentum and identify trends.
To calculate monthly sales growth, follow the formula below:
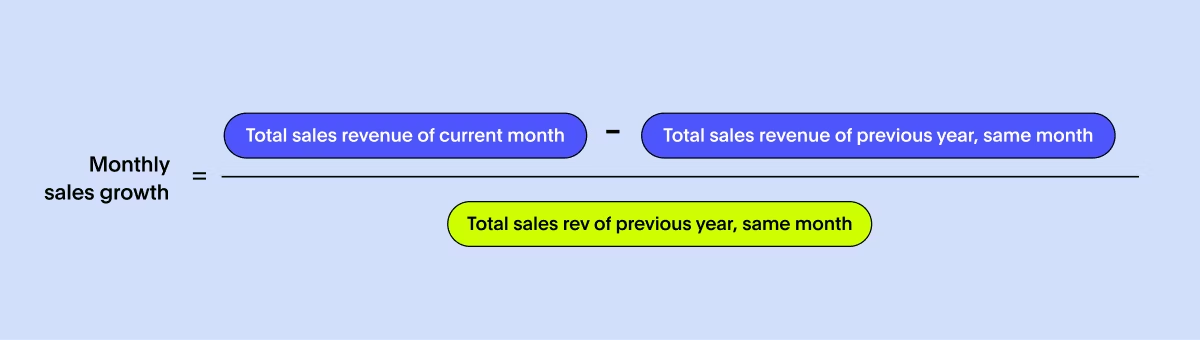
Positive monthly sales growth indicates increasing sales performance, while negative growth suggests a decline. With this information, you can evaluate the impact of external factors such as seasonality or market conditions, and make timely adjustments to meet sales targets.
For example, to improve monthly sales growth, you might focus on optimizing pricing strategies, enhancing your product through the voice of the customer program, or investing in seller training and coaching.
8. Monthly sales bookings
Monthly sales bookings represent the total value of sales contracts signed or confirmed within a given month, including new sales contracts, renewals, or upgrades of existing contracts. To calculate this sales KPI, simply sum up the value of all sales contracts signed or confirmed during the month, including contracts for products, services, subscriptions, or any other offerings provided by your business.
The higher your monthly sales bookings the stronger your overall sales performance and revenue generation. You can improve this KPI by ensuring a strong pipeline, optimizing your lead qualification processes, providing regular sales process training and inspection, offering customer promotions, and nurturing relationships with existing customers to expand deals that have already landed.
9. Opportunity conversion
The opportunity conversion ratio measures how effectively your team converts a qualified opportunity into closed sales. To calculate this KPI, use the formula below:
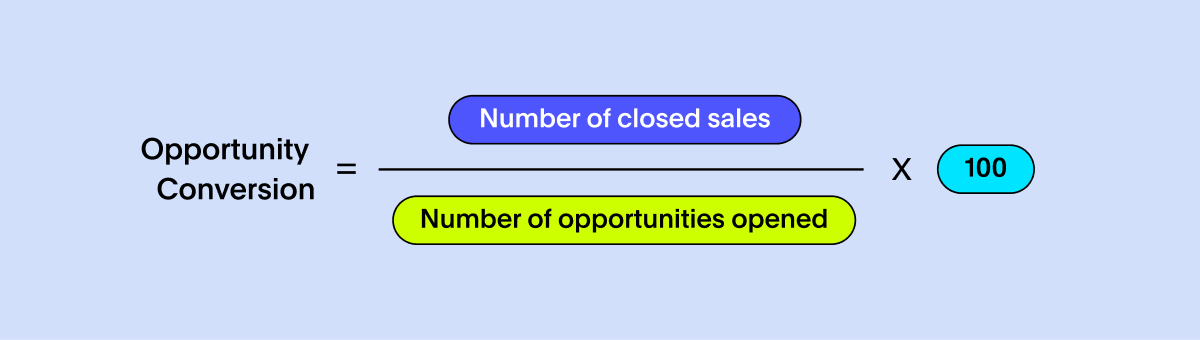
A high conversion ratio signals an efficient sales process, while a lower ratio indicates potential areas for improvement, such as an ineffective sales process, pricing issues, or failure to address customer objections.
To boost the conversion ratio, you should focus on solid opportunity qualification and a strong and clear sales process, building trust through personalized interactions, and emphasizing the value proposition of products or services. Providing tailored activities that address customer needs and offer competitive pricing is essential.
10. Average sales price
Average purchase measures the average monetary value of each sale made by a customer. It helps you understand customer spending habits and the overall value of their transactions. To calculate this sales metric, use the formula below:
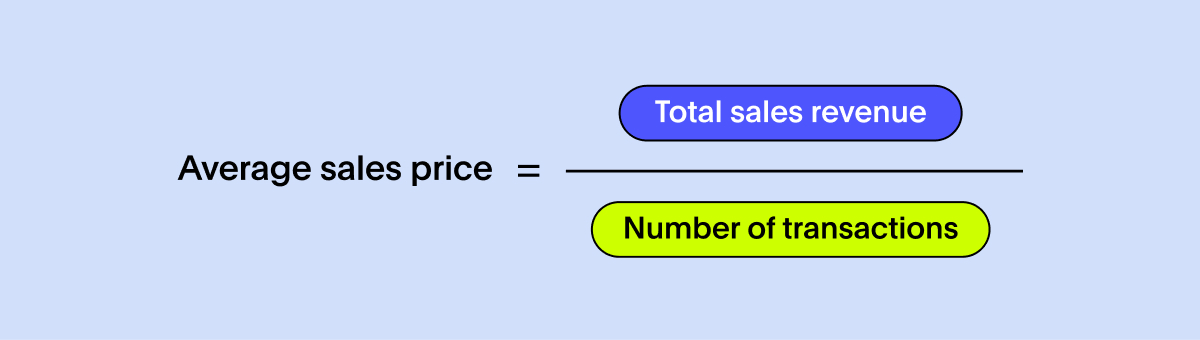
A higher ASP indicates that customers are finding the maximum value in your solutions and that your mix of enterprise vs. commercial focus is healthy and strong.
To improve average purchase value, you can focus on supporting the enterprise selling motion, ensuring the sales team is leveraging strong value selling practices, offering value-added products or services, bundling products together to encourage larger purchases, and optimizing the customer experience to encourage repeat purchases.
11. Bookings per rep (Productivity)
Bookings per representative evaluates the productivity and effectiveness of individual sales representatives within a sales team.
To improve sales per rep, you can provide ongoing sales training and professional development opportunities, establish clear sales targets and incentives to motivate sales reps, assign territories or accounts strategically based on individual strengths, and leverage technology tools such as customer relationship management (CRM) systems to streamline sales processes and enhance efficiency.
12. Product and opportunity type mix
Product and opportunity type mix evaluates how well individual products or product categories within your company’s portfolio are selling. To calculate product performance, use the formula below:
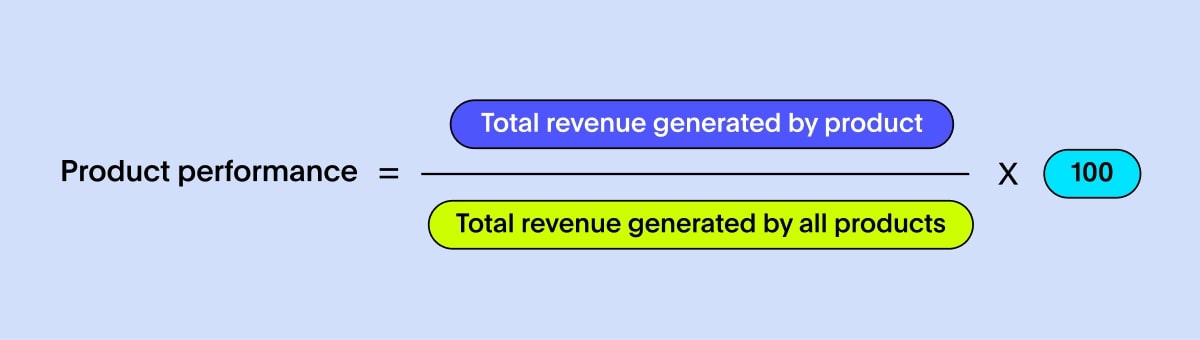
Investing in product development, implementing targeted marketing campaigns, optimizing inventory management, adjusting pricing strategies, expanding distribution channels, and improving the overall customer experience are all great strategies for improving this KPI.
13. Lead-to-sale conversion rate
Lead-to-sale conversion rate measures how effectively you’re converting leads into paying customers. This sales metric is vital for evaluating the overall health of your marketing engine, and how your marketing efforts are converting to pipeline and bookings. To calculate your lead-to-sale conversion rate, use the formula below:
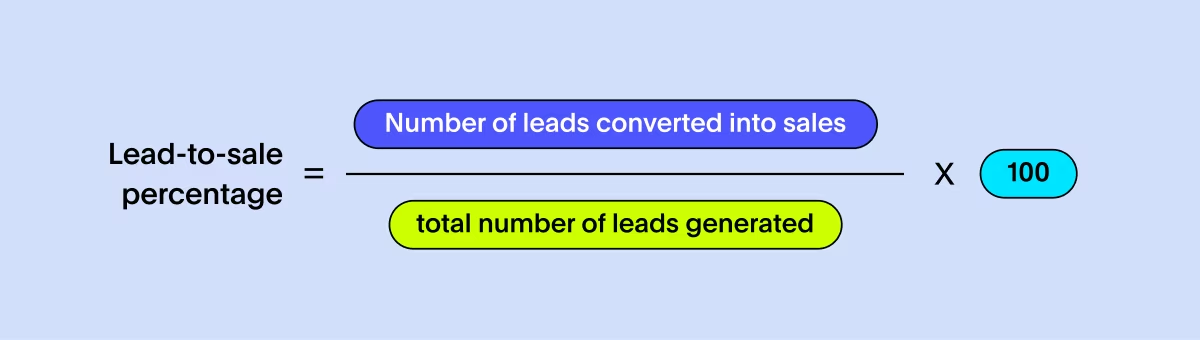
If you find that the percentage is low, focus on enhancing your lead qualification criteria and lead scoring by further developing your understanding of your target audience's pain points and buying behaviors. You can also try implementing a lead nurturing campaign to maintain engagement throughout the sales journey and optimizing lead handoff processes to minimize friction throughout your sales cycle.
14. Average sales cycle length
Average sales cycle length provides insight into the efficiency and effectiveness of the sales process, by helping you understand the typical duration of your sales cycles. To calculate the average sales cycle length, use the formula below:
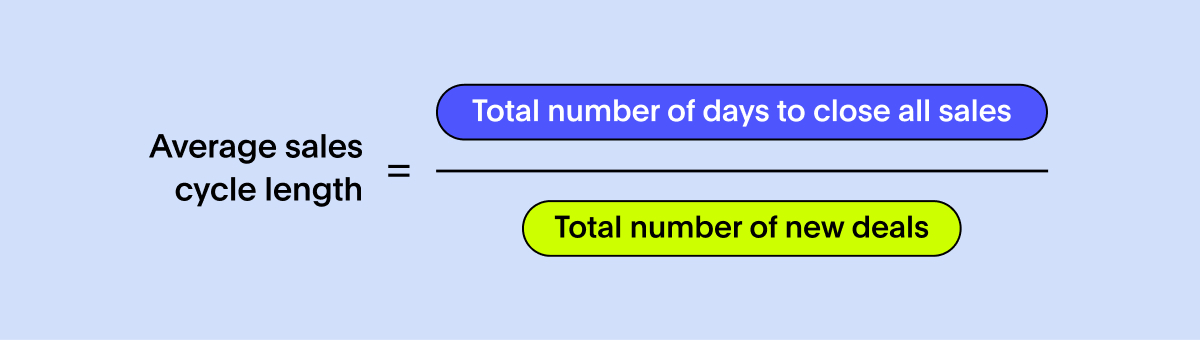
To improve this KPI, you can try to refine lead qualification. For example, implement a precise scoring system considering factors like prospect readiness, budget availability, and alignment with your ideal customer profile. Prioritize high-quality leads with a greater chance of conversion.
15. Average cost per lead
Average cost per lead (CPL) evaluates the effectiveness of your marketing campaigns by highlighting how much money you’re spending on new leads. To calculate this sales KPI, use the formula below:
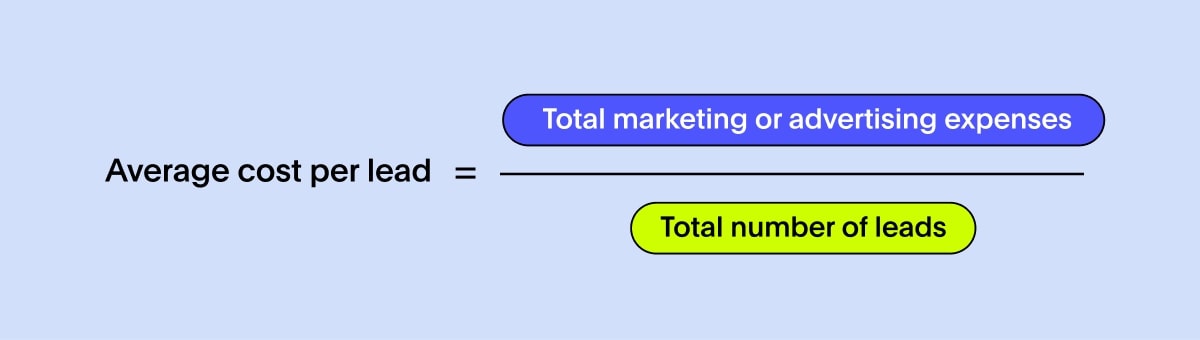
To improve average cost per lead, focus on targeting your marketing efforts toward high-quality, high-potential leads that are likely to convert into customers.
16. Annual contract value (ACV)
Annual contract value (ACV) is a metric used in subscription-based or recurring revenue business models to measure the total contracted value of a customer's subscription or contract over a one-year period. To calculate the annual contract value, use the formula below:

You can improve ACV by providing discounts for longer contract durations and by investing in customer success initiatives so that your buyers continue to get value from your products and services long after they sign on the dotted line.
As your sales team strives to meet evolving customer demands and drive revenue growth, you’ll need access to real-time, actionable insights to make informed decisions.
ThoughtSpot is an AI-Powered Analytics platform that transforms the way your sales teams access, analyze, and act on data. Liveboards provide real-time updates and insights, ensuring that your team has access to the most current information at all times. You can monitor key metrics as they change and react quickly to shifts in market conditions, customer behavior, or sales performance.
Here are several ways ThoughtSpot quickly delivers value:
SpotIQ delivers AI-generated insights fast.
Verified Liveboards ensure data governance and maintain quality standards across the organization.
Monitor key metrics that matter to your business with ease.
ThoughtSpot mobile enables real-time data tracking on mobile devices, allowing you to make data-driven decisions anywhere and anytime.
While the benefits of sales Liveboards are clear, their true potential becomes even more evident when we look at a real-world example:
Frontify, a cloud software platform provider, faced a challenge when their three-person data team had to pull data from business applications into a MySQL database using custom Python scripts, and then analyze it in Tableau. Seeking a solution for quicker access to actionable data, they turned to ThoughtSpot's self-service BI platform.
With ThoughtSpot’s intuitive interface, business users created their own Liveboards—within minutes, without any back and forth with analysts. Here’s what Stephanie McSwiney, former VP of Sales has to say about ThoughtSpot.
“I never thought I could get excited by data but it’s amazing what you can do with ThoughtSpot.”
In today's tough business environment, sellers have their work cut out for them. By keeping a close eye on your most important KPIs, you can make sure your team stays ahead of the competition and continues growing in the right direction.
Elevate your bottom line with ThoughtSpot's real-time AI-powered insights. Schedule your demo today to unlock your team's full potential!


