


Imagine you are a data analyst without an analytics engineer or data engineer on your team. You have access to the raw data and a BI tool. You are expected to transform the raw data and power data visualizations all from within the BI tool. This requires you to repeatedly join the same datasets together and perform identical key calculations. Your dashboards are now very slow, a lot of your time is being wasted writing the same code multiple times, and mistakes are about to be made.
This is where data modeling comes in. Data modeling is the solution to this exact problem. It’s a large reason why analytics engineers exist! Data modeling gives analysts automated, standardized datasets so they can directly query without having to join or transform raw data over and over again. Joins and transformations are already done so that analysts can focus on delivering results quickly and effectively.
What is data modeling?
Data modeling is the process of transforming a business’s data so that it is easily accessible and usable. It is typically the analytics engineer who owns this process. The transformations included in data models can be as simple as column renaming or as complex as window functions.
Why is data modeling important?
Data modeling is important for many different reasons, but the most powerful effect it has is on the quality of your data. It allows company standards to be enforced at the base layer rather than at the last step which is typically data visualization. This ensures data is actually reliable and isn’t different in its key qualities across multiple dashboards or reports. It also allows analysts to focus on capturing the business processes in their code rather than focusing on data cleaning.
Before even touching the BI tool, the data is standardized across all different data sources, leaving little room for error. Now, analysts can focus on creating consistent business KPI definitions across these sources rather than worrying about actual data quality or data cleanliness. This results in less downtime in production and better business decisions that are made using this data.
In addition to providing higher-quality data, data modeling is important because it increases the speed of insights and decreases the time to market for analysts. It improves database performance because the most commonly used datasets are now always available. The datasets generated by these commonly used queries no longer have to be generated each time they are needed but are instead available within the warehouse at all times. Analysts no longer have to spend time running these queries and waiting for them to finish in order to start on their work but rather have instant access to the most important datasets and calculations.
While all data modeling techniques result in the same benefits, they each have their own unique design and purpose. In this article, we will discuss the most popular data modeling technique for analytics purposes: dimensional data modeling.
Start Getting Better Insights
What is dimensional data modeling?
Dimensional data modeling is a method designed by Ralph Kimball for effectively organizing analytics tables within a data warehouse. This method focuses on identifying key business practices and then building out the foundation of these practices before adding additional tables. Dimensional modeling is widely accepted by the analytics community because it allows analytics engineers more design discretion and remains very practical.
Kimball invented this technique specifically to create a single source of truth for a business. Essentially, a company can ingest all of the data needed to perform usual operations into one location and then use this instance for data transformation and eventually data visualization.
Kimball also wanted data to be easy to find, standardized across different tables, and flexible enough to scale as a company grows. Dimensional data modeling creates a system where users know exactly where to look for information based on how data tables are named. Additional tables can easily be added to the system as the company collects more and more information—something that other data modeling techniques are not able to do as easily. Dimensional models organize data into one of two different types of tables, fact or dim, which allows us to do exactly these things.
Types of dimensional data tables
Ralph Kimball’s dimensional data modeling technique classifies data models into two types of tables: fact tables and dimension tables.
Fact tables
Kimball defines facts as measurements and dimensions as context, but I like to think of fact tables as tables produced by different events that occur within a business. This could be different transactions that are created, orders that are placed, or money spent on advertisements by the marketing team. If it’s an action that can occur, it is typically represented as a fact table within the data warehouse.
Here is an example of what an orders fact table may look like:
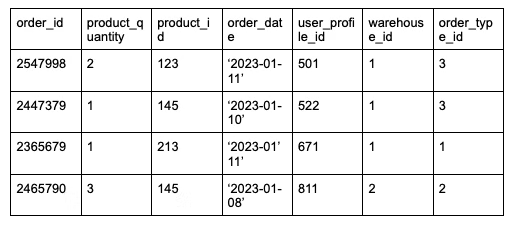
Fact tables contain foreign keys that directly relate to the primary key of a dimension table. This is how the relationship between fact and dimension tables can be found. You’ll typically see multiple foreign keys within one fact table that each relate to different dimension tables.
For example, if we look at product_id, user_profile_id, warehouse_id, and order_type_id in the above example, these are foreign keys that act as primary keys of four different dimension tables. We will review what they might look like in the next section.
It’s important to note that fact tables avoid numerical aggregates, as these are to be calculated in the business intelligence layer. Each row in a fact table represents an individual business event. The data models that produce these tables will avoid calculating a ratio and instead include the two individual columns that would be used to calculate a ratio in the BI layer.
For example, if a business user needed to calculate the burn rate for a certain month, the data analyst would first use a fact model to then calculate this in the BI layer. The fact model would contain the individual costs of the business, but not the ratio itself.
Fact tables that are more granular and can be used to calculate KPIs on various levels.
Dimension Tables
Unlike fact tables which capture business measurement, dimension tables contain descriptive attributes. They are usually wide, flat tables that are also denormalized. They have a single primary key which exists as a foreign key in a fact table.
For example, product_id was a foreign key in the orders fact table but is the primary key of the products dimension table.
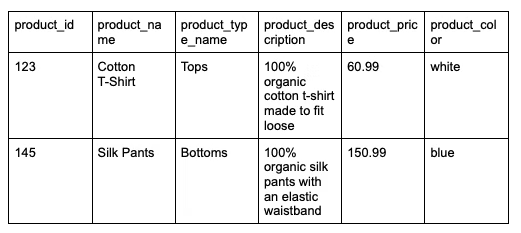
Here, we can see product_id is the primary key of the products table. Dimension tables like this rarely change day-to-day within a business unlike fact tables which are always changing. You can see that dimension tables contain details about a specific aspect of a business, in this case, the products. An analytics engineer would turn to these tables when details like color, size, fabric, or product type are needed in their data model.
With analytics data modeling, you will typically see fact and dimensional tables joined to one another in order to create one big descriptive table. This way, data analysts do not need to join these two types of tables together in the BI tool. Joining fact and dimension tables creates a more holistic dataset that is easier for the analyst to use.
Data modeling tools
There are different data modeling tools that are necessary to create data models within a modern data stack. SQL is the foundation of most data models. dbt is the transformation tool of choice for analytics engineers like myself. And, lastly, a data warehouse is needed in order to store and power these transformations.
SQL
SQL is a language that can’t be escaped. It’s essential for all data professionals to use. Similar to writing reports and one-off queries, SQL anlaytics functions are used to write data models as well. While other data languages can be used, this is what most analytics engineers choose to use.
SQL is the easier way to transform data into how you want it to look. Casting, date functions, window functions, and pivots are commonly used when writing data models. They help you manipulate data from its raw form into a form that is usable by the business.
💡 Relevant read: 12 SQL query optimization techniques to follow
dbt
dbt is the latest and greatest in the data modeling world. It helps you write your SQL data models so that they are modular. This means you are writing DRY code, or code that follows best practices and isn’t repeated throughout the project. This ends up saving the analytics engineer work in the long run by allowing them to reuse pieces of code.
dbt is also helpful because of the complex features it offers like macros, documentation, and testing. Macros allow you to write functions that can be reused throughout your data models to automate different processes, like data cleaning. Built-in tests help you look for null values, check primary keys, and ensure data types are as expected. They allow you to test your work right next to your code!
With dbt, your documentation also sits next to your code. A data model is only as helpful as its documentation is thorough. If you have no idea how the columns in a data model were generated or what they mean, how are you supposed to effectively use the model? dbt makes it easy to document your models and their columns while writing the code, keeping documentation fresh and accurate.
Data warehouse
The data warehouse is where your data models are run and stored. Your dimension and fact tables live in the databases within your data warehouse. This is what allows you to create a single source of truth where all of your raw data and data models within an organization live. Without this tool, dimensional modeling wouldn’t even be possible.
When deciding on a data warehouse, make sure you consider architecture and security. Can you customize databases, tables, and schemas to fit your business analytics use case? How can you keep your models secure so that only the right people have access? I personally love Snowflake because you have the ability to create users and roles with custom permissions.
Power your analytics work
While there are many different types of data models, dimensional modeling is the most popular for advanced analytics in the modern data stack. It consists of fact and dimension tables, each of which serves a different purpose. Fact models represent business processes while dimension models share attributes about these processes.
With these models, data analysts can be confident that the analytics engineer is using them to build scalable, reliable, and standardized data processes. No more joining or standardizing is required in the BI layer. The analyst now has models available to them at all times that can be used to effectively power their analytics work.
Madison Schott is an analytics engineer for Winc, a wine subscription company that makes all its own wines, where she rebuilt its entire modern data stack. She blogs about analytics engineering, data modeling, and data best practices on Medium. She also has her own weekly newsletter on Substack.


