


As a demand marketer, I’ve come to realize that success is not about one singular outcome—like how many leads did this ad campaign drive or how many live attendees on a webinar? But rather, it’s a mix of various, metrics, channels, and programs that move the needle bit by bit to reach your goals.
In my case, success is based on the amount of pipeline created and ACV booked, and my ability to assess success starts and ends with tracking the right marketing key performance indicators (KPIs) and metrics. It's not just about crunching numbers, it's about telling a story based on data.
This guide is a product of years of hands-on experience and insights gained while navigating the ever-shifting landscape of demand and digital marketing. Whether you're steering a startup through its initial growth phase or refining the strategy of an established brand, the metrics and advice here are universally applicable.
Table of contents:
- 15 marketing KPIs and metrics to track
- Customer acquisition cost (CAC)
- Customer lifetime value (CLTV)
- Return on investment (ROI)
- Return on ad spend (ROAS)
- Website traffic
- Conversion rate
- Cost per click (CPC)
- Click-through rate (CTR)
- Engagement rate
- Average engagement time
- Organic search traffic
- Email open rate
- Social media engagement
- Lead conversion rate
- Customer churn rate
- The future of marketing dashboards
- Paving the way for competitive excellence
Customer acquisition cost (CAC) is a critical marketing metric that assesses the total expenses for acquiring a new customer. This includes the costs of marketing, advertising, and sales efforts. You calculate CAC by dividing the total expenditure by the number of new customers acquired within a specific period.
A lower CAC indicates a more cost-effective acquisition, while a higher CAC suggests the need for optimization. Monitoring CAC closely allows refinement of marketing and sales approaches for efficient resource allocation, maximizing returns on customer acquisition investments.

To improve CAC, focus on targeted marketing towards your most promising audiences, optimize advertising channels through efficient testing and resource allocation, and streamline sales processes via team training and CRM tools. Additionally, you should regularly analyze data, conduct A/B testing, and iterate on strategies to adapt to changing markets and customer preferences.
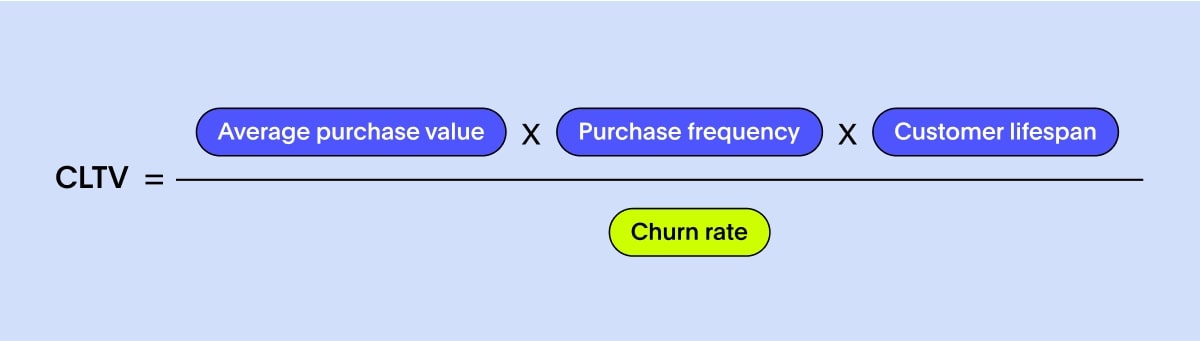
Customer lifetime value (CLTV) is a strategic marketing KPI that provides insights into the total revenue you can expect from a customer over the entire duration of their relationship. This metric goes beyond measuring a customer's value based solely on initial transactions and considers the potential for recurring purchases and long-term loyalty.
The formula offers a nuanced perspective by considering the average purchase value, purchase frequency, average customer lifespan, and discount rate. By assessing CLTV, you can make informed decisions on customer acquisition costs, tailor retention strategies, and optimize marketing investments. A higher CLTV signifies a more valuable and profitable customer, guiding you toward strategies that prioritize long-term customer satisfaction and customer loyalty.
To boost CLTV, prioritize personalized marketing, loyalty programs, effective retention strategies, upselling, subscription models, optimized pricing, proactive customer education, and adaptability to market changes. Regularly revisiting CLTV calculations enables you to adapt to shifts in customer behavior and market dynamics.
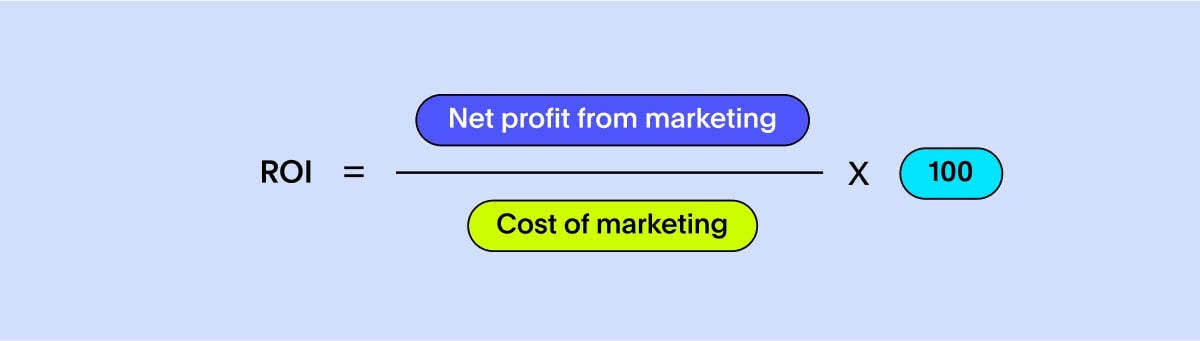
Return on Investment (ROI) measures the profitability of an investment relative to its cost. You can assess the effectiveness of marketing campaigns and channels by integrating marketing analytics into your decision-making processes. The ROI formula involves dividing the net profit from marketing investment by the investment cost and multiplying the result by 100. A positive ROI indicates that marketing efforts generate more revenue than the incurred costs.
To improve this marketing metric, prioritize data-driven decision-making, optimize resource allocation based on insights, and regularly evaluate and emphasize high-performing areas. This iterative approach ensures a strategic and efficient use of resources and contributes to sustained and measurable business success.
Return on ad spend (ROAS) is one of the crucial marketing KPIs for assessing advertising efficacy. ROAS is calculated by determining revenue generated against ad spend. The resulting figure serves as a multiplier, showcasing how each dollar invested in advertising contributes to revenue generation. A higher ROAS denotes that the advertising strategy yields more revenue than the incurred costs, signifying a positive and efficient investment.

To enhance ROAS, consistently refine advertising strategies for efficiency. Regularly analyze and monitor ROAS to make informed decisions, adjust targeting strategies, and elevate overall campaign performance within the dynamic and competitive marketplace.
Website traffic measures the number of visitors to your site. Monitoring website traffic helps assess the effectiveness of your online presence and content marketing strategies. As the total number of visits and unique visitors reflect audience reach and exposure, analyzing pageviews, bounce rates, and traffic sources is crucial for understanding user behavior and optimizing content.

To increase website traffic, focus on tailoring strategies and optimizing user experiences. Incorporating website traffic metrics into your marketing dashboard is essential for staying ahead in the dynamic digital landscape.
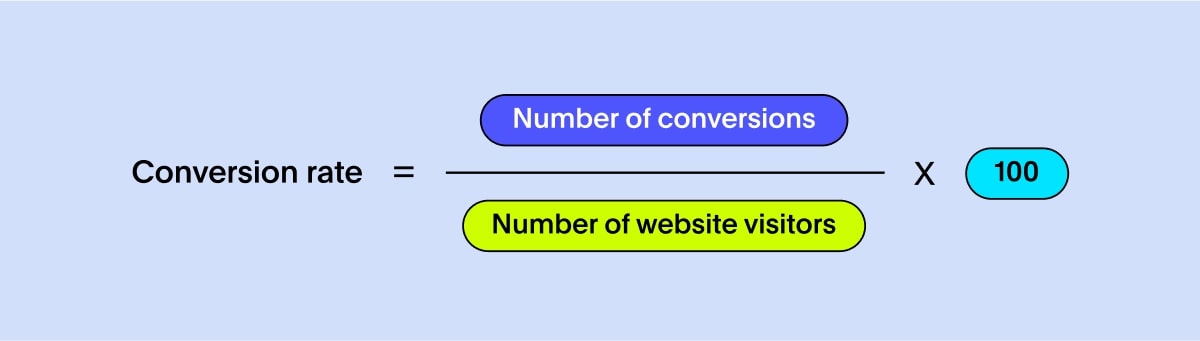
The conversion rate is the percentage of website visitors performing a desired action, such as making a purchase or filling out a form. This critical marketing metric helps you evaluate the effectiveness of your website layout and performance, offering insights into user behavior and overall on-page experience.
A high conversion rate suggests that your website is successful at convincing visitors to complete the desired action. Meanwhile, a low conversion rate may indicate areas for improvement in elements like landing page design, call-to-action clarity, and overall user trust. Regular analysis and optimization of factors affecting conversion rates can enhance user experiences, maximize return on investment, and help achieve your marketing goals.
Cost per click (CPC) is a marketing KPI that calculates the cost incurred for each user click on an ad. You’ll calculate this metric by dividing the total campaign cost by the number of clicks, offering insights into the efficiency of paid advertising efforts. CPC is crucial for evaluating the return on investment per click.

Comparing CPC across campaigns or platforms helps identify cost-effective channels and allows for adjustments in bid strategies. Influencing factors include keyword competition, ad relevance, bid amounts, and the quality of ad creatives. While CPC is valuable for budget planning and campaign optimization, challenges like high competition and bot traffic require vigilant monitoring and preventive measures.
Click-through rate (CTR) measures the effectiveness and engagement level of digital campaign elements—like ads or emails. You can calculate this marketing metric by dividing the number of clicks by the number of impressions and multiplying by 100. A high CTR indicates relevance and appeal to the target audience.

Continuous optimization—through A/B testing, segmentation, and adapting to industry trends—is crucial for improving CTR and enhancing digital marketing success. Influencing factors include ad copy, design, target audience understanding, and ad placement.
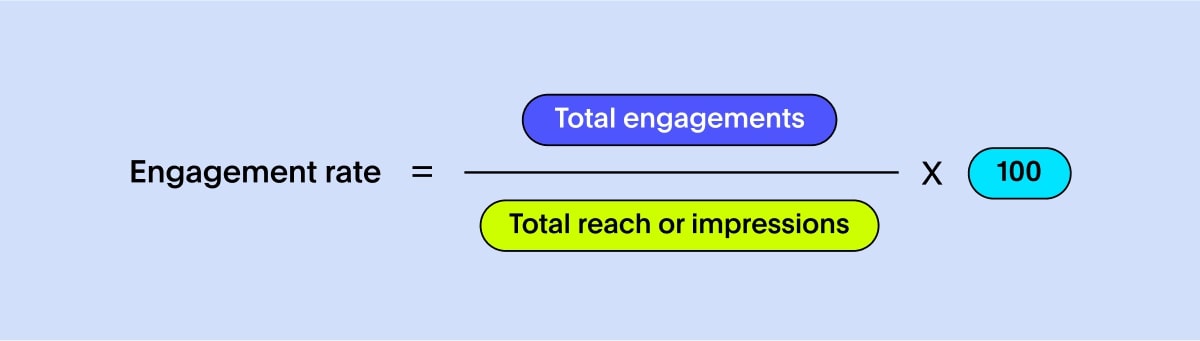
Engagement rate is a versatile marketing KPI that measures user interaction like comments, likes, shares, and clicks. You’ll calculate the engagement rate by dividing total engagements by reach or impressions, and multiply that by 100 to get your percentage. The engagement rate acts as a feedback mechanism, offering insights into audience preferences and concerns. In the competitive digital landscape, this dynamic metric plays a pivotal role in shaping content strategies and boosting brand advocacy.

A high engagement rate signifies a strong connection, relevance, and community-building. Analyze performance metrics regularly to understand what resonates with your audience, and adjust your strategy accordingly. Additionally, continue creating compelling and relevant content that encourages active participation through likes, comments, and shares.
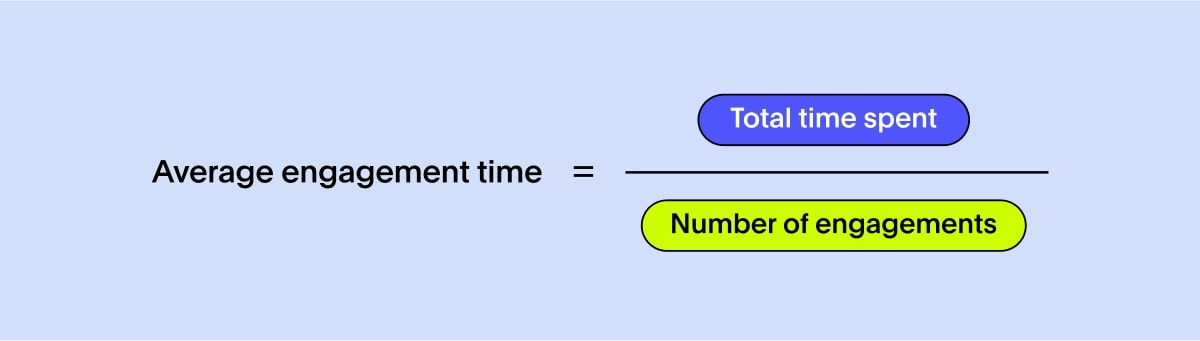
Average engagement time is a key metric that reflects the time users spend interacting with your content. A longer average engagement time indicates that the content is compelling and relevant, showcasing its effectiveness. To calculate average engagement time, divide the total time users spend on a piece of content by the number of engagements. This metric is crucial for understanding user interest, optimizing content strategies, and enhancing overall website or platform performance.
Strategies to improve this marketing metric include creating compelling content, incorporating interactive elements, and optimizing page load speeds. While a longer average engagement time is generally positive, it's essential to interpret the metric in the context of broader business goals and industry benchmarks. Consistent analysis and optimization of average engagement time can foster positive user experiences and improve search engine visibility.
Organic search traffic represents the number of visitors who reach your website through search results. This source of potential visitors is cost-effective, as it doesn't involve advertising expenses. Organic search traffic is a key metric for assessing SEO success and provides insights into user behavior and content optimization opportunities.
This metric is measured through metrics such as organic sessions, keywords, and traffic sources. Strategies to enhance organic search traffic involve keyword optimization, content quality improvement, on-page SEO, link building, and mobile optimization. Reviewing SEO case studies can provide useful insights into practical strategies that drive meaningful organic growth.

While invaluable for long-term sustainability, it requires patience as SEO efforts take time to manifest results. Continuous analysis of organic search metrics is crucial for adapting to evolving search engine algorithms and optimizing digital marketing strategies for sustained online visibility.
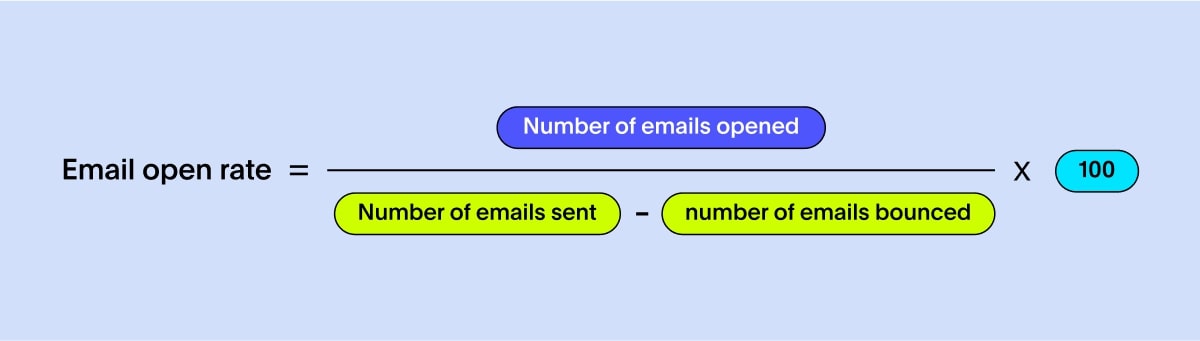
Email open rate measures the percentage of recipients who open an email after successful email deliverability. By visualizing this metric on an email marketing dashboard, you can evaluate the effectiveness of your email marketing campaigns and the appeal of your subject lines.
A high open rate indicates that your audience finds your emails engaging and relevant, reflecting positive audience engagement and receptiveness to your brand's communication. The email open rate is calculated by dividing the number of emails opened by the number of emails delivered (excluding bounces). It is a key indicator of campaign success. Using a SaaS email marketing software helps you track open rates in real-time and optimize campaigns with data-driven insights.
To improve this marketing KPI, marketers often focus on crafting compelling subject lines, personalizing content, experimenting with optimal timing, and leveraging segmentation and targeting strategies. While email open rate offers valuable insights, it is important to assess complementary metrics, like click-through rate and conversions, to gain a holistic understanding of your email campaign performance.
With a staggering 5.04 billion users worldwide, social media has become an omnipresent force, shaping the way individuals connect, share, and engage in the digital era. Social media engagement includes likes, comments, shares, and clicks on your social media posts. Using an Instagram engagement rate calculator can provide precise insights into content performance. It is often measured using the social media engagement rate formula. The formula varies slightly depending on the platform. Social media engagement focuses on user interactions, engagement rate provides a more calculated metric for evaluating content effectiveness in relation to its reach or impressions.
A high level of social media engagement indicates the effectiveness of the content strategy and also underscores the strength of the community and brand loyalty. This engagement goes beyond mere metrics, influencing algorithms to favor content with higher engagement, therefore increasing visibility.
Successful strategies to boost social media engagement involve creating compelling content, maintaining a consistent posting schedule, and nurturing interactivity. Additionally, fostering genuine connections with your audience, leveraging multimedia elements such as images and videos, and staying up-to-date with the current trends can further enhance your social media presence and engagement levels.
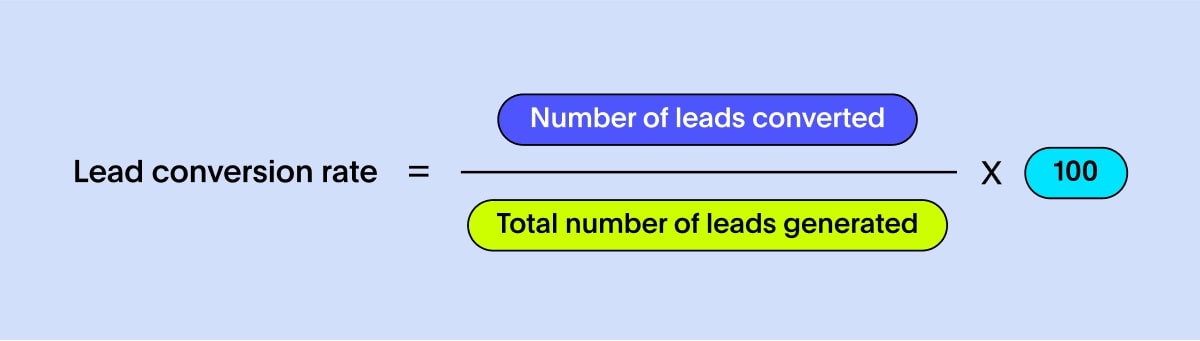
Lead conversion rate measures the percentage of leads that convert into customers. This marketing metric helps in evaluating the effectiveness of your lead generation and nurturing efforts. Lead conversion rate is calculated by dividing the number of leads converted into customers by the total number of leads generated. A high lead conversion rate signifies a successful sales process, providing valuable feedback on the quality of leads generated and the return on investment for marketing campaigns.
Strategies to enhance lead conversion rates involve targeted marketing, clear call-to-action strategies, effective lead nurturing, and seamless collaboration between sales and marketing teams. Additionally, optimizing website user experience and regularly analyzing data to identify areas for improvement can further contribute to increased lead conversion rates.
Customer churn rate measures the percentage of customers who stop using your product or service over a specific period. This metric is not merely a numerical representation, but a direct reflection of customer satisfaction, perceived value, and the overall health of a business.
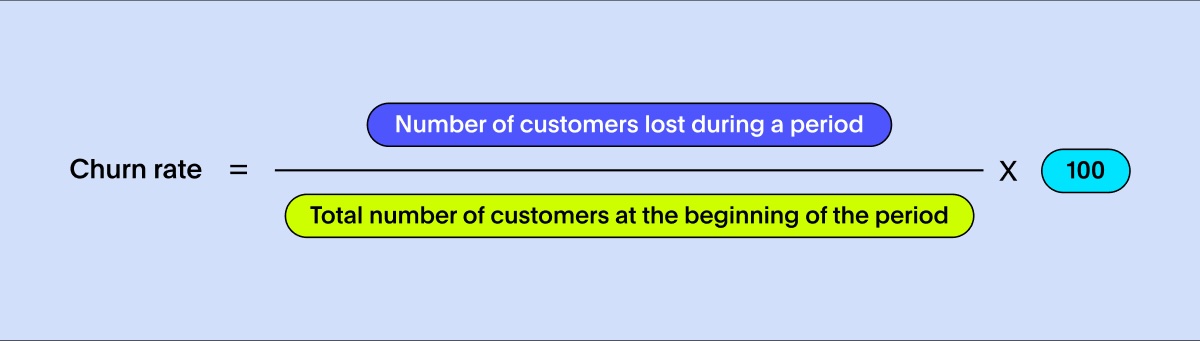
The customer churn rate is calculated by dividing the number of customers lost during a specific period by the total number of customers at the beginning of that period. It serves as a strategic focus for customer relationship management. High churn rates can significantly impact revenue, prompting companies to reassess their offerings and customer support.
By conducting a customer churn analysis, you can identify trends and factors leading to customer attrition, enabling proactive measures for customer retention. To combat churn, businesses employ various strategies, including personalized customer support, value-added services, targeted retention campaigns, and continuous monitoring of customer feedback for ongoing improvement.
As technology advances, the future of marketing dashboards is set to be even more advanced. Artificial intelligence and machine learning will play big roles in giving us real-time insights and predictions. But regular dashboards and Excel sheet analysis struggle to keep up with today’s fast-changing business needs.
To truly empower your team, it’s essential to provide them with real-time, interactive data visualizations. This is where the Liveboard comes into play.
ThoughtSpot offers dynamic and interactive visualizations that deliver real-time insights precisely when and where they are needed, enabling you to make informed, data-backed decisions.
Here are several ways ThoughtSpot Liveboards quickly deliver value:
SpotIQ uses AI-assisted analytics to unveil hidden insights.
Verified Liveboards establish data governance and uphold quality standards throughout the organization.
Connectors effortlessly transfer data to your business team when required, eliminating the need for building and maintaining integrations.
Data on-the-go enables real-time data tracking on mobile devices, allowing you to make data-driven decisions anywhere and anytime.
Staying competitive requires a deep understanding of performance metrics. A well-designed marketing dashboard incorporating key KPIs and metrics guides marketers toward informed decision-making. To experience these benefits for yourself, you need a modern cutting-edge solution—a solution like ThoughtSpot.
Unlock insights effortlessly! Schedule a free live demo now, and pave the way for your data-driven success.


