

Pipeline management is vital to the go-to-market strategy of any B2B business. A healthy pipeline is the closest you can get to a guarantee that you’ll make your targets by the end of the sales cycle.
As the SVP of Business Operations at ThoughtSpot, I’m responsible for putting actionable insights into the hands of our sales and marketing functions to drive predictable pipeline growth. This includes things like:
-
Volume: typically your North Star metric
-
Stages: where each prospect is in the pipeline, how they’re progressing, how long they’re spending in each stage, and how they’re qualifying for each stage
-
Velocity: how long an opportunity takes to move from one stage to the next
-
Deal cycle: average length from first meeting to successful close
-
Forecasting: what you predict will happen next month, based on previous performance
Within ThoughtSpot, my team and I are more “creators” than “consumers.” In short, we surface and curate the data insights and views that the sales and marketing teams will need to take action over the next quarter. We also provide the CFO and other senior leadership with the big picture data they need to make informed strategic decisions.
Read on to learn how we use self-service analytics to build a thriving pipeline and how you can too.
Visualize the big picture with Liveboards
Once we know what our pipeline revenue target is, we need to start working from the bottom up to figure out how we’ll get there. To start with, I set up different Liveboards for each area I want to see on a daily basis. I use Liveboards to get a clear idea of:
-
Sourcing
Where are our prospects coming from? For instance, how many leads are entering the pipeline from the sales team versus the marketing team? We keep track of the contribution percentages of each of our different top-of-the-funnel sources. This isn’t just so we can optimize each channel to make sure we get enough high-quality leads into the pipeline. It’s also about risk management — we need to make sure we don’t become overly reliant on a single channel for all our prospects. -
Follow-up conversion
How much of the pipeline gets converted into revenue? We’ll also track the prospects in each pipeline stage as a cohort, so we have up-to-date metrics for our average sales velocity. This data is key if we want to have accurate sales forecasting. -
Productivity
To get a useful overview of our business data, we also need to dig down to the granular level. For example, what percentage of AEs and SDRs are meeting their quotas in contribution to the pipeline?
We’re not only interested in tracking these metrics and managing the pipeline towards our end goal. We’re also keeping a close eye on how all the variables interact, where we can tweak and optimize, which way the data is trending and which variables have the most impact.
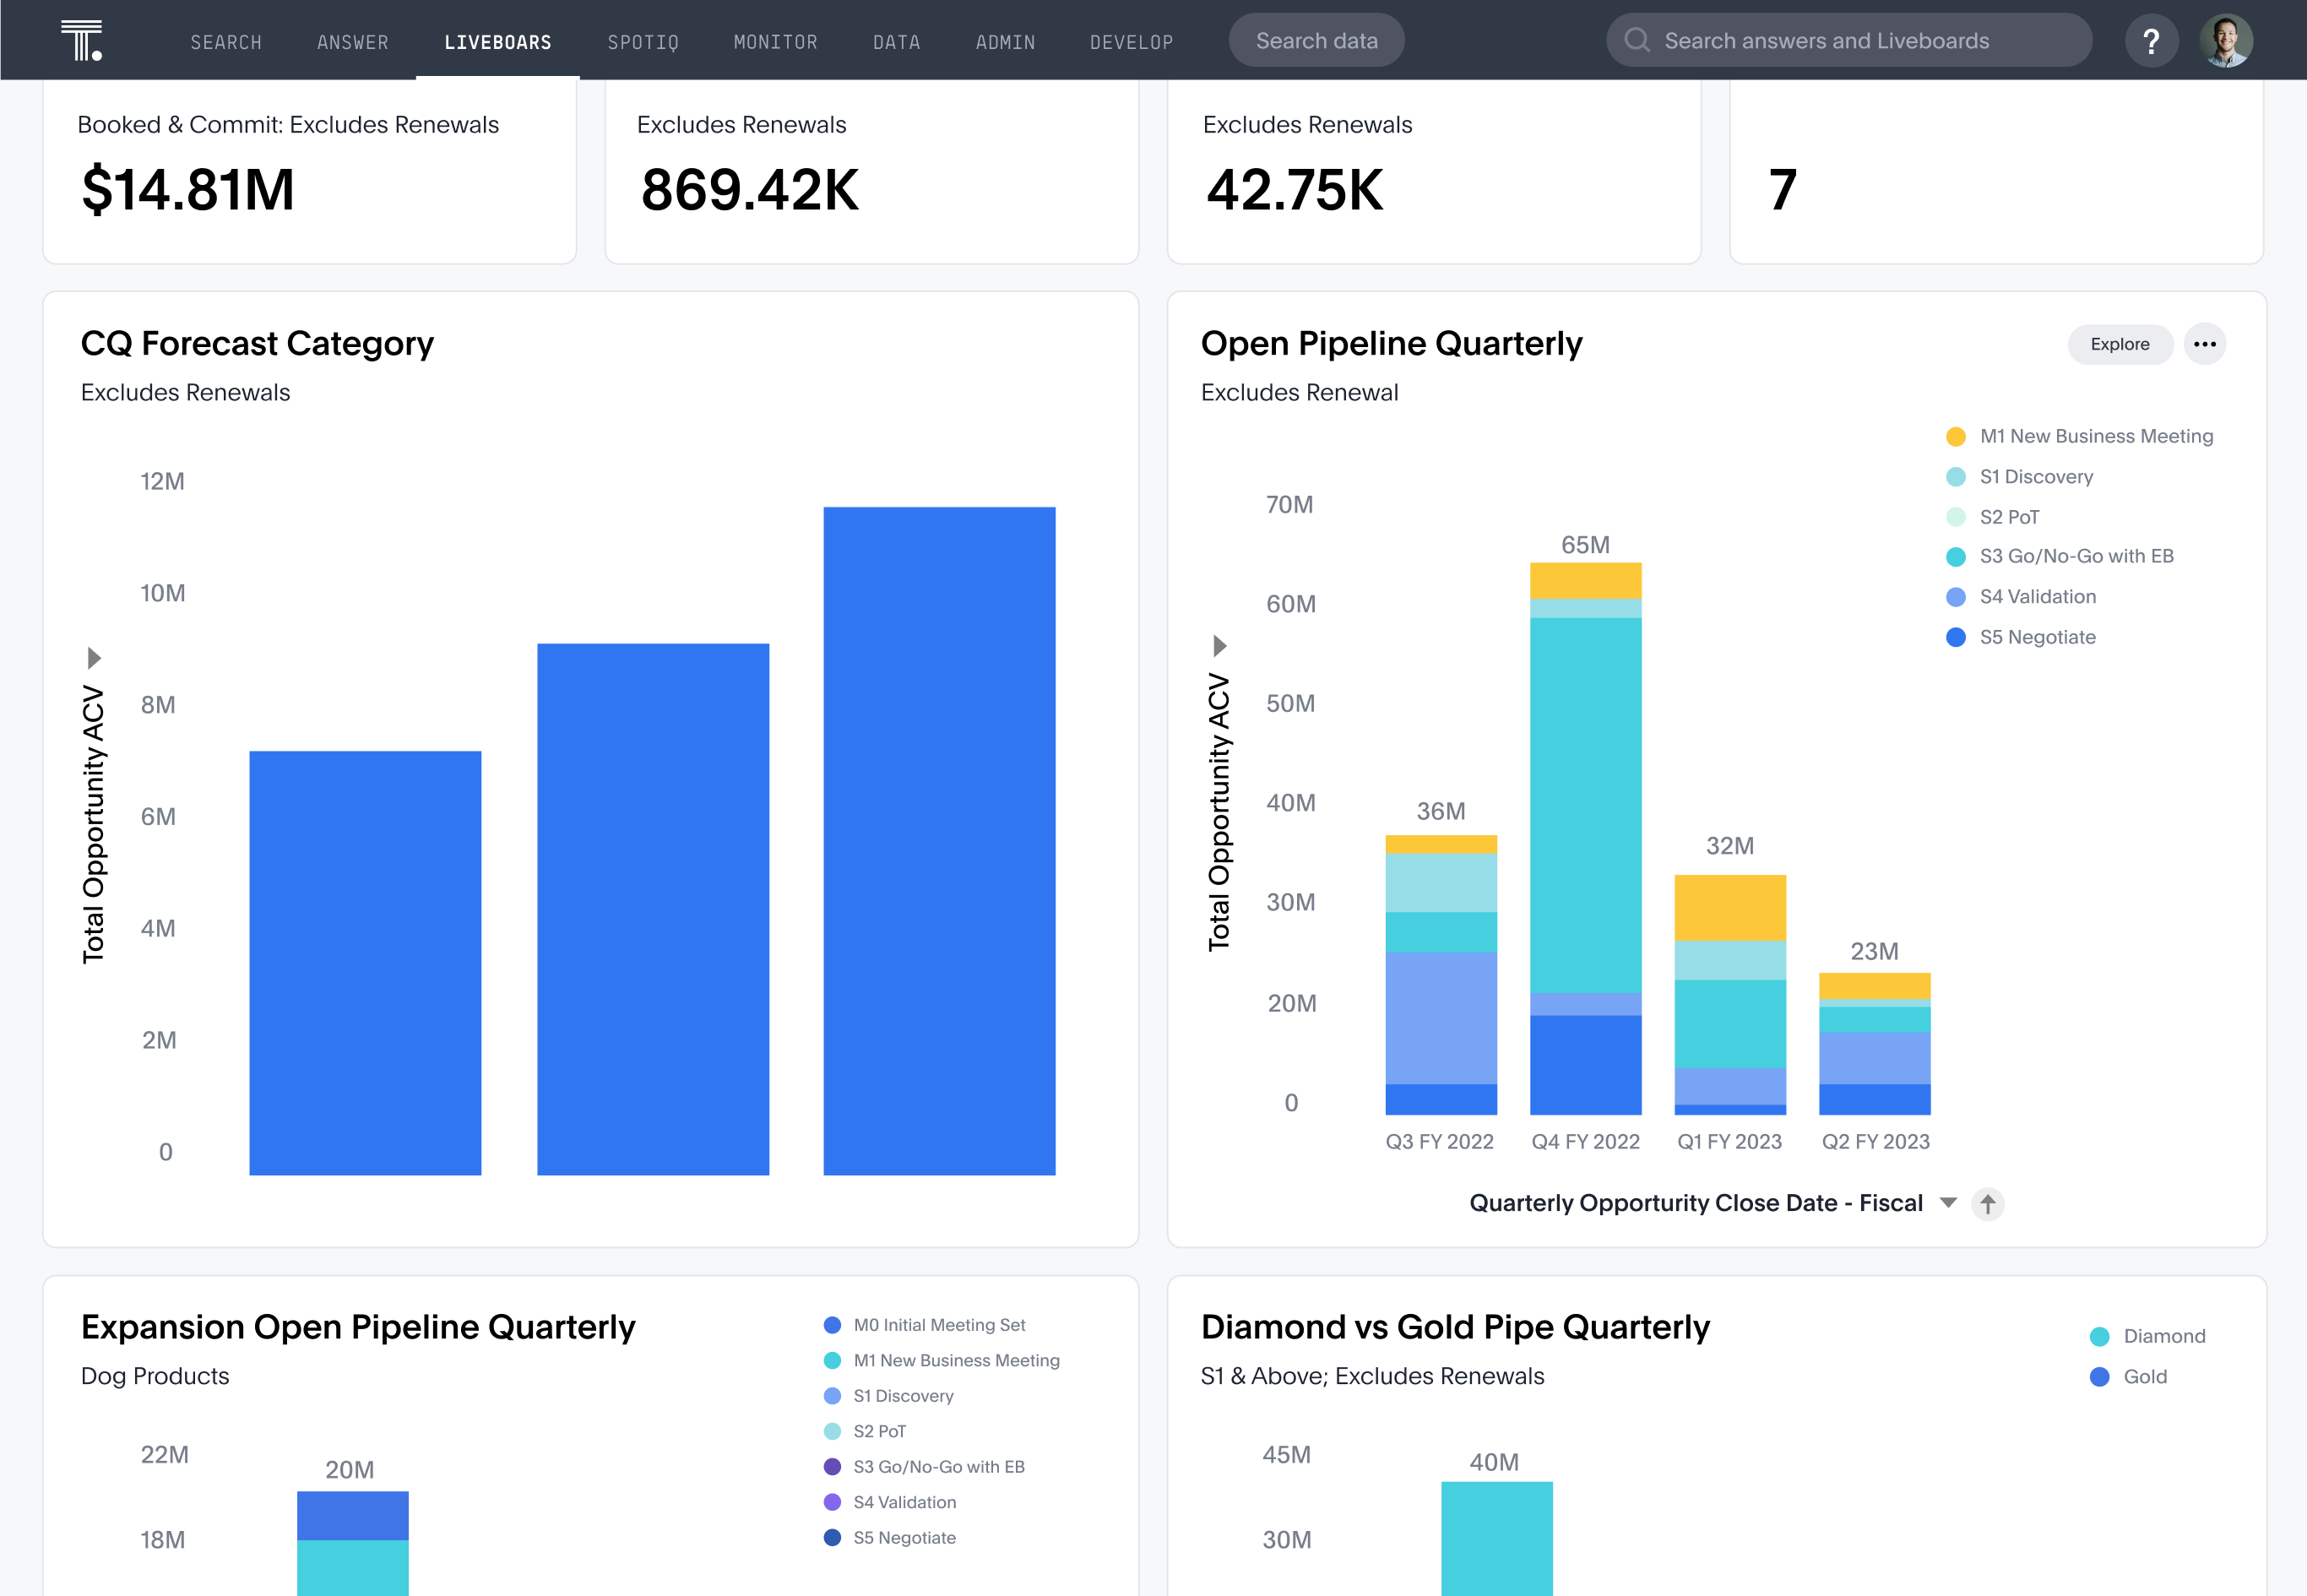
Keep a finger on the pulse of pipeline health with live data
This is a health check mechanism for the business as a whole. We take a look at the current quarter and the next couple of quarters, and ask ourselves, “Based on this data, does the pipeline look healthy?”
When I’m looking at our quarter open pipeline view, I’ll be mapping the data against our targets — for instance, our average close rates versus the total in the pipeline — to make sure that we’re looking on course for making our overall numbers for the quarter.
ThoughtSpot makes it easy to see what’s happening — and why it’s happening, all in real-time. In general, I’ll be looking for a nice, broad distribution across multiple variables such as:
-
Pipeline stage data. I’ll want to make sure that the proportion of prospects in S1, S2 and so on looks good. If I see a lot of prospects jammed up at the top of the funnel, I can quickly get in touch with the Sales team to figure out what they need to get things moving again.
-
Type of deal. We should be seeing plenty of new business, a good number of account expansions, and so on.
-
Sourcing. I’d always expect to see some variance on which channel is producing the most prospects in any given quarter, but again I’m looking to make sure we have a relatively broad distribution of lead sources.
Because we’re working with Live Analytics, I’m able to do this kind of detailed pipeline review on a regular basis. I don’t have to wait for the end of the quarter to be able to take action — I’m able to spot any issues and flag them up to our Sales or Marketing leaders right away.
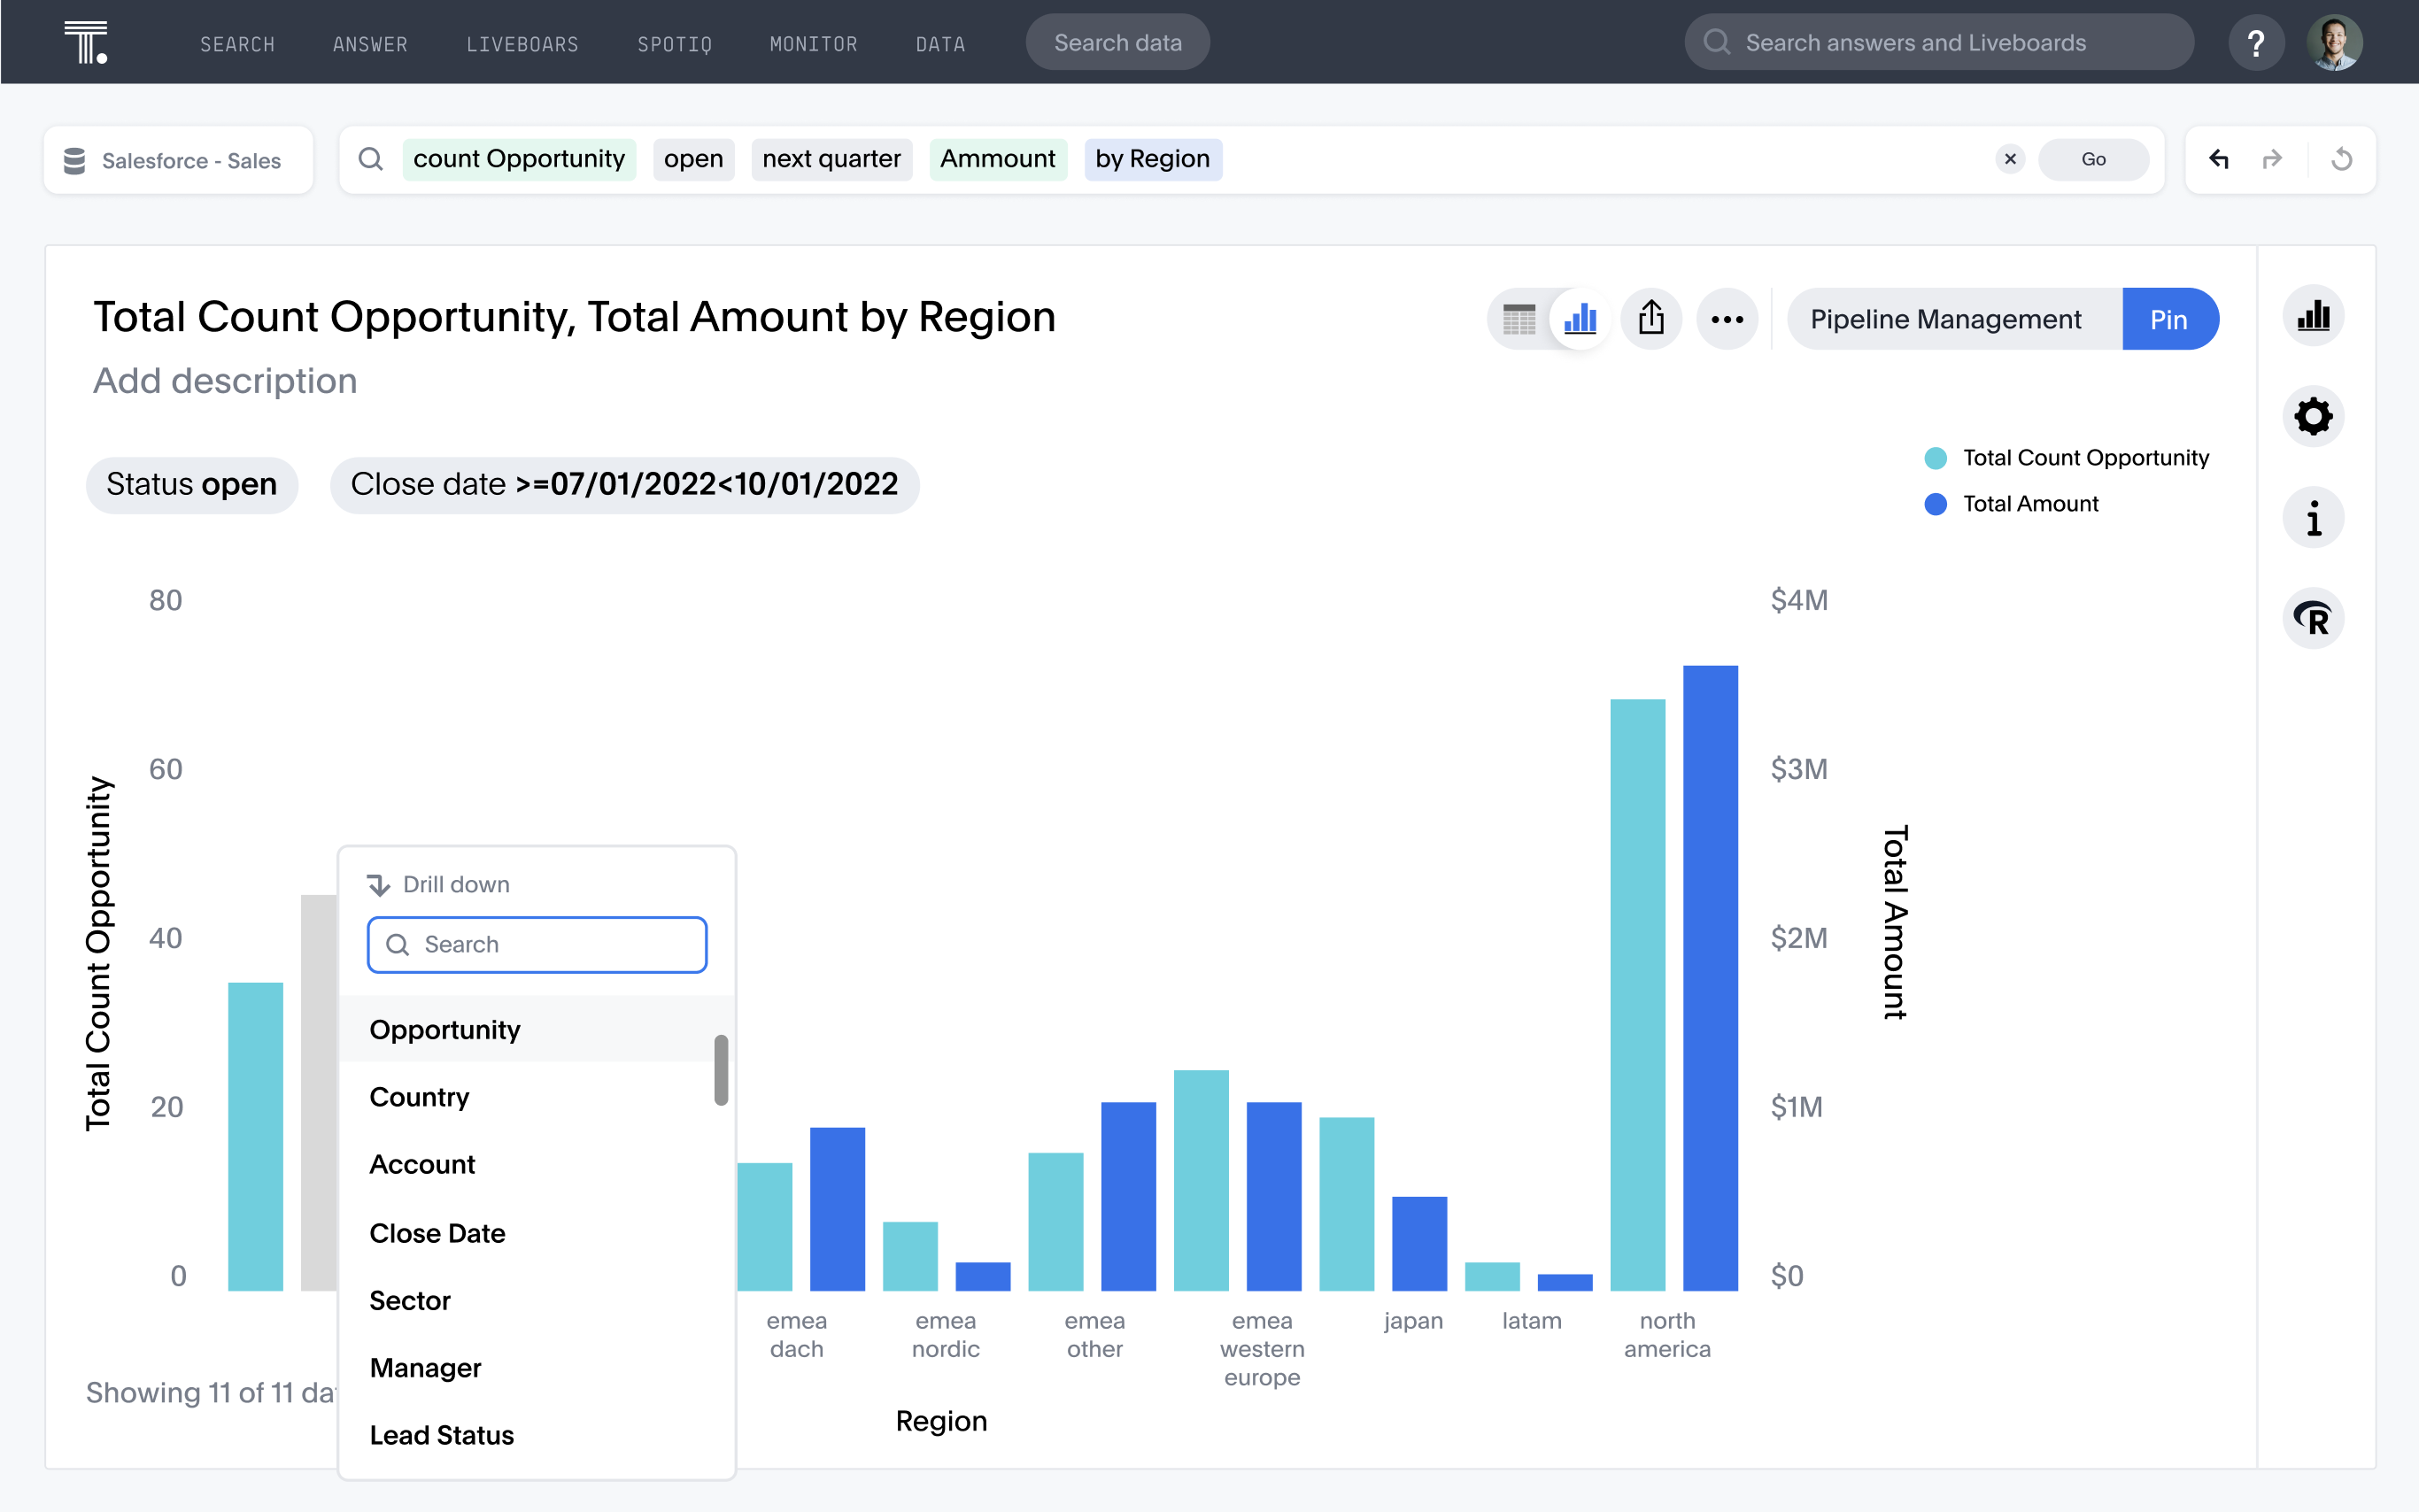
Get accurate projections (without the hassle)
We use search to get started with reliable, detailed pipeline forecasting. We need to make sure that what we have in the current quarter puts us in a good position to meet our targets for next quarter. If not, what actions do we need to take now to see the impact in the next 3 months? With the right filters, I can quickly pull up a quarterly sales forecasting chart—then dig into what we need to change.
Based on what I see in search, I use drill downs to quickly pull out insights to show if we’re trending in the right direction. That way, I can deliver accurate up-to-the-minute forecasts to the rest of the GTM team, and give them feedback on buyer trends and anomalies that might impact every stage of the funnel.
Bring your teams together with deal reviews
Big deals are great, of course, but they also involve serious risk. If you’re focusing all your attention on a major deal, and you run into a delay, then you can suddenly find yourself scrambling to close enough smaller deals to make your target. My job is to make sure that we’re always taking the right actions to close our largest deals in a timely manner:
-
Do we have enough champions for the deal?
-
Is management engaged with the deal?
-
Do we know what the right process is to close the deal in this quarter?
With search, we can pull out live, actionable insights for every single deal, no matter what the stage. With these insights, we can keep the whole Sales and Marketing function aligned on these high-stakes deals, to make sure we’ve done everything we can to close.
Optimize your pipeline with a waterfall view
The pipeline waterfall chart is one of my favorite data views in ThoughtSpot. It lets me take a close look at the whole pipeline and spot opportunities for improvements that I can share with the team. I can drill down to the granular level:
-
% of deals lost
-
% of deals won
-
% contracted (where the size of the deal shrinks over time)
-
% pulled into this quarter (where we’ve managed to accelerate the deal to get it closed in this quarter)
-
% pushed to next quarter (where we’ve run into delays)
-
% expanded (where we’ve expanded the deal during the sales cycle)
-
New pipeline (deals we’ve managed to bring in and close within the same quarter)

With this chart, you can drill down into each of these and quickly identify which opportunities were lost, which accounts they came from, and who owned the deal that was lost, pushed, expanded. Instead of being stuck in a static dashboard, or forced to remodel the data every time you think of a new question you want to answer, you can just slice the data however you want.
This level of granularity also means that we get smarter over time. My team will start to spot variables that are having a major impact on our pipeline, but that we didn’t even think of before. That way, our predictions get more accurate over time, and our pipeline gets more robust.
Stay on top of rep activity and performance
Figuring out how each individual sales rep is performing helps inform the entire pipeline. We need the information on individual sales productivity to help everyone in the Sales function do their best work — but we have to get the full 360-degree picture and take all the variables into account, or you risk being unfair to the individual reps.
With ThoughtSpot, you don’t just see what the sales reps are doing. You can also drill down to the specific data behind why they’re struggling — for instance, maybe they’re working on a big deal for the next quarter so they don’t have time to make their numbers in this quarter. My team uses the drill and filter capabilities to identify which sales activities generate the most revenue, and which activities we should probably just not bother with — so our sales team is always using their time wisely.
Make pipeline management easier with self-service analytics from ThoughtSpot
Like any business operations team, we aim to make it easier to replicate success quarter after quarter. Our goal is to give our partners in Sales and Marketing the story behind the data, so they can make better data-driven decisions, gain clarity over the pipeline, and stay ahead of the leading indicators.
If you’d like to know more about how to use ThoughtSpot to optimize your pipeline, you can set up a free trial.


