


Imagine navigating your business data with a clear, real-time view of every critical metric at your fingertips. No more waiting for monthly reports or sifting through outdated spreadsheets—just instant access to the insights you need to steer your company to success.
It’s time to embrace business analytics as a strategic advantage. With the right dashboard, business analytics becomes more than just reporting—it becomes your decision-making compass. According to a survey by Wavestone, 87% of data leaders report successful delivery of measurable business value using data and analytics. This article explores how you can use business analytics dashboards to revolutionize your decision-making process.
Table of contents:
A business analytics dashboard is a visual tool that consolidates key business metrics and data points into a single, intuitive interface. This business analytics provides real-time insights into various aspects of your business, from sales and marketing to operations and finance.
Picture a CEO overseeing multiple departments, each with its own data silos. A business analytics dashboard brings all these data streams together, allowing the CEO to quickly assess performance, identify trends, and make informed decisions.
Timely data access
Business analytics dashboards provide an overview of KPIs and metrics, enabling you to monitor performance over time and make informed decisions. Their consistent format helps track long-term trends and maintain data accuracy.
ThoughtSpot revolutionizes business analytics by offering Liveboards that provide real-time updates, ensuring you’re always working with the most current data.
For example, consider Fabuwood, a manufacturing company using Liveboards as the central information hub delivering real-time insights to the entire organization. Now, everyone in the company—from executives to front-line decision-makers—can act on data instead of gut feelings.
Enhanced decision-making
By presenting data in a clear, visual format, business analytics dashboards make it easier to understand complex information. You are empowered to make data-driven decisions with greater confidence and precision.
AI-powered analytics tools like ThoughtSpot can further elevate your decision-making process. With features like natural language search, you can effortlessly ask and answer questions within your business data. It's as straightforward and user-friendly as performing a simple web search or asking a question to your favorite chatbot.
Improved efficiency
Traditional dashboards often require analysts to manually build reports and visualizations, which can be time-consuming and create a backlog. This manual effort limits the time available for deeper analysis and strategic planning.
ThoughtSpot improves efficiency by automating data analysis and visualization. Your team can focus more on strategic planning and less on manual data preparation.
Improved insight discovery
Legacy dashboards help spot anomalies in charts and graphs. Their visual clarity aids in detecting irregularities and patterns within historical and current metrics.
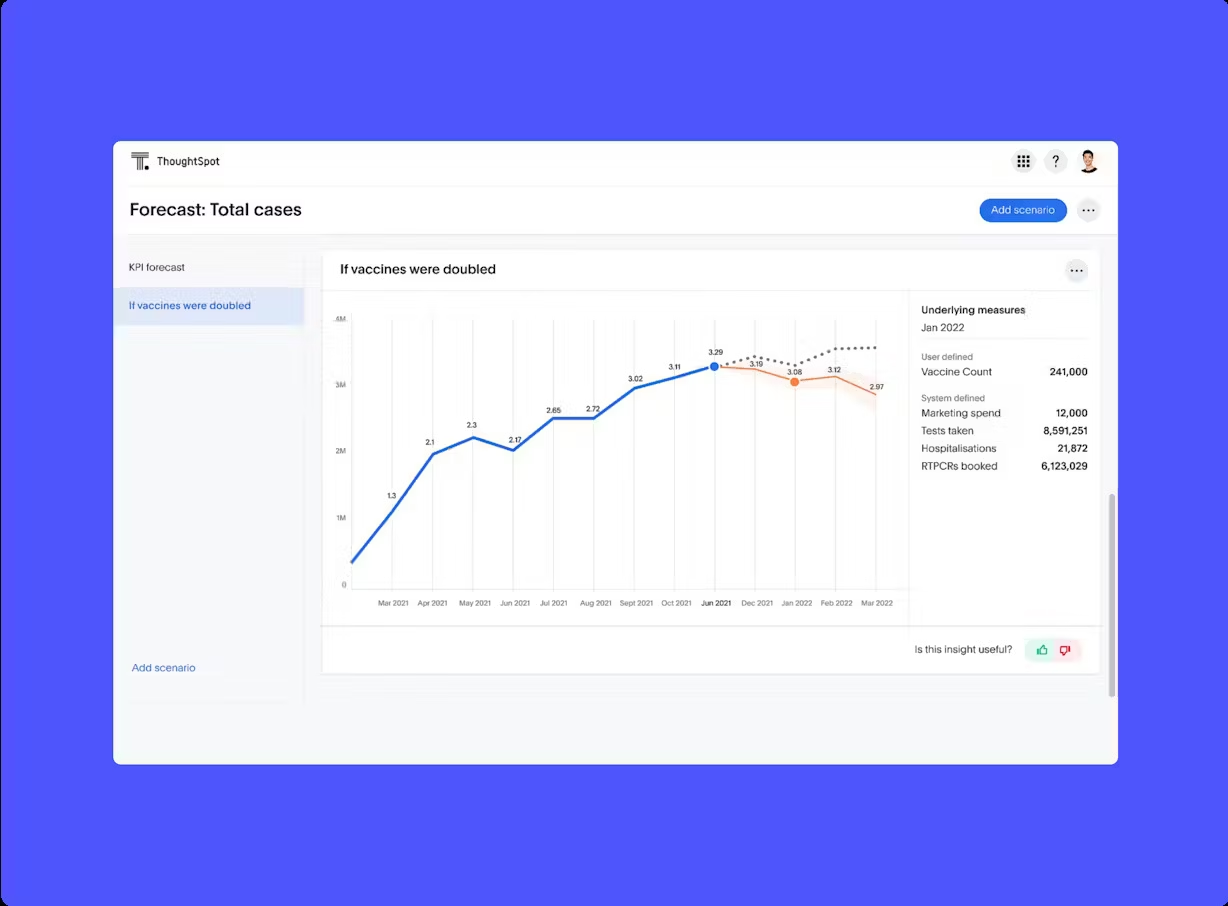
SpotIQ takes insight discovery to the next level. With advanced machine learning capabilities, SpotIQ automatically analyzes data to uncover hidden patterns and correlations. The “what-if” scenario exploration further enhances strategic planning by simulating various business scenarios based on real-time data analysis.
Better communication
These business dashboards facilitate clear and effective communication with stakeholders. Visually engaging reports make it easier to convey complex data insights to executives, investors, and other key stakeholders, fostering transparency and trust.
ThoughtSpot Liveboards seamlessly integrate data for boardroom presentations with Present mode. Additionally, our Excel and Google Suite connections automatically update live data in presentations, eliminating the need for manual updates before team meetings.
1. Financial dashboard
A financial dashboard is crucial for CFOs and financial teams to monitor critical financial metrics and trends. By leveraging a financial dashboard, you can gain a holistic view of your organization's financial health, make informed strategic decisions, and drive long-term profitability. Whether you're managing day-to-day operations or planning for future growth, a well-designed financial dashboard is an indispensable tool for financial leadership.
Important KPIs to track:
Current ratio: Assesses your company's short-term liquidity by comparing current assets to current liabilities
Debt-to-equity ratio: Compares total debt to total equity to evaluate a company's financial leverage and risk
Working capital: Represents the difference between current assets and current liabilities, indicating a company's liquidity and ability to cover short-term obligations
Inventory turnover: Measures the efficiency of inventory management by calculating the number of times inventory is sold or replenished within a specific period
Return on equity (ROE): Assesses the profitability of a company in relation to shareholder’s equity
🔍21 financial KPIs and metrics you should track in 2024
Consider Modern Restaurant Concepts. With Liveboards, general managers can easily monitor sales and labor data across nationwide restaurants. This empowered leaders to simplify budgeting, set more accurate goals, and quickly analyze the success of sales versus their anticipated forecasts.
2. Sales dashboard
A sales dashboard is a critical tool for your sales team to monitor performance and progress toward achieving sales targets. It offers comprehensive insights into sales trends, opportunities, and team performance, enabling sales managers and representatives to make informed decisions and adjustments to their strategies.
Important KPIs to track:
Monthly calls (or emails) per sales rep: Measures the average number of calls or emails made by each sales representative within a given month
Sales opportunities: Tracks the number of potential sales deals or prospects that have progressed through the initial stages of the sales process
Sales targets: Sets clear benchmarks for measuring sales performance, typically based on historical data, market trends, and business objectives
Sales forecasting accuracy: Evaluates the precision and reliability of sales forecasts by comparing predicted sales figures with actual sales results over a specific period
Lead-to-sale conversion rate: Measures the effectiveness of converting leads into paying customers
🔍 Top 16 sales metrics and KPIs to track in 2024
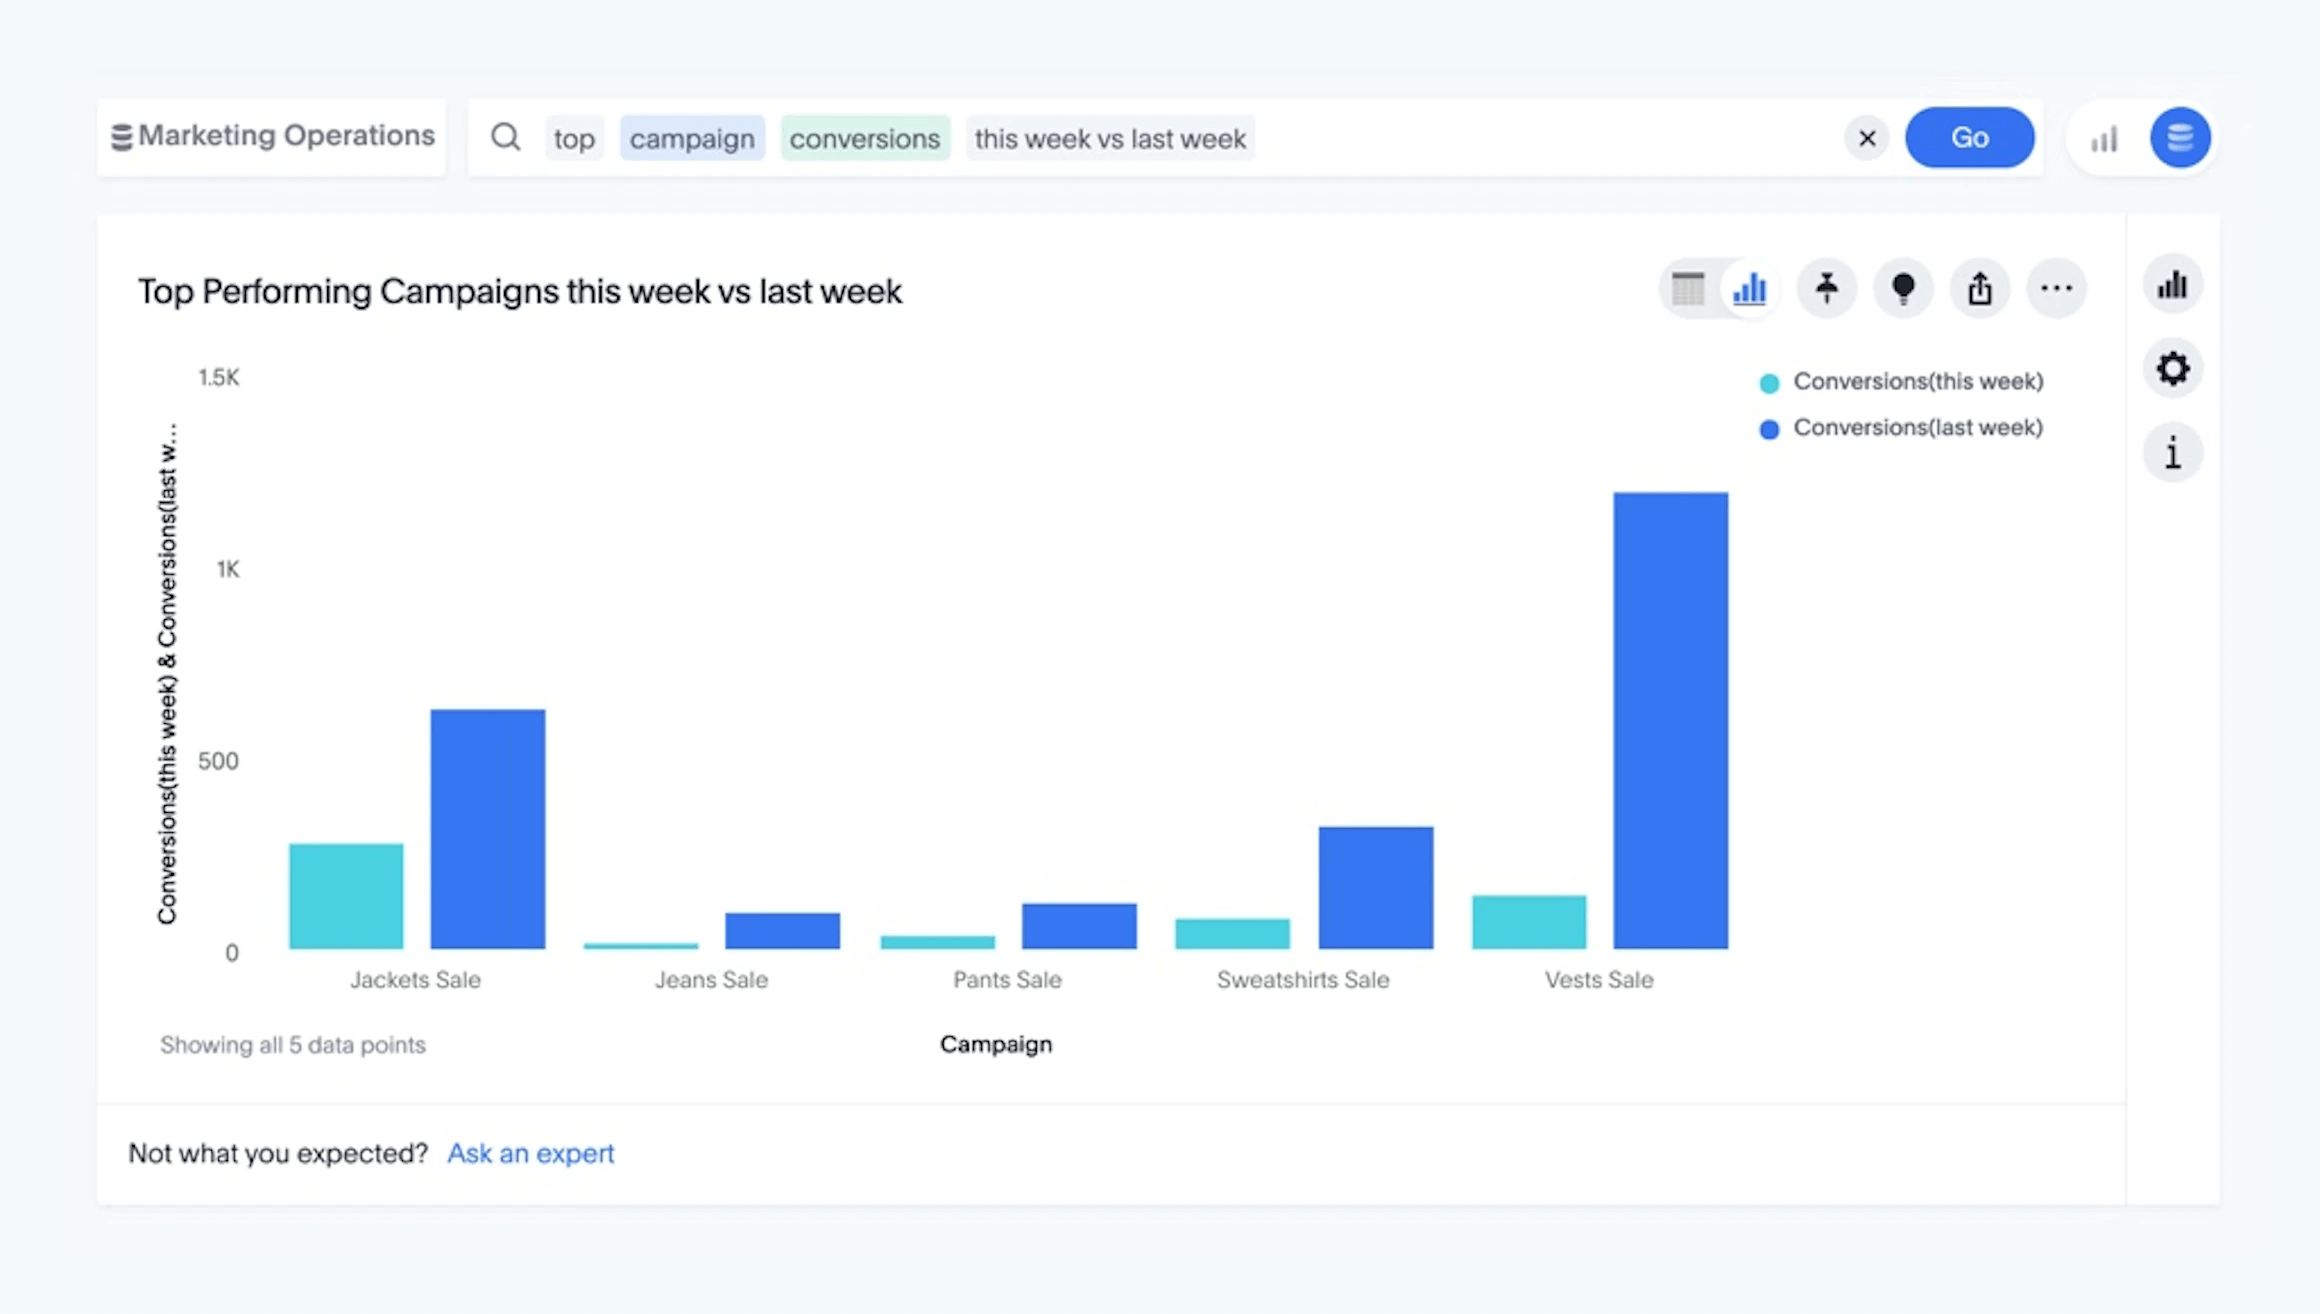
3. Marketing dashboard
A marketing dashboard serves as the nervous system for evaluating the effectiveness of your marketing initiatives and strategies. It provides a comprehensive overview of various marketing channels, campaigns, and metrics, helping marketers make informed decisions to improve ROI and engagement.
Important KPIs to track:
Conversion rate: Measures the percentage of desired actions taken by website visitors
Cost per lead (CPL): Tracks the average cost incurred to acquire a new lead or prospect
Website traffic: Monitors the number of visitors to the website over time
Return on Ad Spend (ROAS): Measures the revenue generated from advertising campaigns relative to the cost of advertising
Customer lifetime value (CLTV): Predicts the net profit attributed to the entire future relationship with a customer
🔍15 marketing KPIs and metrics to track in your dashboard
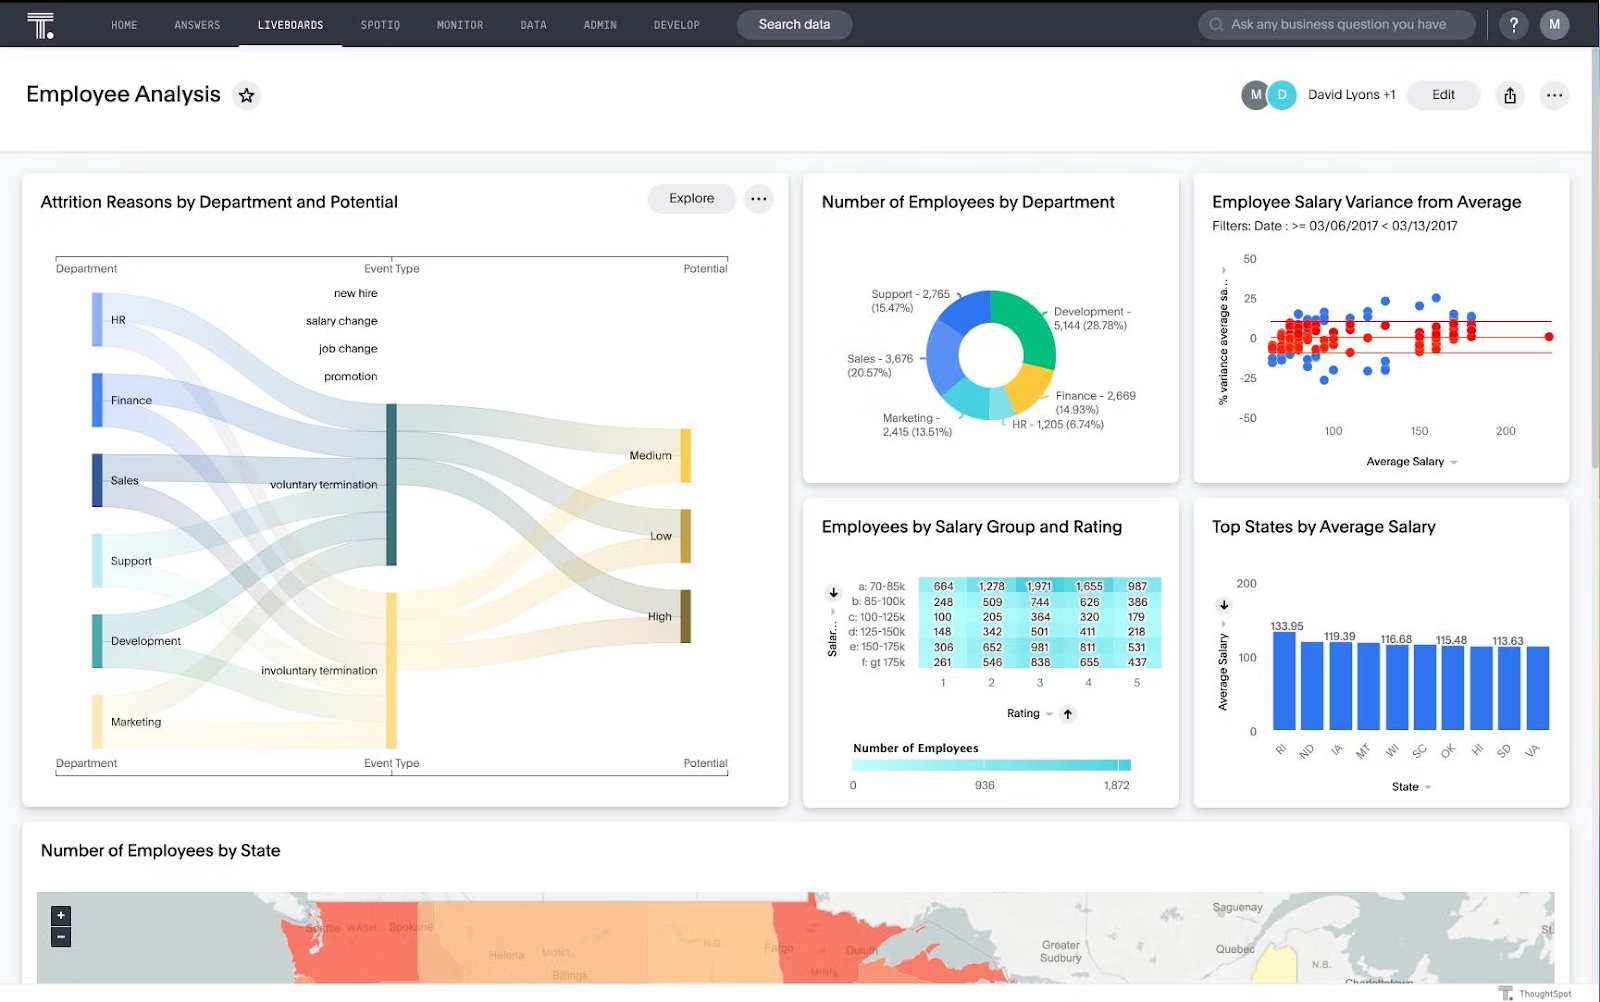
4. HR dashboard
An HR dashboard provides comprehensive insights into various aspects of employee performance, satisfaction, and organizational health. It serves as a vital tool for HR teams to make data-driven decisions and optimize workforce management strategies.
Important KPIs to track:
Employee turnover rate: Calculates the percentage of employees who leave the organization over a specific period
Time to hire: Tracks the average time taken to fill a job vacancy once the position has been posted
Cost per hire: Evaluates the average expenses incurred in recruiting and hiring new talent
Employee satisfaction: Gauges the contentment levels of employees within the organization
Employee productivity: Measures the output and efficiency of employees in accomplishing their tasks and responsibilities
🔍12 HR metrics examples and KPIs you should track
Business data can be overwhelming, but it doesn’t have to be. With the right tools, navigating this ocean of information is manageable, and some might even find it exciting. An intuitive user experience is key to simplifying the process of data analysis.
ThoughtSpot’s consumer-friendly UX allows users to effortlessly analyze data using natural language search, eliminating the need for specialized training or technical data expertise. It's no wonder businesses like Snowflake, HP, and OrderPay trust ThoughtSpot as their preferred business intelligence solution.
Key benefits of ThoughtSpot over other legacy dashboard tools:
ThoughtSpot's Liveboards provide a consolidated view of key metrics with limitless drill-downs and filters, enabling ad-hoc analysis and data discovery on real-time business data.
With self-service analytics, every user can create their own data visualizations using a simple search interface.
ThoughtSpot’s AI-augmented analytics detect anomalies and identify opportunities for optimization, guiding you toward smarter business decisions.
Don't let data overwhelm you—let it empower you. Embrace the future of business analytics with ThoughtSpot, and discover how seamless data analysis can revolutionize your decision-making process.
See the difference for yourself–schedule a demo today.


