


As the volume and variety of data continue to grow, so does the potential for users to leverage this data in new and exciting ways.
Doing so, however, requires businesses to break free from the BI paradigms of the past. Forget the read-only views of siloed, static dashboards. The future lies in embracing augmented analytics—new-age, AI-powered solutions that empower everyone to make data-driven decisions.
In fact, recent research by McKinsey shows companies that leverage next-gen AI-powered analytics are seeing a 20% increase in earnings. Even better, GenAI in data and analytics is helping IT leaders reduce overhead and speed up time to insight. Sound too good to be true? Think again. With the right augmented analytics software, you can turn these possibilities into reality.
Table of contents:
- What is augmented analytics?
- What are the top benefits of augmented analytics?
- Key components of augmented analytics
- What are the challenges of augmented analytics?
- Best practices for augmented analytics
- Industry-specific use cases for augmented analytics
- What’s next for augmented analytics?
- What if anyone could explore the data?
Augmented analytics is a type of data analysis that uses artificial intelligence (AI) and machine learning to automate and assist with everything from data preparation to insight generation. It can clean and join datasets, identify patterns, suggest next steps, and even visualize findings, all without requiring deep technical skills.
What makes augmented analytics different from traditional BI is that it’s designed for non-technical users. Instead of waiting for a data team to build a dashboard, business users can explore data on their own, ask follow-up questions, and make decisions faster. It’s a key driver of self-service analytics, helping teams get from data to action with less friction.
1. Faster, smarter decisions
Machine learning algorithms can scan massive datasets to find patterns, correlations, and outliers you might miss. Combined with natural language processing (NLP), these tools let you ask questions in clear terms and get clear answers backed by AI.
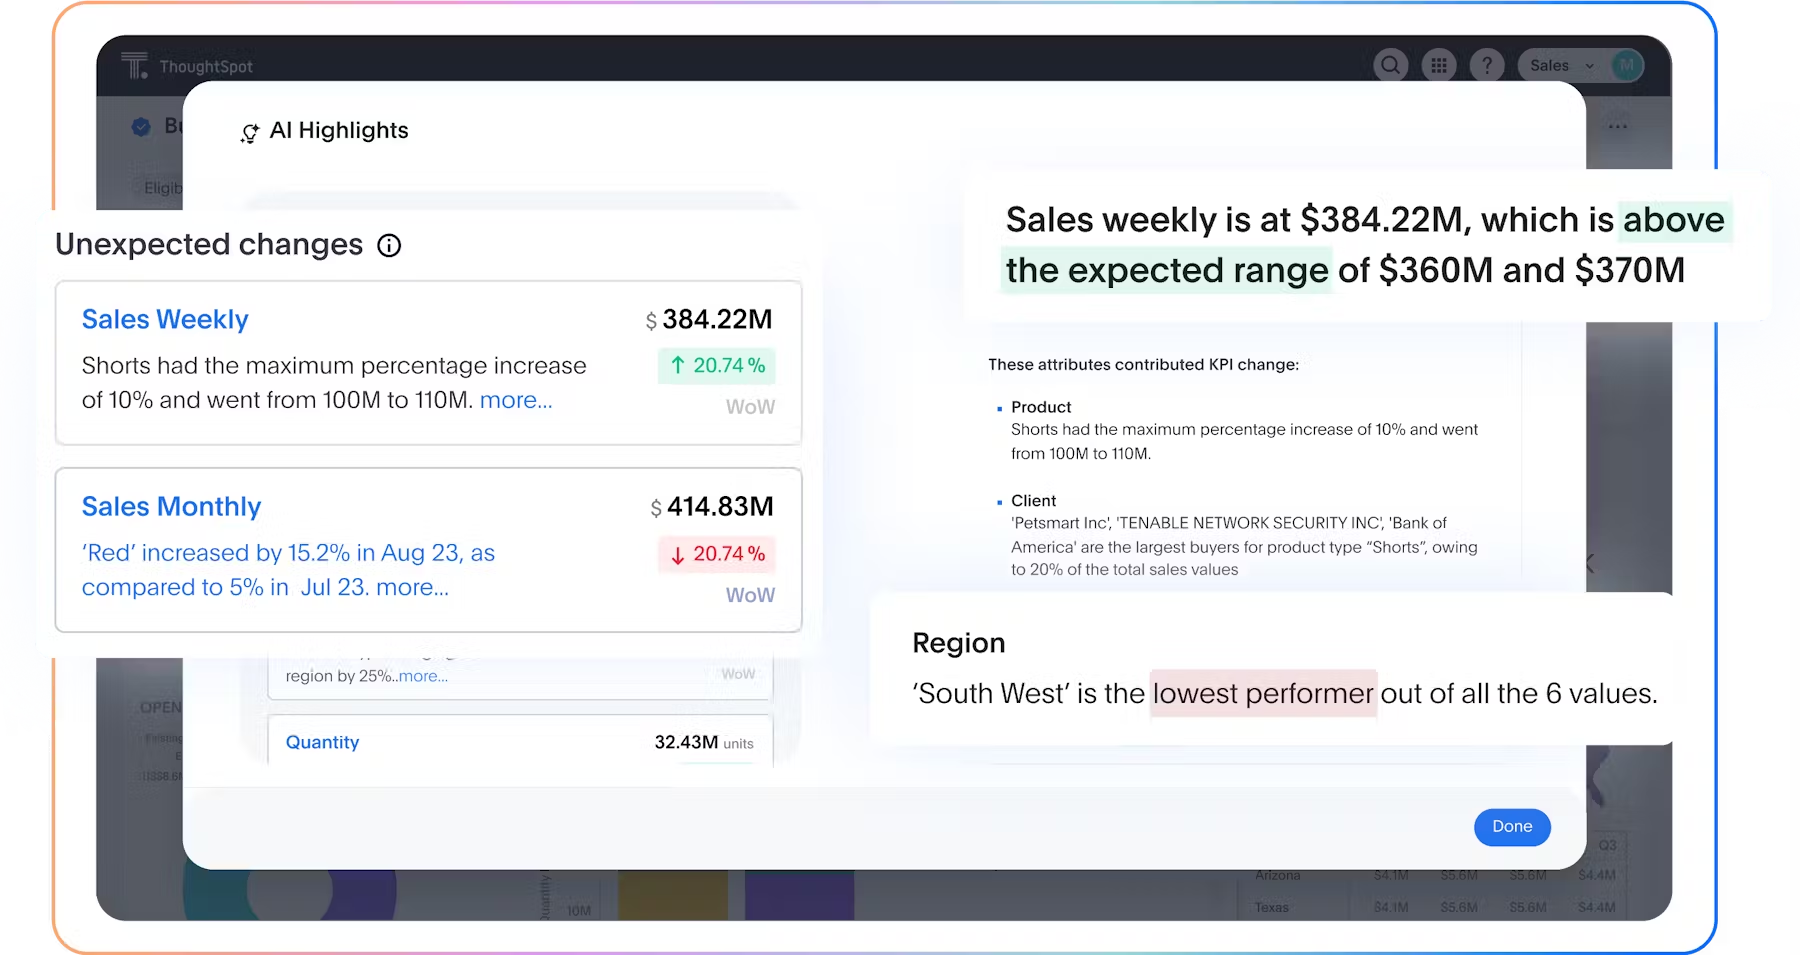
With ThoughtSpot, for example, anyone on your team, from marketers to ops, can type a question and instantly get interactive charts and AI-generated insights. Features like AI Highlights help surface trends and anomalies automatically, so you can stay ahead of the curve without digging through dashboards.
2. Greater efficiency for data teams
As Cristian Felix, VP of Product at Accern, puts it: “Data and AI are not here to replace humans but to augment and support them to make better decisions.”
Today’s data teams spend too much time prepping data, managing dashboards, and fielding ad-hoc requests. Augmented analytics can handle much of that grunt work, freeing analysts to focus on strategic analysis and more impactful projects.
Take ThoughtSpot, for example. With one click, you can forecast trends, run change analysis, and even set anomaly alerts that notify you when KPIs behave unexpectedly. It’s a faster, more scalable way to stay on top of change.

3. Context-rich insights
Let’s say you’re a supplier in the electronics space. You notice a spike in demand for mobile components and assume it’s seasonal until you cross-check that data with tech launch news. Turns out it’s linked to the next iPhone release.
That kind of context, data layered with real-world events, is where augmented analytics shines. Tools like Spotter, ThoughtSpot’s AI Analyst helps you surface richer data stories by combining internal metrics with external signals. Instead of flipping between fragmented dashboards, you get a unified, interactive view that connects the dots, reveals patterns, and prompts your next question—so you can plan proactively, not just react.
4. Deeper understanding of customer behavior
Augmented analytics gives you a 360-degree view of your customers, combining data from across channels to help you understand who they are, what they need, and how they behave.
Just take a look at Wellthy as an example. A company that supports family caregivers. Before, their care team had to wait days for insights from the data team. Now, using ThoughtSpot, they can drill into real-time data on their own, build custom Liveboards, and tailor their support based on live customer signals, all without writing a line of code.
Watch this segment from Beyond 2023 to learn how Wellthy is driving customer outcomes with ThoughtSpot.
5. More accurate predictions
Predictive analytics isn’t new but augmented analytics makes it faster, smarter, and more accessible. By applying machine learning to historical data, these tools help you forecast what’s likely to happen next, with less guesswork and more confidence.
ThoughtSpot’s engine, for instance, automatically analyzes large datasets to identify patterns and project future outcomes, no manual modeling required.
Augmented analytics brings AI into every stage of the analytics process—from data integration and prep to discovery and insight generation. Automating time-consuming tasks lets business users explore data more freely, while giving data teams space to focus on higher-impact work.
Here’s what that typically looks like:
1. Streamlined data integration
Instead of manually stitching together data from multiple sources, augmented analytics tools automate the process. They can intelligently map, merge, and align data from different systems, giving you a unified view of your operations with less hassle.
2. Automated data preparation
These tools go beyond basic data cleaning. They can spot inconsistencies, auto-generate column synonyms, and recommend joins, saving hours of manual work and giving analysts more time for actual analysis.
3. Automated data discovery
Using machine learning and statistical techniques, augmented analytics can scan huge datasets and automatically highlight patterns, trends, and anomalies, surfacing insights you may not have thought to look for.
4. Automated visualizations
No code or SQL required. Just ask a question or select a dataset, and the platform generates charts and visuals that help you quickly understand the story behind the numbers.
5. Predictive analytics
By analyzing historical data, these systems can forecast trends, identify likely outcomes, and even model how changing one variable could affect another.
6. Prescriptive analytics
Augmented analytics doesn’t just tell you what might happen, it suggests what to do next. Whether it’s flagging risks or highlighting opportunities, it helps guide decisions with actionable recommendations. Unlike predictive models that focus on forecasting, prescriptive analytics is all about recommending next steps, making it especially valuable in fast-moving environments where timing is everything.
7. Natural language query (NLQ)
Instead of writing queries, you can just type (or say) a question in plain English. GenAI-powered tools interpret your intent and deliver answers instantly, making data exploration as easy as chatting with a colleague.
1. Data quality
AI and machine learning algorithms are only as reliable as the data they’re fed. If your datasets are full of duplicates, missing values, outdated records, or inconsistent formatting, the insights you get will be flawed, sometimes dangerously so.
For example, a retailer might forecast high demand for a product based on incomplete sales data, only to overstock and waste inventory. That’s why data governance, things like standardized inputs, reliable data pipelines, and clear ownership, aren’t optional if you care about data quality at scale.
The good news? Many modern augmented analytics tools now offer built-in features that help clean, normalize, and flag anomalies in your data, so you’re not flying blind.
2. Tool complexity
While augmented analytics platforms are designed to simplify analysis, some can end up overwhelming users with too many features, unfamiliar workflows, or steep learning curves, especially if they were originally built for technical audiences.
This creates a paradox: You buy the tool to make data more accessible, but your team still ends up depending on the data team to use it.
Look for tools with consumer-grade interfaces—ones that let users search in plain language, get visual answers instantly, and explore data without needing to learn a new query language. And don’t underestimate the importance of onboarding and internal champions during rollout.
3. Data literacy gaps
Even if the platform is easy to use, users still need to understand what they’re looking at. Without basic data literacy, knowing what a KPI is, how to read a trend line, or when to question an outlier, it’s easy to misinterpret insights or make bad calls.
This doesn’t mean every team member needs to become an analyst. But it does mean you should pair your analytics rollout with training, resources, and a culture of curiosity.
Confidence doesn’t come from dashboards alone. Help users build it with short workshops, in-product tips, and access to your data team. When users feel confident, they’ll be more likely to explore and act on what they find.
4. Data silos and integration issues
Even the smartest AI can’t analyze what it can’t see. If your data is scattered across disconnected systems, ERP, CRM, marketing tools, and spreadsheets, your teams are working in silos and you’ll struggle to get the complete picture.
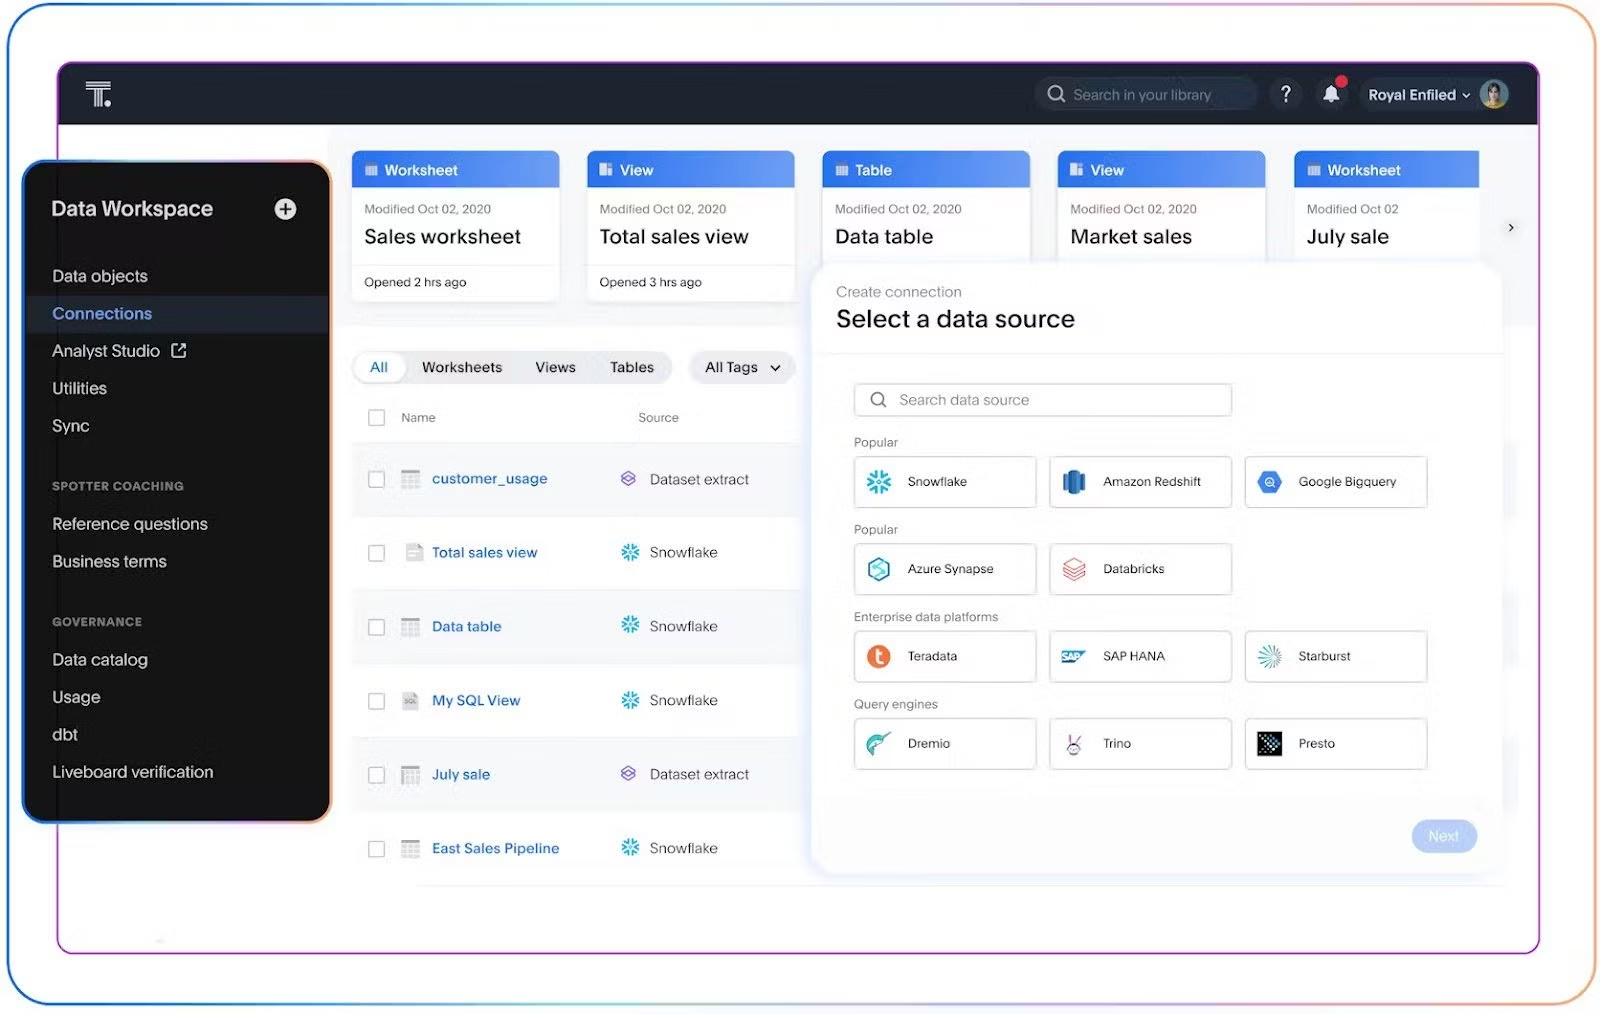
Augmented analytics works best when it has access to a broad, unified dataset. That’s why integration capabilities and a solid modern data stack are key. Look for platforms that connect to your cloud data warehouse or allow easy data federation, so you’re not relying on partial or outdated information.
ThoughtSpot, for example, integrates with leading cloud platforms like Snowflake, Databricks, and BigQuery so you can query live data without needing to move or duplicate it.
5. Trust and explainability
AI-generated insights can feel like a black box, especially if users don’t understand how the conclusions were reached. If your team doesn’t trust the results, they won’t act on them.
To combat this, choose tools that emphasize transparency. Can users see the data behind the chart? Can they follow the logic of how the AI got there? Can they easily drill down or ask follow-up questions?
Explainability isn’t just a compliance checkbox, it’s a trust builder that turns curiosity into action.
1. Start with clean, well-governed data
Even the best AI tools can’t fix messy data. Invest in solid data governance and make sure your data is accurate, consistent, and up to date before layering on automation.
2. Define clear business questions
Augmented analytics is most effective when it's tied to real business needs. Before diving in, align with stakeholders to identify the key questions you’re trying to answer or problems you’re trying to solve.
3. Prioritize user-friendly tools
Choose platforms that offer intuitive interfaces, natural language search, and automated guidance. If business users can’t easily use the tool, adoption will suffer no matter how powerful it is.
4. Combine AI with human context
AI can spot patterns, but it’s up to humans to decide what they mean. This human-in-the-loop approach helps teams validate AI-generated insights with domain knowledge and on-the-ground context, turning raw signals into smart decisions.
5. Upskill your teams
You don’t need everyone to be a data scientist, but you do need a baseline of data literacy to build a sustainable data-driven culture across the organization. Offer training to help users interpret insights, ask better questions, and trust the results.
6. Start small, then scale
Begin with a few high-impact use cases to demonstrate value. Once you’ve got wins and buy-in, expand to other teams and departments.
7. Monitor and iterate
AI models evolve, and so should your approach. Regularly review how insights are being used, where users get stuck, and where the tool could offer more value. Keep optimizing based on feedback and performance.
Augmented analytics isn’t limited to a single department or industry. It’s being used across sectors to help teams make better, faster decisions without waiting on a data expert. Here are a few augmented analytics examples across industries and how teams are putting them to work:
Retail
Augmented analytics helps merchandisers and planners stay ahead of shifting consumer preferences. For example, teams can analyze purchasing patterns in real time to optimize product placement across stores or digital shelves. Seasonal demand forecasting gets sharper, helping avoid both overstocking and missed sales. Instead of relying on gut instinct or delayed reports, retail teams can react to trends as they happen.
Healthcare
Clinicians, administrators, and hospital ops teams use augmented analytics to identify patterns in patient data that would be hard to spot manually. Say a hospital sees a spike in readmissions for a certain condition, augmented analytics can flag it and point to likely causes, like care gaps or treatment plans. It’s also helping reduce wait times and balance staffing by analyzing appointment trends, patient flow, and resource utilization.
Manufacturing
On the factory floor, speed and precision are everything. Augmented analytics lets teams analyze production line data in real time to detect bottlenecks, catch quality issues early, or predict equipment failures before they stall operations. This kind of proactive insight helps reduce downtime and streamline maintenance schedules no more scrambling when something breaks.
Financial services
Risk teams use augmented analytics to surface fraud signals instantly, spotting patterns that traditional models might miss. It can flag unusual behavior, like a sudden change in spending habits or account access location, and trigger an alert. On the investment side, analysts use it to identify market shifts and emerging trends without digging through reports manually. The result: faster, more informed decisions.
Telecom
Customer experience teams are tapping into augmented analytics to better predict churn and improve service quality. Instead of reacting to complaints, they can proactively spot customers at risk of leaving, like those with dropped call patterns or frequent service issues, and intervene early. It also helps streamline support by identifying which issues are trending and where to allocate resources.
The real value here isn’t just speed, it’s scale. These teams don’t need to rely on a small group of data experts anymore. With augmented analytics, insights flow directly to the people making decisions, embedded into their day-to-day tools and workflows.
The field is evolving fast, with innovations that are making analytics more immediate, accessible, and actionable for everyone. Here are a few trends shaping where things are headed:
Real-time insights
As more companies adopt cloud data platforms like Snowflake, Databricks, or Google BigQuery, expectations are shifting. Users want insights in seconds, not hours. Whether it’s a marketing team monitoring campaign performance or a supply chain team watching inventory levels, the demand for low-latency, high-volume analysis is driving adoption of tools that can keep up with the pace of business.
Conversational analytics
Natural language interfaces are becoming table stakes. Instead of learning how to build a dashboard or write SQL, users just ask a question—like “What’s driving churn in Q2?” or “How are sales trending by region?”—and get back a chart or clear explanation. This removes friction, broadens access to data, and makes analytics feel more like a conversation than a report.
Embedded analytics
Insights are no longer confined to dashboards. Augmented analytics is now embedded directly into the tools your team already uses—like Salesforce, Notion, Google Sheets, or even custom internal apps. With embedded AI, these insights don’t just sit in a chart, they’re context-aware, proactive, and often come with recommended actions. This kind of tight integration helps teams move faster by eliminating context switching. Instead of digging through reports or toggling between platforms, insights appear right where decisions happen.
Edge analytics
For industries like manufacturing, logistics, or energy, some of the most important data doesn’t live in the cloud; it lives on devices in warehouses, factories, or delivery trucks. Edge analytics brings the power of augmented analysis to these environments, allowing for real-time decisions on the ground, even with limited connectivity. Whether it’s optimizing delivery routes or monitoring equipment health, edge analytics helps teams respond instantly, not after the fact.
💡 Unlock your AI edge: When you really get what each type of AI does best, you’re not just using a tool—you’re putting the right brain to the right task. Ready to see how? Here’s your complete guide.
You don’t need to be a data expert to get value from your data. That’s the promise of augmented analytics: with the right tools, clean data, and a little curiosity, anyone on your team can go from asking what happened to deciding what to do next.
It’s not about replacing analysts. It’s about giving every decision-maker the power to explore, dig deeper, and act on data without waiting in line for a dashboard.
See it in action—book your demo today.
FAQs
1. How does AI ‘augment’ data in analytics?
Augmented data refers to data that’s been enhanced or enriched using AI and machine learning. This can include automated tagging, anomaly detection, forecasting, or adding context from external sources. It’s part of what makes augmented analytics so powerful giving raw data more meaning without manual work.
2. What is the difference between augmented analytics and traditional BI?
Traditional BI tools rely on analysts to prepare data, build dashboards, and generate reports usually for consumption by others. Augmented analytics uses AI to automate many of those steps. It allows business users to ask questions in natural language, get instant insights, and explore data independently. It’s faster, more scalable, and more accessible.
3. What is the difference between predictive analytics and augmented analytics?
Predictive analytics is a technique that uses historical data to forecast future outcomes. Augmented analytics is broader it includes predictive analytics, but also covers data prep, insight discovery, visualization, and natural language search, all powered by AI. Think of augmented analytics as the toolkit, and predictive analytics as one of the tools inside it.


