


It’s Monday morning, and you’re about to walk into a meeting. A major product launch just went live. But the moment it begins, you can feel it—everyone’s looking for answers.
Marketing reports strong traffic but weak engagement.
Product reports adoption, but only in certain markets.
Finance says targets are being met, yet something’s not adding up.
Every team has a different take. And all eyes are on you as a decision-maker to make the next move. Do you shift resources? Rethink the roadmap? Stay the course?
That’s why business analytics matters. It reveals what’s working, what isn’t, and where to focus—before small problems turn into costly ones.
Here’s how to get there.
Table of contents:
Business analytics is the practice of analyzing and interpreting data to gain insights into business performance and identifying areas for improvement.
But it’s more than just dashboards and reports. With tools like predictive analytics, machine learning, and natural language queries, both analysts and business users can explore their data to find the insights they need to make informed decisions.
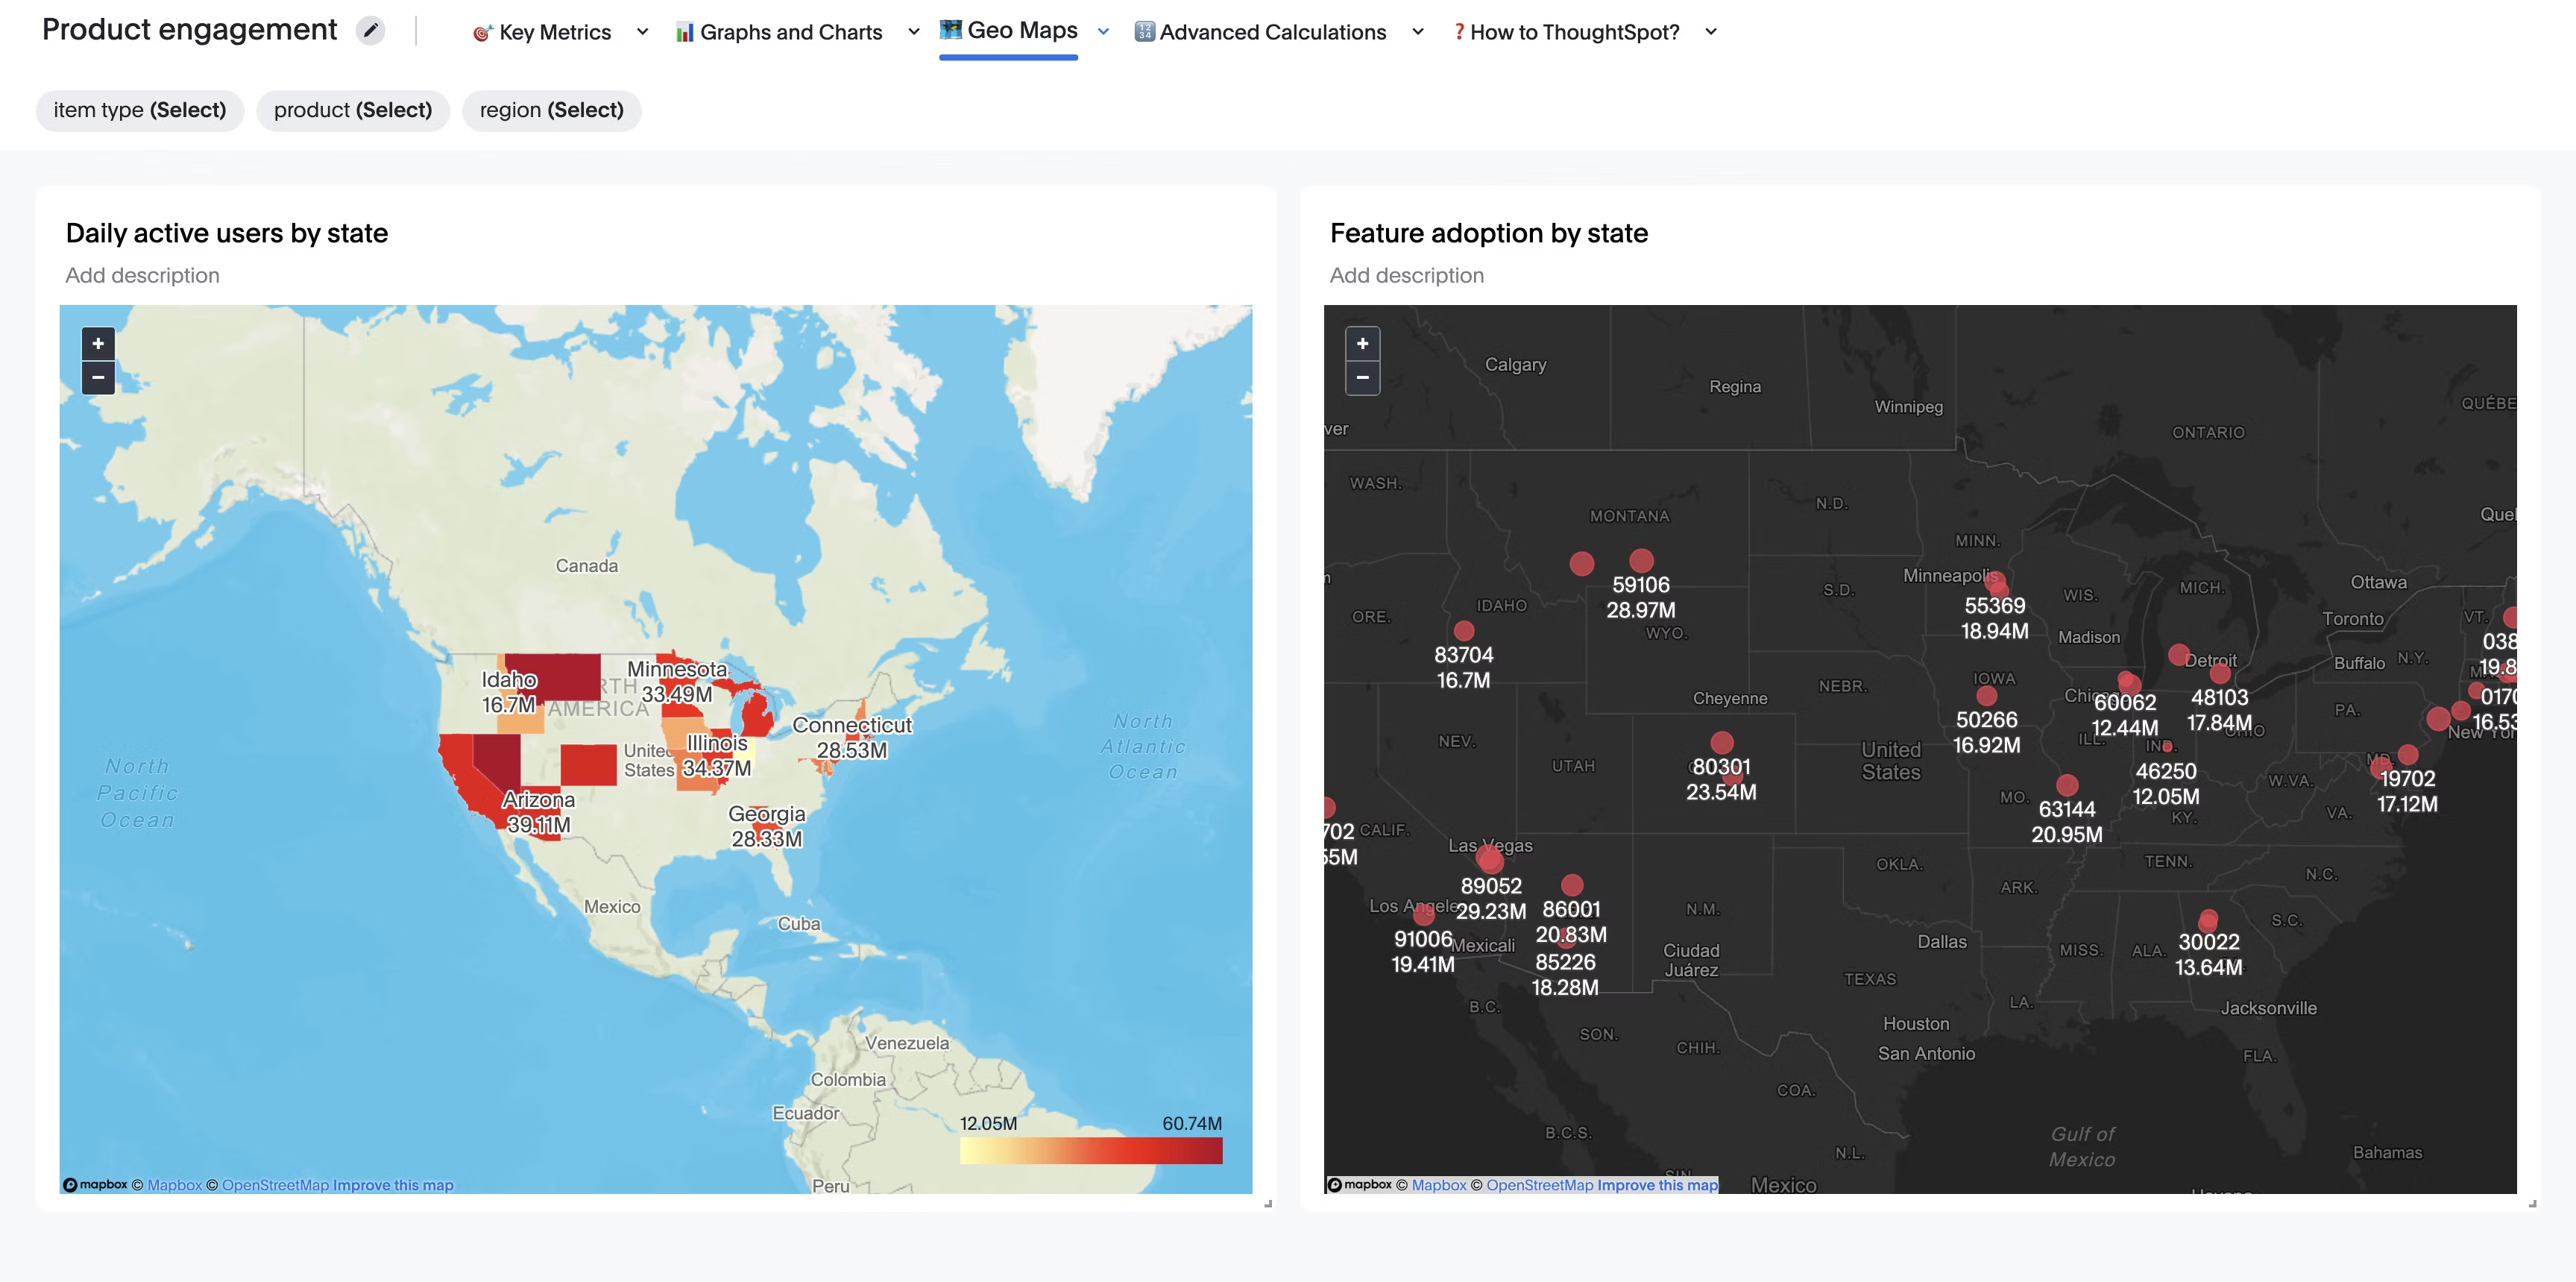
For example, say you're preparing to roll out a new feature globally. Before scaling, you use business analytics to track usage patterns, engagement rates, and feedback by region.
The results?
You spot slower adoption in one market, adjust the onboarding flow, localize messaging, and provide support where it matters most.
Although they are often used interchangeably, there are significant differences between business analytics, data analytics, and business intelligence. Each of these functions plays a vital role in delivering real-time data insights—let’s break it down below:
| Function | Role in the Data Journey | Key Questions Answered |
|---|---|---|
| Data Analytics | Collects, cleans, and transforms raw data into a usable format for further analysis. | - What data do we have? - Is it clean, complete, and accurate? |
| Business Intelligence (BI) | Visualizes processed data through dashboards and reports to track performance and trends. | - How are we performing? - What are the trends? - Are we meeting KPIs? |
| Business Analytics | Applies business context to the data to drive strategic decisions. | - Why did this happen? - What should we do next? - What if we test the hypothesis? |
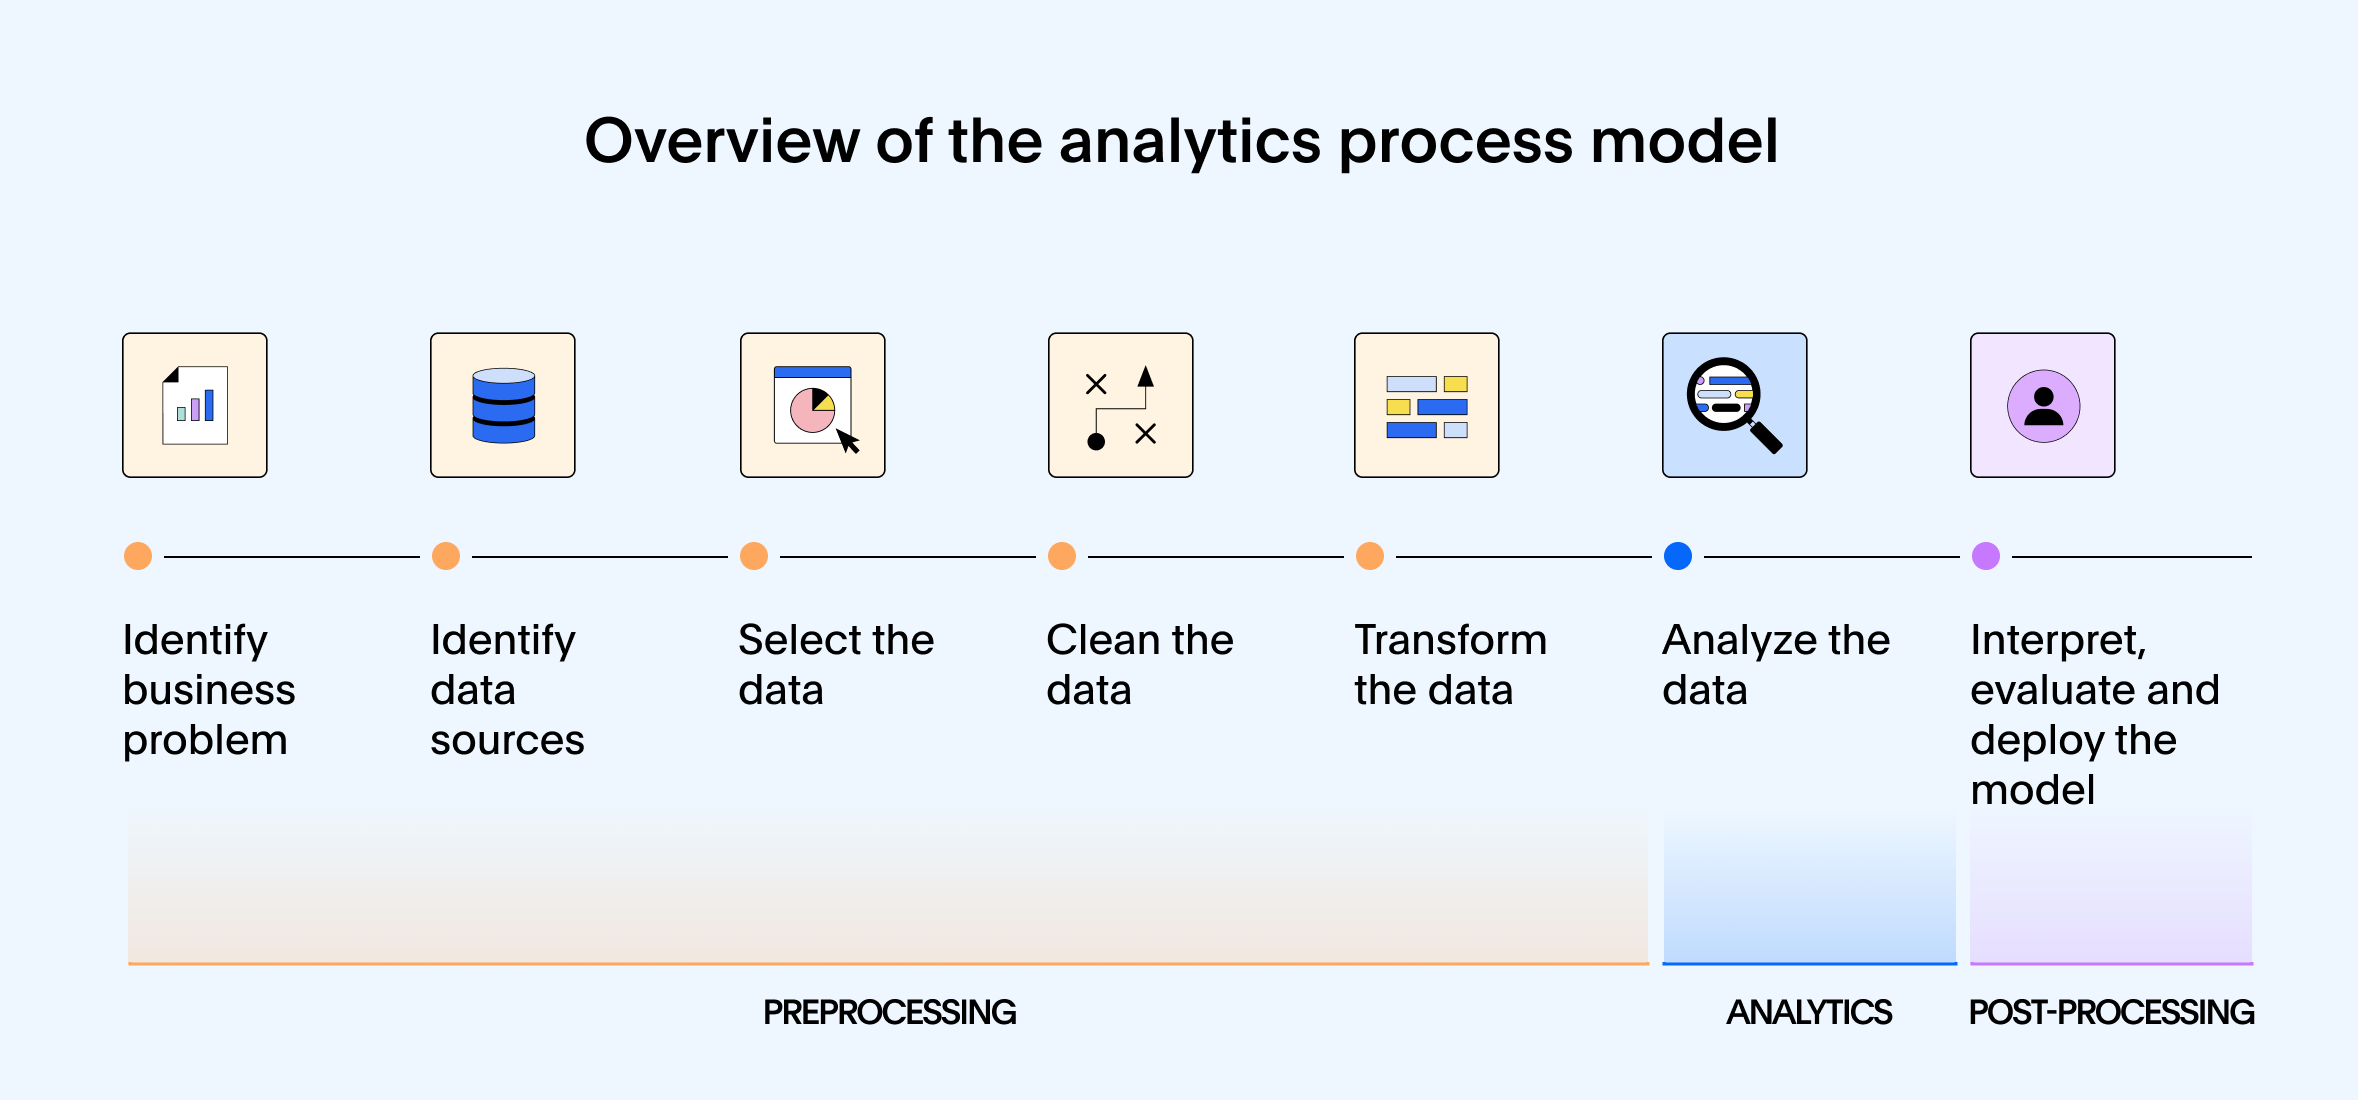
Step 1: Data collection
Imagine your business as a bustling hub. Customer info flows in from your CRM, sales numbers come from your POS systems, marketing platforms track clicks and campaigns, and logistical tools monitor everything from inventory levels to delivery trucks.
Business analytics pulls all this scattered data together into one place, giving you a complete, real-time snapshot of your operations.
Step 2: Data preparation
Raw data can be messy. For example, your sales data might use different formats, and customer records often don’t match across systems. This step cleans and organizes everything, removing duplicates, fixing errors, and filling in missing pieces, so you can trust your numbers and avoid costly mistakes.
Step 3: Data analysis
Now that your data is ready, it’s time to dig in to answer important questions. Let’s say you want to know why sales dropped last month, or which products are gaining traction in specific regions. By applying statistical methods and creating advanced machine learning (ML) models, you can find clear insights into what’s going on.
This is the moment when you stop guessing and start knowing.
Step 4: Visualization and interpretation
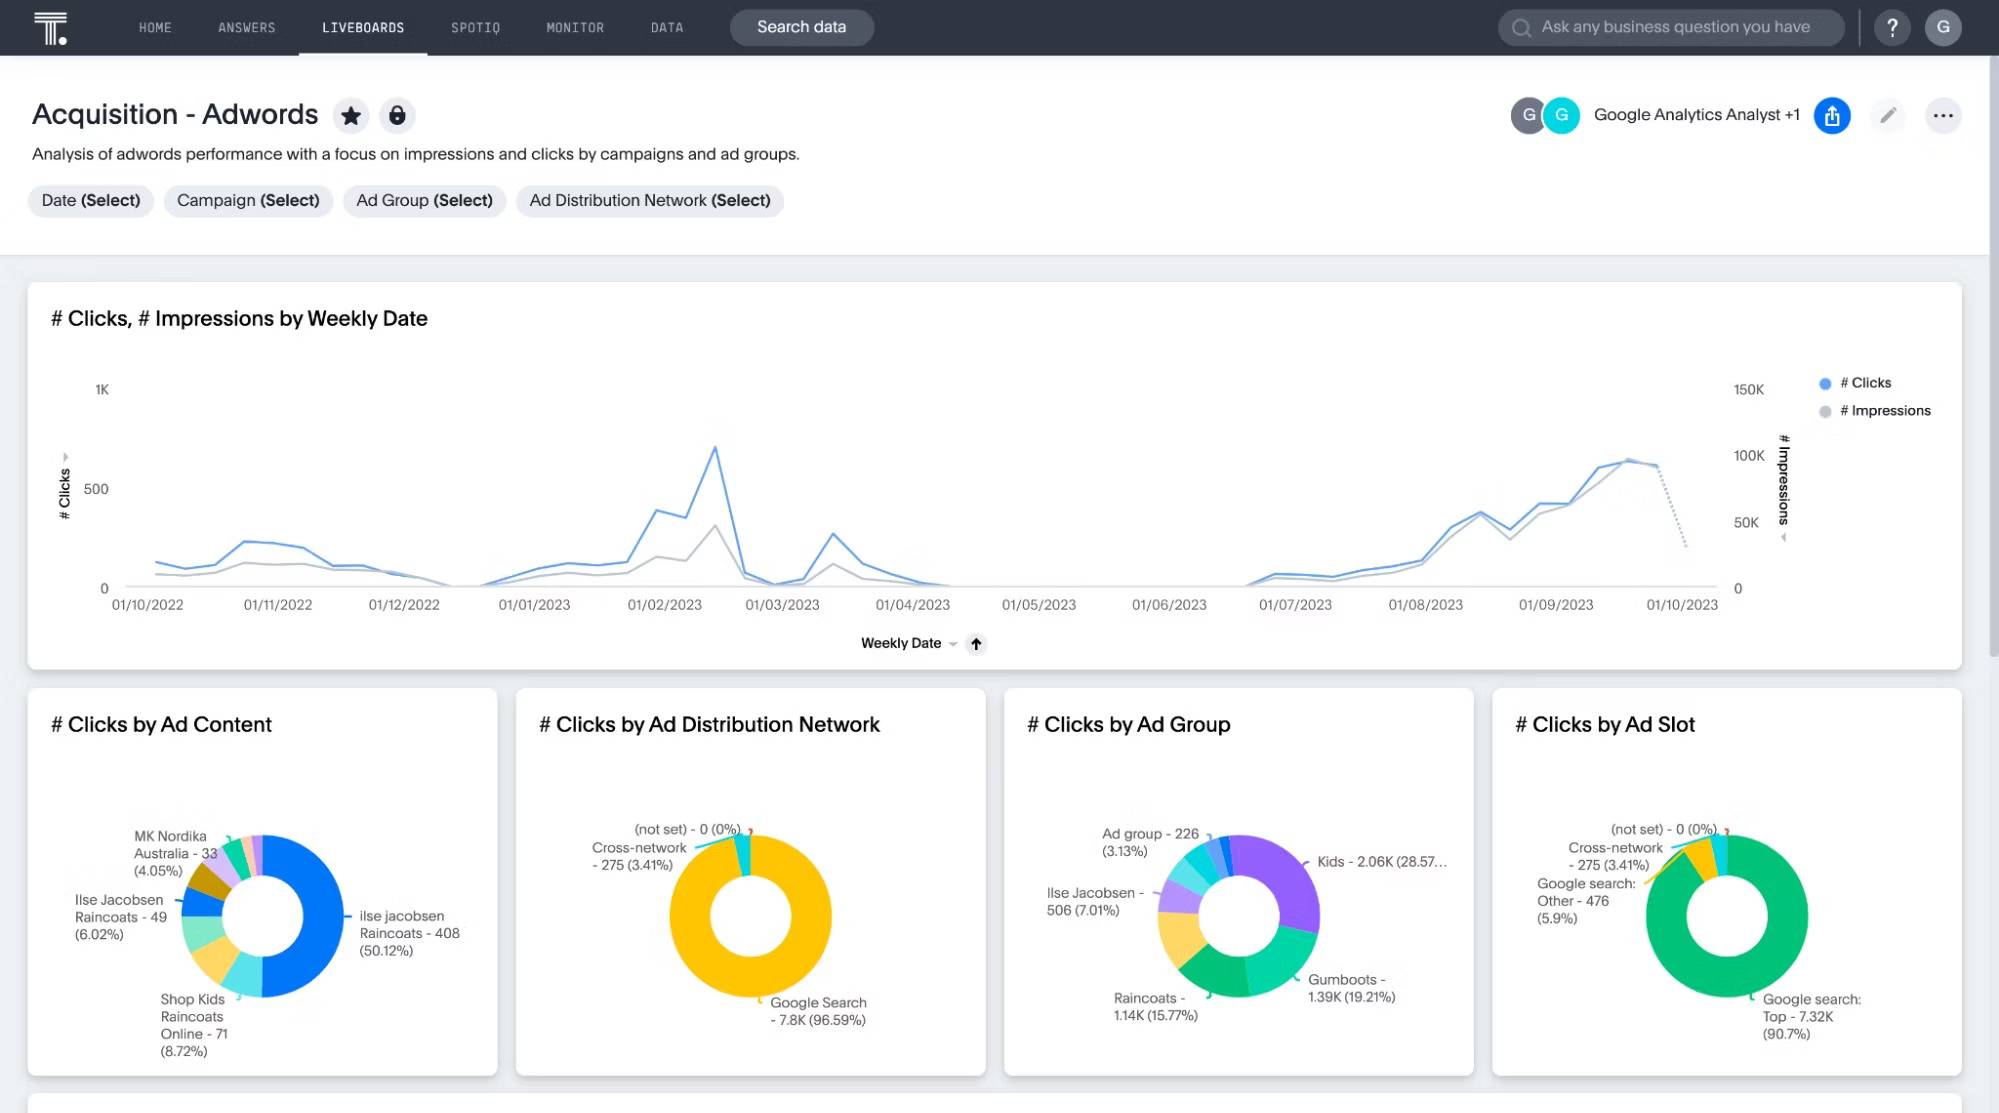
Numbers alone won’t make decisions for you. With business analytics, you can bring your data to life, turning complex figures into clear, compelling visuals. Business analytics dashboards and interactive reports make it easy for everyone, from marketing to operations, to see what’s happening and understand why it matters.
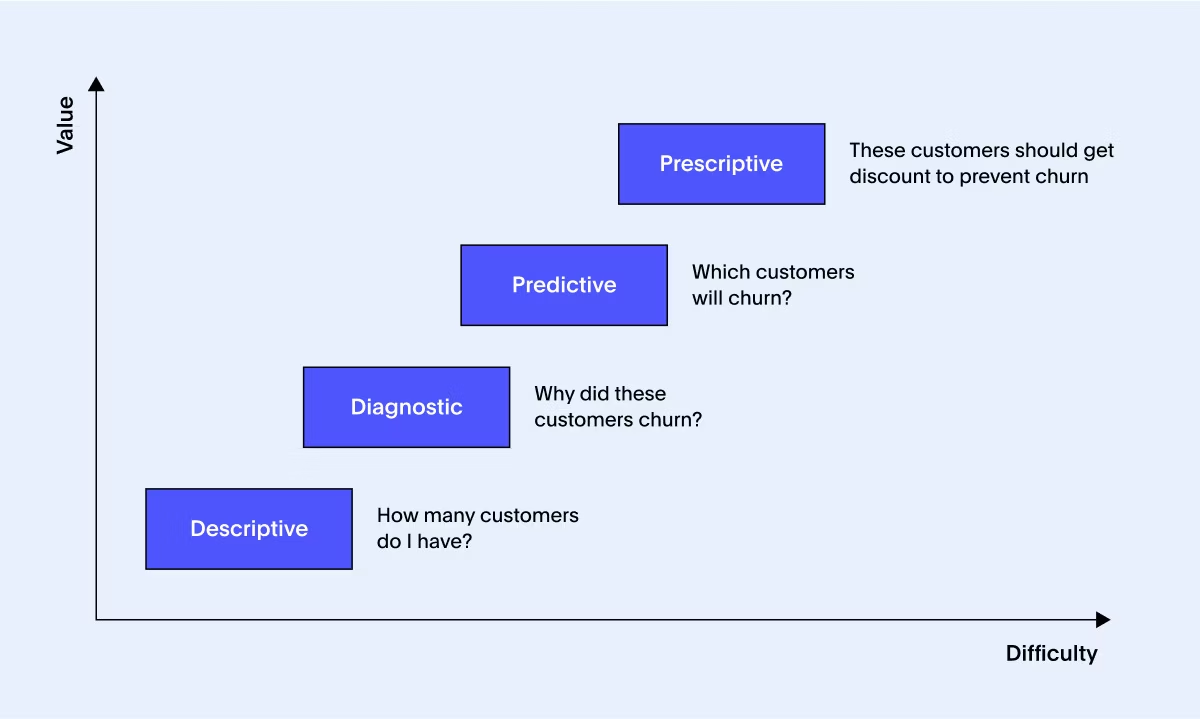
1. Descriptive Analytics
Descriptive analytics looks at your historical data to answer the simple question: ‘What happened?’ Think of the dashboards and reports you check regularly to track sales numbers, website visits, or customer sign-ups. By clearly summarizing past performance, it gives you a solid foundation to understand your current position and identify areas that need attention.
2. Diagnostic Analytics
Next, you want to know, ‘Why did it happen?’. Diagnostic analytics digs beneath the surface to uncover patterns and root causes. Instead of spending hours chasing down answers, you get tools that let you explore your data interactively, pinpointing exactly why sales dipped or what made a campaign successful.
3. Predictive Analytics
Now it’s time to look forward. Predictive analytics uses machine learning to forecast ‘what might happen next’. Will customers churn? How will sales trend next quarter? How much inventory will you need? These insights become even more powerful when backed by AI analytics, which enhances model accuracy and speed.
Predictive analytics tools also help you plan smarter and stay one step ahead of competitors.
4. Prescriptive Analytics
Knowing what might happen is just the start. Prescriptive analytics answers ‘What should we do about it?’ It delivers actionable recommendations based on your data. For instance, it can trigger follow-up tasks if a region is underperforming or suggest marketing tactics proven to work in similar scenarios, helping you take confident, effective action.
These four layers combine to give you a full picture of your business, empowering you to understand historical trends, anticipate what’s next, and make confident decisions.
Data analysis isn’t just about crunching numbers—it’s about turning those numbers into powerful insights that fuel real business growth. To do this well, companies rely on a mix of tools for business analytics. Let’s break down the most essential ones:
Data mining
Think of data mining as your go-to tool for discovering hidden patterns, outliers, correlations, and trends. Techniques like clustering, classification, and anomaly detection help you dig deep beneath the surface to reveal those ‘aha’ insights that drive smarter decisions.
Data warehousing
Your data warehouse is the heartbeat of your analytics ecosystem—a centralized hub where data from apps, IoT devices, social media, and spreadsheets all come together in perfect harmony. It keeps your data clean, organized, and ready for deeper analysis.
Data visualization
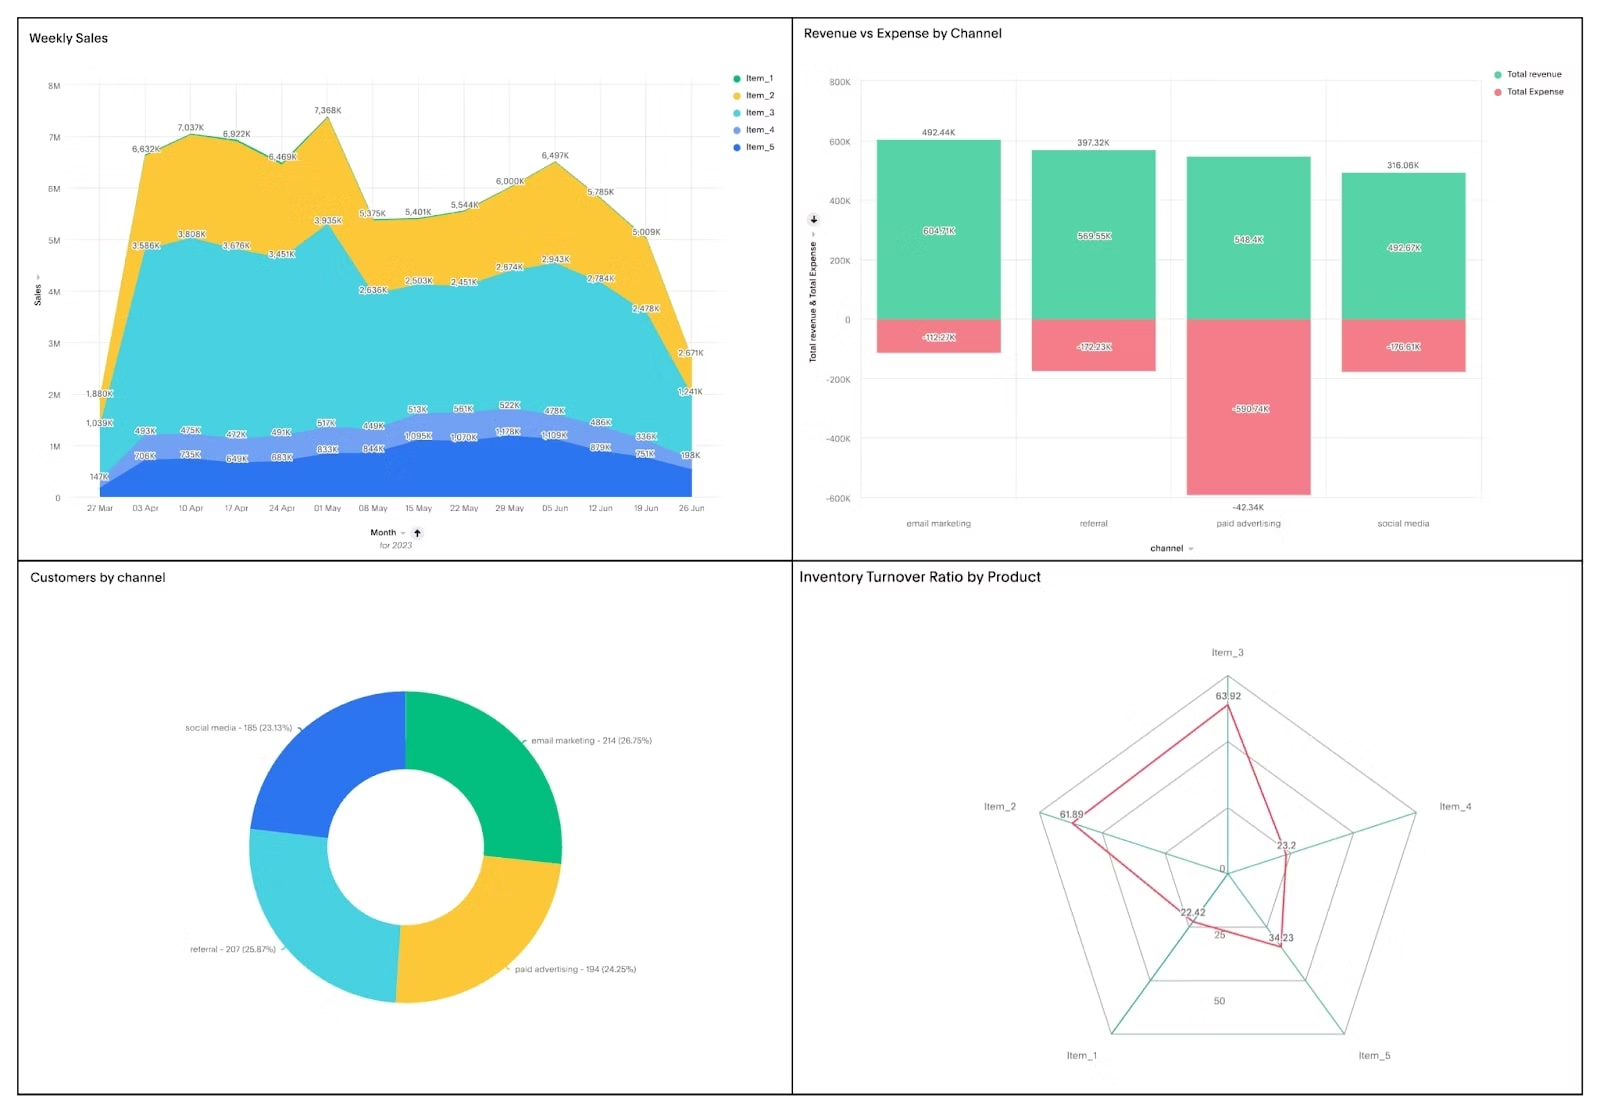
Sometimes a chart says more than a thousand rows of data. These visualization tools turn complex data into eye-catching charts, graphs, and dashboards that make insights instantly clear, helping you communicate those insights to anyone, no matter their data background.
Forecasting
Think of forecasting as your business’s crystal ball. It uses historical data and current trends to predict what’s coming next—whether that’s next quarter’s revenue, customer demand shifts, or inventory needs.
Machine learning algorithms
These smart AI programs learn from your data. From predicting future customer behavior or spotting unusual demand patterns, machine learning helps you generate insights faster and often more accurately than traditional methods.
Statistical analysis
Behind every solid insight is sound statistics. By testing hypotheses, finding correlations, and applying rigorous methods, statistical analysis makes sure your decisions are backed by solid, trustworthy evidence.
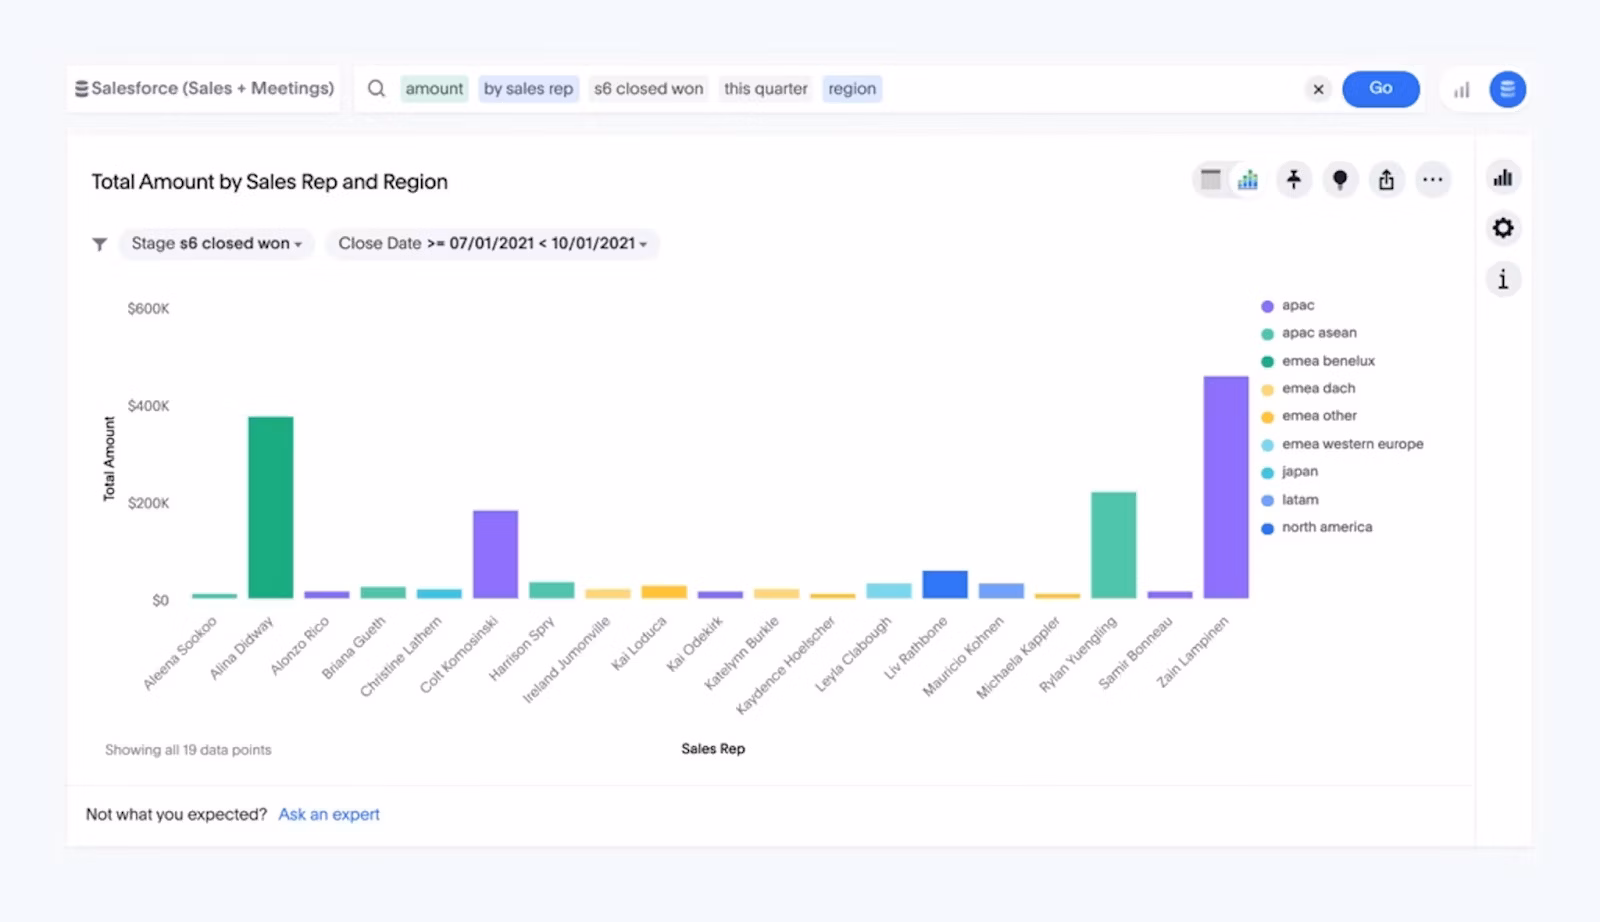
Improving sales team performance
As a sales leader, you face the challenge of making sure every rep hits their targets. But the reasons behind missed goals can be complex. Maybe one rep is struggling with low-quality leads, while another excels at closing but gets bogged down moving deals through the pipeline.
Business analytics gives you a clear, detailed view of each rep’s sales performance metrics, helping you identify the real blockers holding your team back. With real-time data flowing in from across your business, you don’t have to wait for end-of-month reports or gut-checks.
The moment something shifts, like a spike in churn, a drop in engagement, a supply chain hiccup, you see it as it’s happening.
With these insights, you can deliver targeted coaching and optimize lead distribution, empowering your team to consistently surpass their goals.
Going beyond vanity metrics
Marketing metrics are everywhere—clicks, impressions, engagement rates. But do they really tell the full story?
Business analytics connects the dots between campaign activity and real business outcomes. It shows you not just who opened your email, but who actually converted. Not just who visited your site, but who became a loyal, long-term customer.
Also, with techniques like variance analysis, cost benchmarking, and root cause analysis, business analytics shows you where marketing dollars are getting stuck. This full-funnel visibility is what turns marketing from a cost center into a powerful revenue driver.
Planning your budget with clarity
Budgeting shouldn’t feel like a shot in the dark.
With business analytics, you move beyond last year’s numbers and hopeful guesses. Instead, you build budgets grounded in real-time trends, precise forecasts, and a deep understanding of what’s driving revenue.
These insights help you reallocate talent, eliminate waste, and renegotiate vendor contracts before small inefficiencies turn into major expenses.
Whether you’re planning headcount, reallocating spend, or modeling growth scenarios, analytics provides the precision finance teams need to pivot quickly and make smarter decisions.
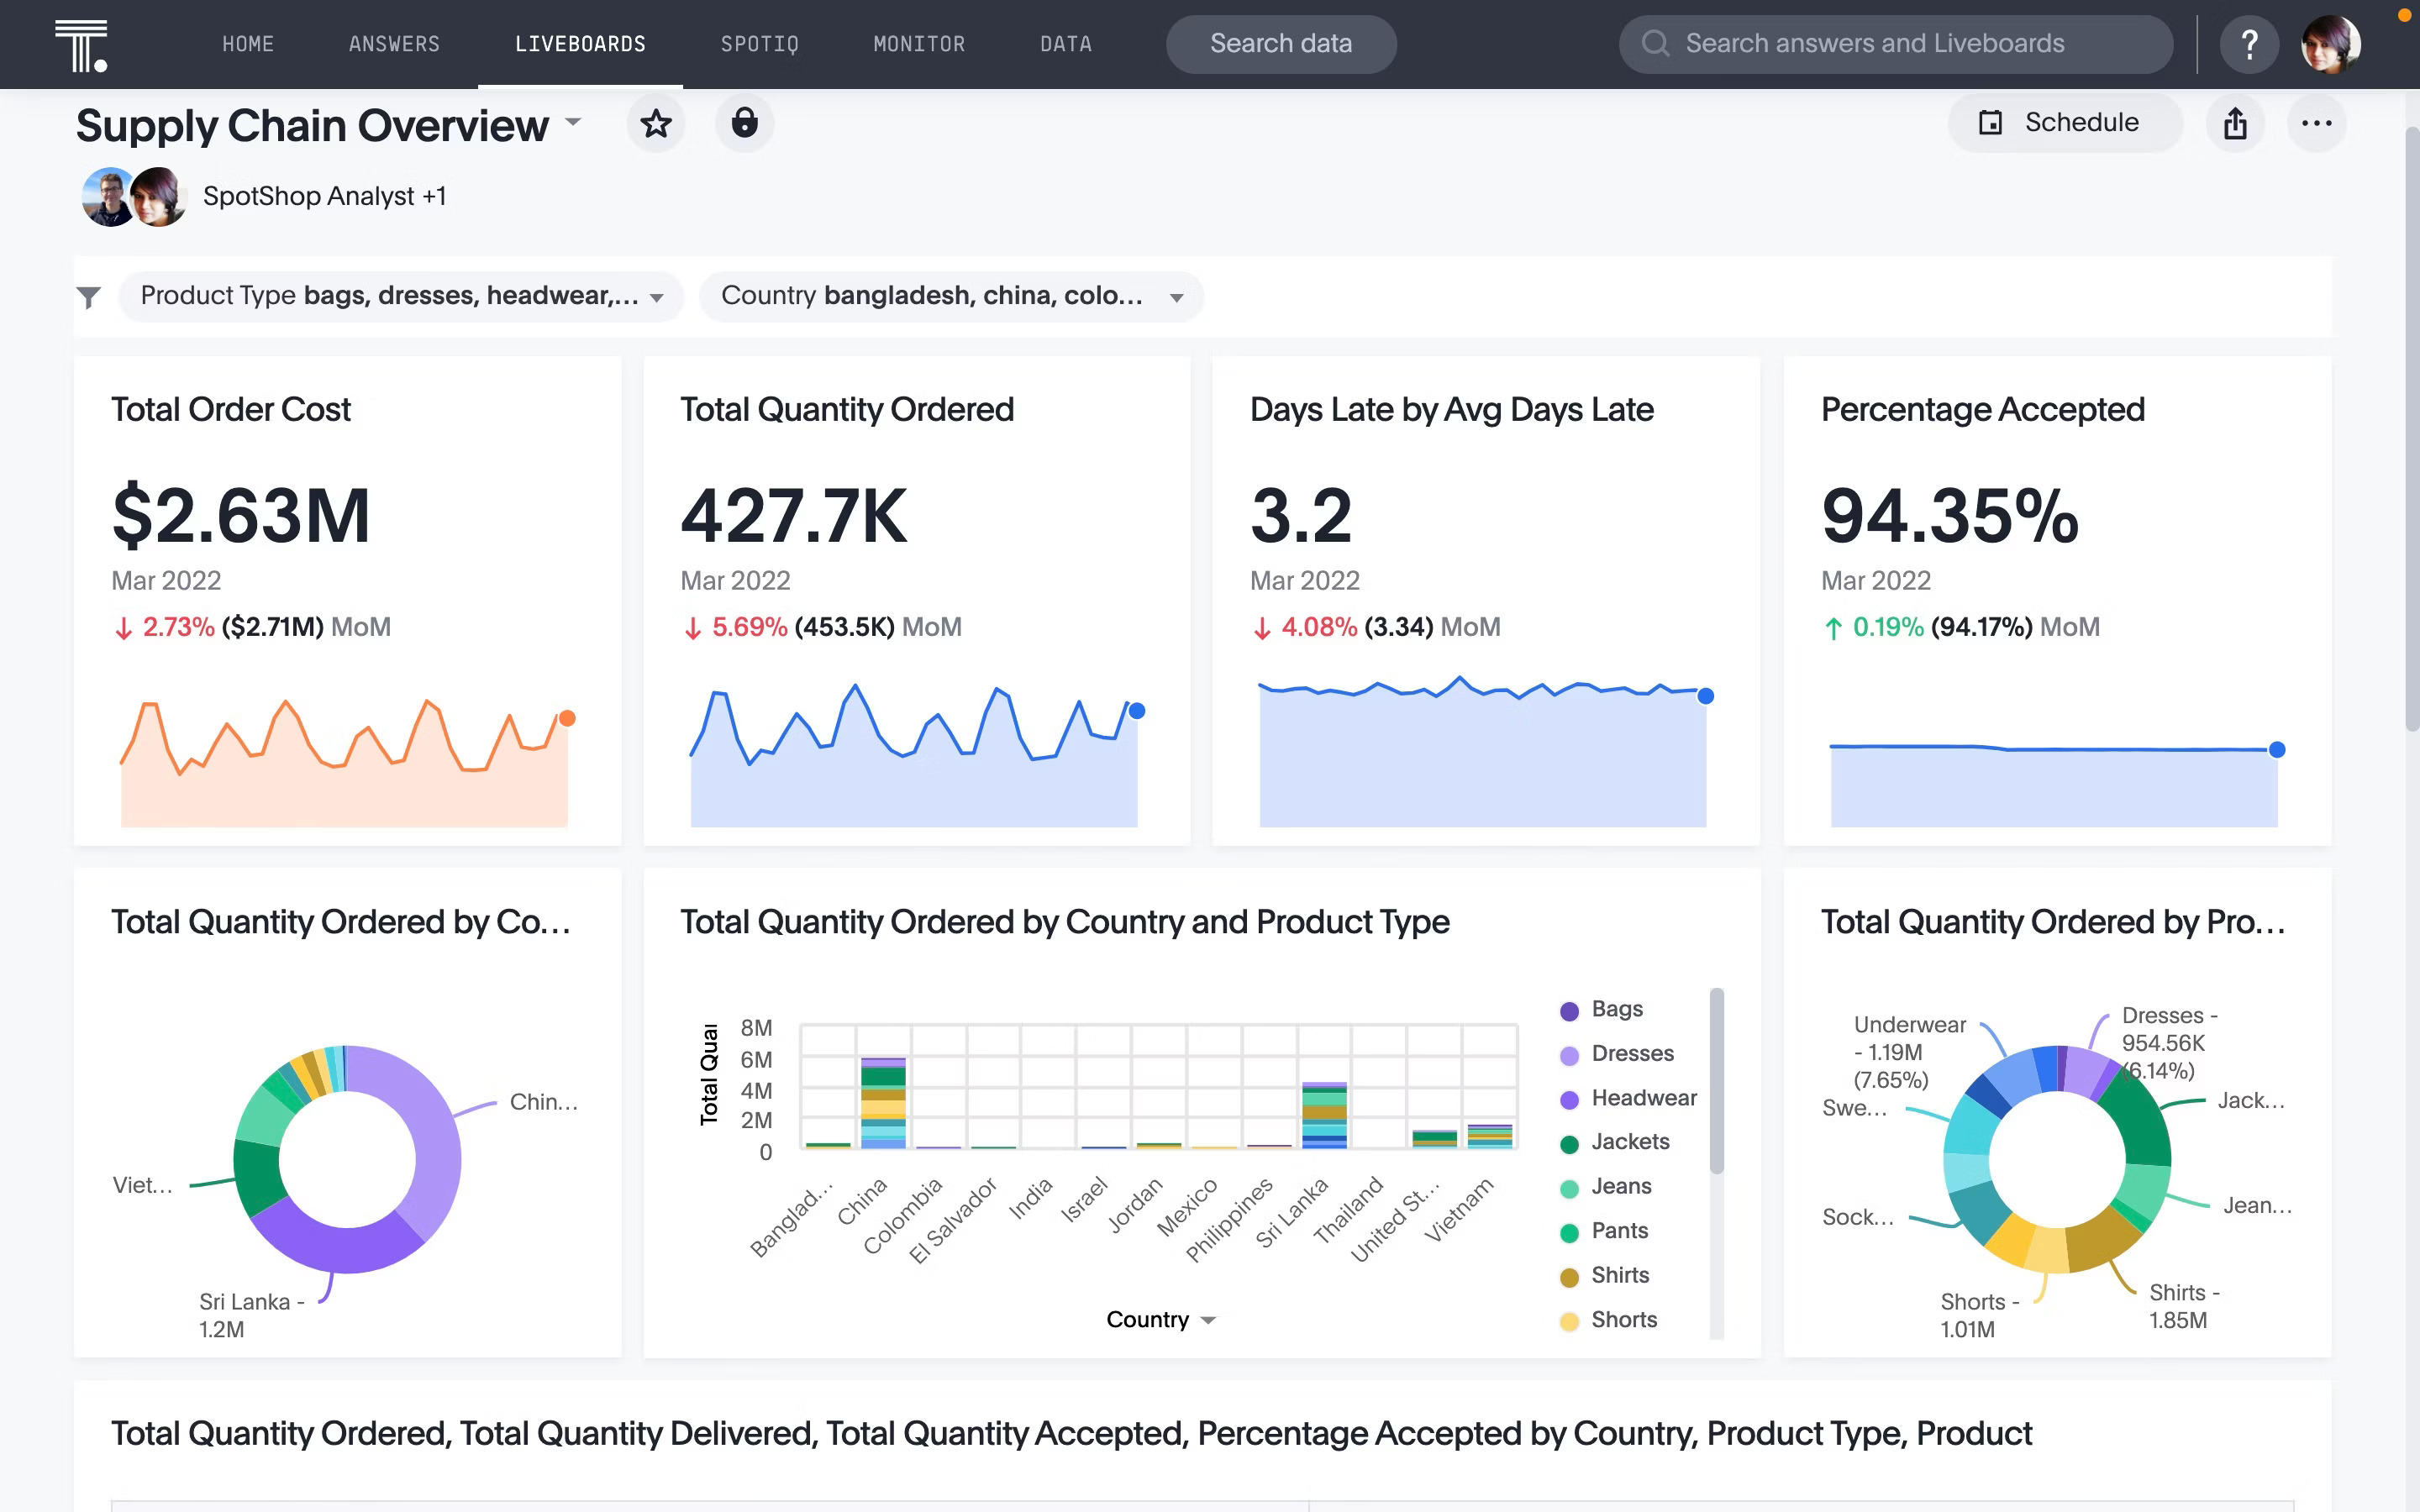
Streamline operations
Every inefficiency has a ripple effect. Maybe it’s overstocked inventory in slow-moving regions. Or a supply chain delay that’s dragging down service levels.
Business analytics helps you spot friction points before they cost you. With AI-powered insights, you can adjust staffing on the fly, shift resources to high-impact areas, and eliminate bottlenecks, keeping operations lean, agile, and resilient.
Instead of guessing what to build next, you know exactly where to focus and why. That’s how leading brands stay relevant.
💭Curious what else business analytics can do? Dive into the full guide here.
Stop letting data overwhelm your teams
Every minute wasted on disconnected reports is a minute your competition uses to take the lead.
Now imagine a smarter way—an AI-powered experience that delivers personalized, actionable insights directly to everyone, exactly when they need them.
This isn’t some far-off future. It’s happening right now.
With ThoughtSpot’s Agentic Analytics Platform, you can gain real, contextual answers inside a conversational interface. Ask questions in natural language, drill deeper, and embed autonomous agents in the tools you and your team use every day.
Your data holds the answers. Are you ready to unlock them? Start your demo today.
What does business analytics do?
Business analytics gives you a clear view of what’s happening in your business, why it’s happening, and what steps to take next. By pulling data from every corner of your business, it reveals patterns, trends, and insights that help you make smarter decisions.
Can business analytics be used by non-technical teams?
Not anymore. Many business analytics tools offer drag-and-drop interfaces and natural language search, making it easy for non-technical users to build reports, create dashboards, and explore data on their own.
What are the four types of business analytics?
Business analytics comes in four main types—each helping you turn data into smarter decisions. Descriptive analytics shows what happened. Diagnostic analytics explains why it happened. Predictive analytics looks at what’s likely to happen next. And prescriptive analytics suggests what to do about it.
How does business analytics help with forecasting and planning?
Business analytics leverages historical sales data, seasonal trends, market indicators, and customer behavior patterns to create predictive models. These models forecast future outcomes like sales growth or demand shifts, helping you plan budgets, inventory, and strategies with confidence.


