


Sometimes, what you think you know is just the tip of the iceberg. Think about a coffee shop. You might think people stop by just for their caffeine fix. But when you dig deeper, it’s the cozy vibe, the friendly faces, and that sense of community that keep them coming back.
Business data works the same way. While reports show you the obvious, real value comes from digging deeper—asking follow-up questions, testing hypotheses, and following your curiosity until it leads you to insights that actually matter.
If you’re tired of staring at reports that give you half-baked answers, this data exploration guide will help you dig deeper into your data and find insights that actually move the needle.
Table of contents:
Data exploration is a critical step in analytics, helping you understand patterns, detect anomalies, and prepare data for deeper analysis. By using visualization tools and statistical techniques, you get a clearer view of how different data points, files, and tables relate to each other.
Think of it this way: You’ve just pulled data from multiple cloud sources into your BI platform. Instead of jumping straight into creating reports, you take time to explore your data. You scan for outliers, fill in missing values, and start connecting the dots between customer behavior, product performance, and campaign results.
Here are some of the most valuable ways business teams use data exploration to drive smarter decisions:
Identifying customer churn drivers
Noticing a dip in customer engagement? Patterns like drop-offs, login frequency, and rising support tickets can reveal early signs that something’s not working, giving you time to pivot before small issues turn into churn.
Segmenting users by demographics
Not all customers want the same thing. By breaking down users by age, location, or industry, you can spot differences in customer preferences. This lets you personalize onboarding, helping you better connect with each group.
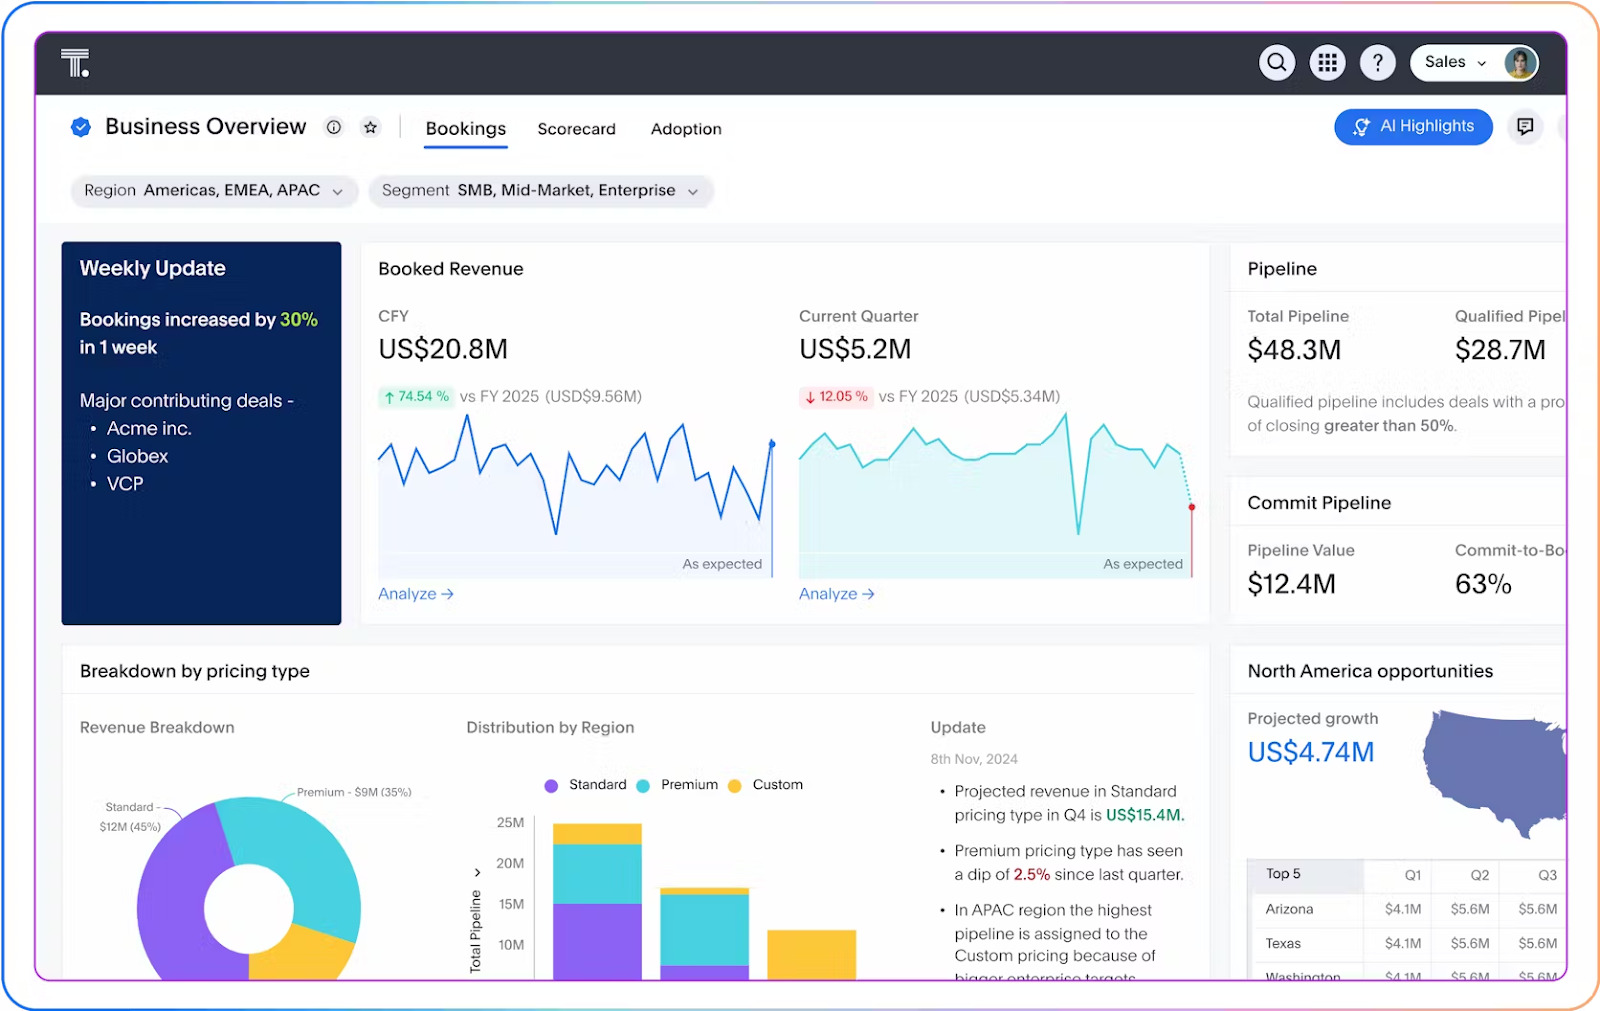
Understanding sales pipeline health
Keeping your pipeline healthy isn’t just about tracking deals; it’s about giving your team the insights they need to close. By proactively monitoring your sales data, you can spot what’s slowing down deals and take action before it hurts your bottom line.
Exploring product usage trends
Looking at how customers use your product can reveal a lot—what features they love, what doesn’t add value, and where exactly they struggle. These insights can create targeted strategies that drive real adoption.
Faster, smarter decision-making
In today’s data-driven world, relying on intuition alone is risky. Data exploration gives you the clarity and confidence you need to make smarter decisions. Instead of basing your strategies on hunches, you drill into what’s happening in your business, gain fresh perspectives, and turn insights into action.
Say your sales team is closing fewer deals this month. Instead of guessing, you look into your data and spot a trend: most of the dropped deals are coming from one specific region. With that insight, you can quickly adjust your strategy, roll out targeted incentives, and course-correct before it impacts your numbers.
Now, you're not just reacting—you’re making moves backed by real evidence.
Driving operational excellence
With data exploration, you get a hands-on view of what’s really happening behind the scenes. By digging into patterns, trends, and outliers, you gain real-time insights across operations, customer behavior, and key performance areas.
For instance, exploring your inventory data might reveal that certain products consistently sell out faster in specific regions, while others barely move.
This discovery doesn’t just lead to better distribution, it sparks smarter questions like Are we marketing differently by region? Should we rethink our stocking strategy altogether?
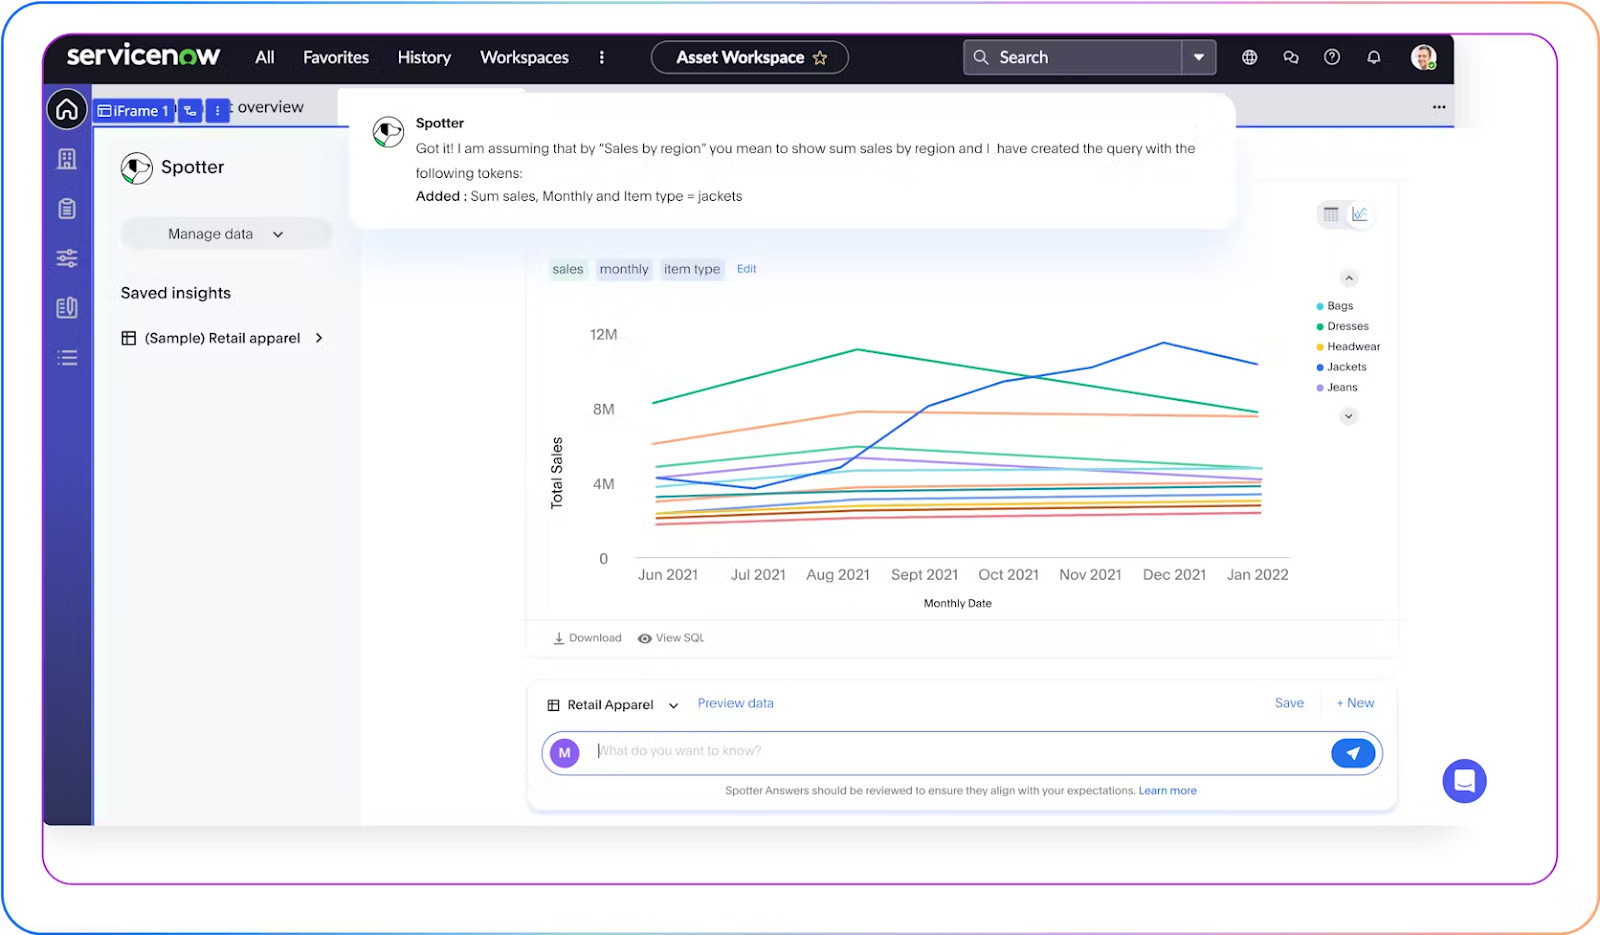
With ThoughtSpot’s Spotter, turning these discoveries into real answers is as simple as typing them out. Ask a business question, and get instant, actionable insights in seconds.
Armed with this clarity, you can make smarter calls on where to invest your resources and how to deliver stronger returns across the board.
Building a competitive advantage edge
In a global market, staying competitive means understanding your customers better than anyone else. By analyzing your customer data more proactively, you can see which segments are worth prioritizing and where friction is slowing down the journey. This kind of agility allows you to deliver the services your customers actually need, helping you stand out in a crowded market.
Picture this: A prospect is ready to buy, but the back-and-forth with your sales team drags on. Too many emails, unclear next steps, and slow responses create a frustrating experience.
But when you take time to explore your sales data, looking at deal velocity, stalled stages, and follow-up patterns, you start spotting where things break down. The result? A smoother buying journey and a much higher chance of sealing the deal.
The takeaway is simple: Data leaders who encourage proactive use of data across all teams aren’t just moving faster, they’re reshaping customer expectations and building a solid competitive advantage.
Data exploration looks different for everyone, it really depends on what your goals are. But at the heart of it, it’s all about one thing: turning raw data into actionable insight.
Here’s what that usually looks like in practice:
Step 1: Connect your data
First things first, gather your data. Whether it’s sitting in spreadsheets, cloud warehouses, or other tools, bring it all together so you can see the full picture.
Step 2: Prepare your dataset
Next, tidy up your dataset. Fill in missing values, fix inconsistencies, and organize the structure so it’s ready for advanced analysis.
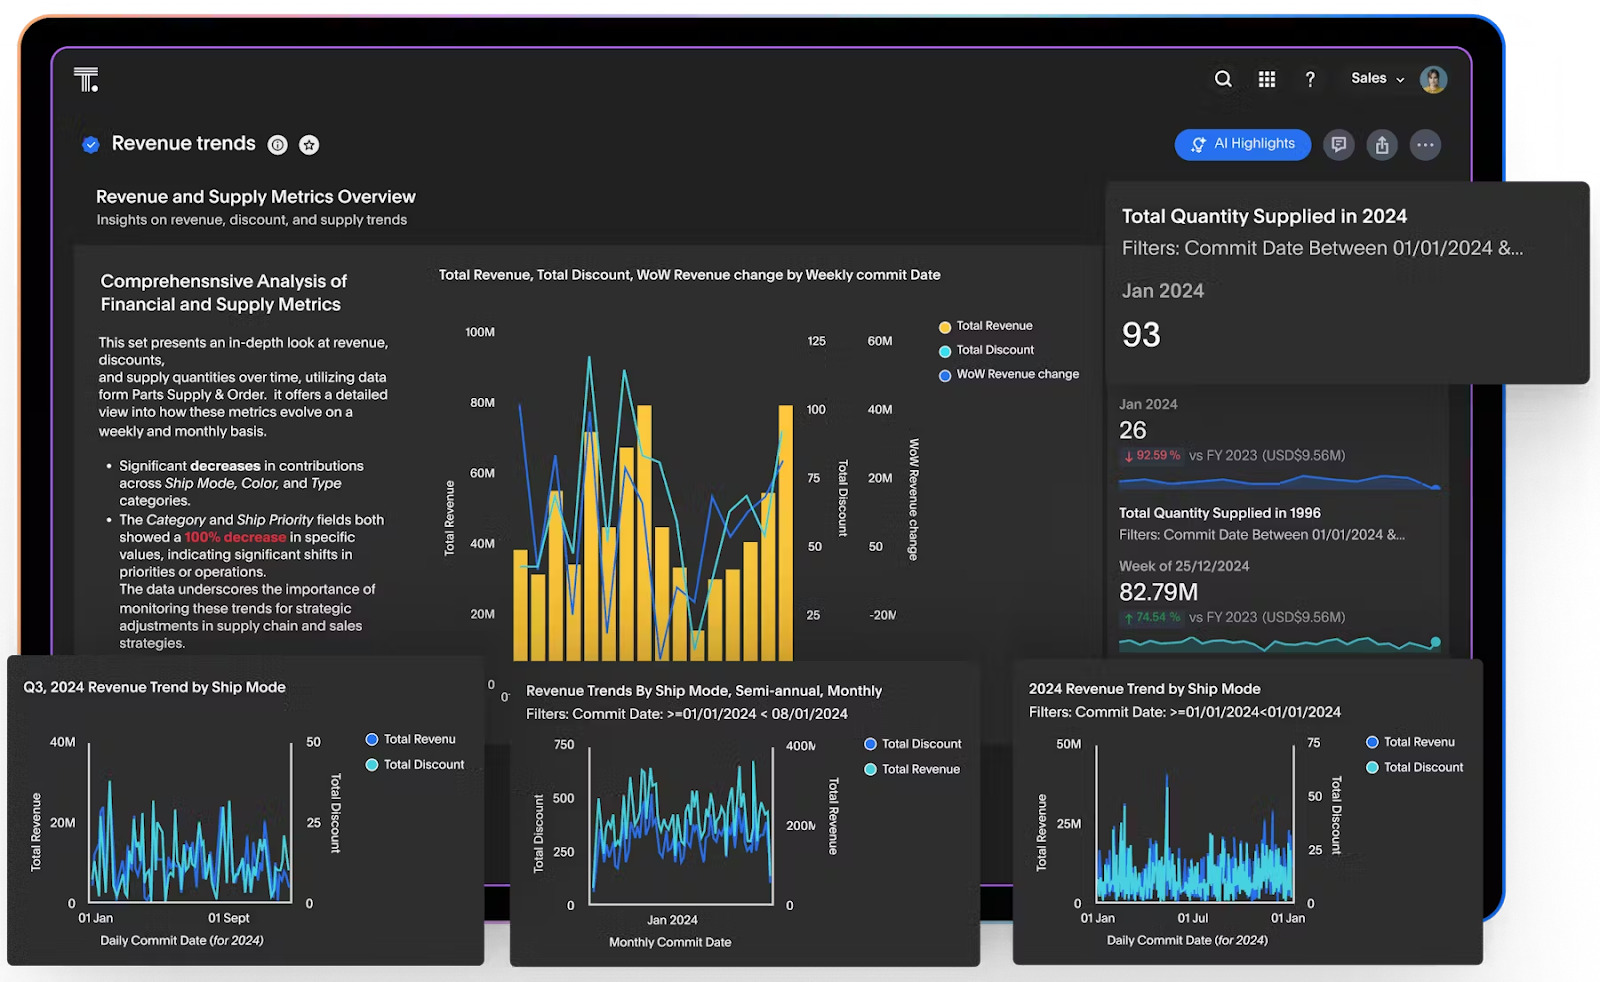
Step 3: Explore distributions and trends
Now comes the fun part. Use data visualization tools like charts and graphs to identify trends, spot outliers, and see what story your data is trying to tell you.
Step 4: Test hypothesis
For deeper exploration, use filters, comparisons, segment analysis, and drill-downs to test your assumptions directly against the data. This is how you move from guessing to truly knowing what’s going on.
Step 5: Share findings
Finally, get the insights in front of the people who need them. Whether it’s via Slack, Teams, email, or embedded dashboards, make sure your visual stories are easy to access, understand, and act on.
Until recently, analysts basically lived inside spreadsheets, forced to wrangle endless rows and columns. Meanwhile, business users were often stuck waiting days or weeks for answers. Simply put, data exploration was a slow, manual, and often frustrating process for everyone involved..
But today’s data exploration tools are built for speed, scale, and easy interactivity. Here’s how using some of these tools can help you make the experience more engaging:
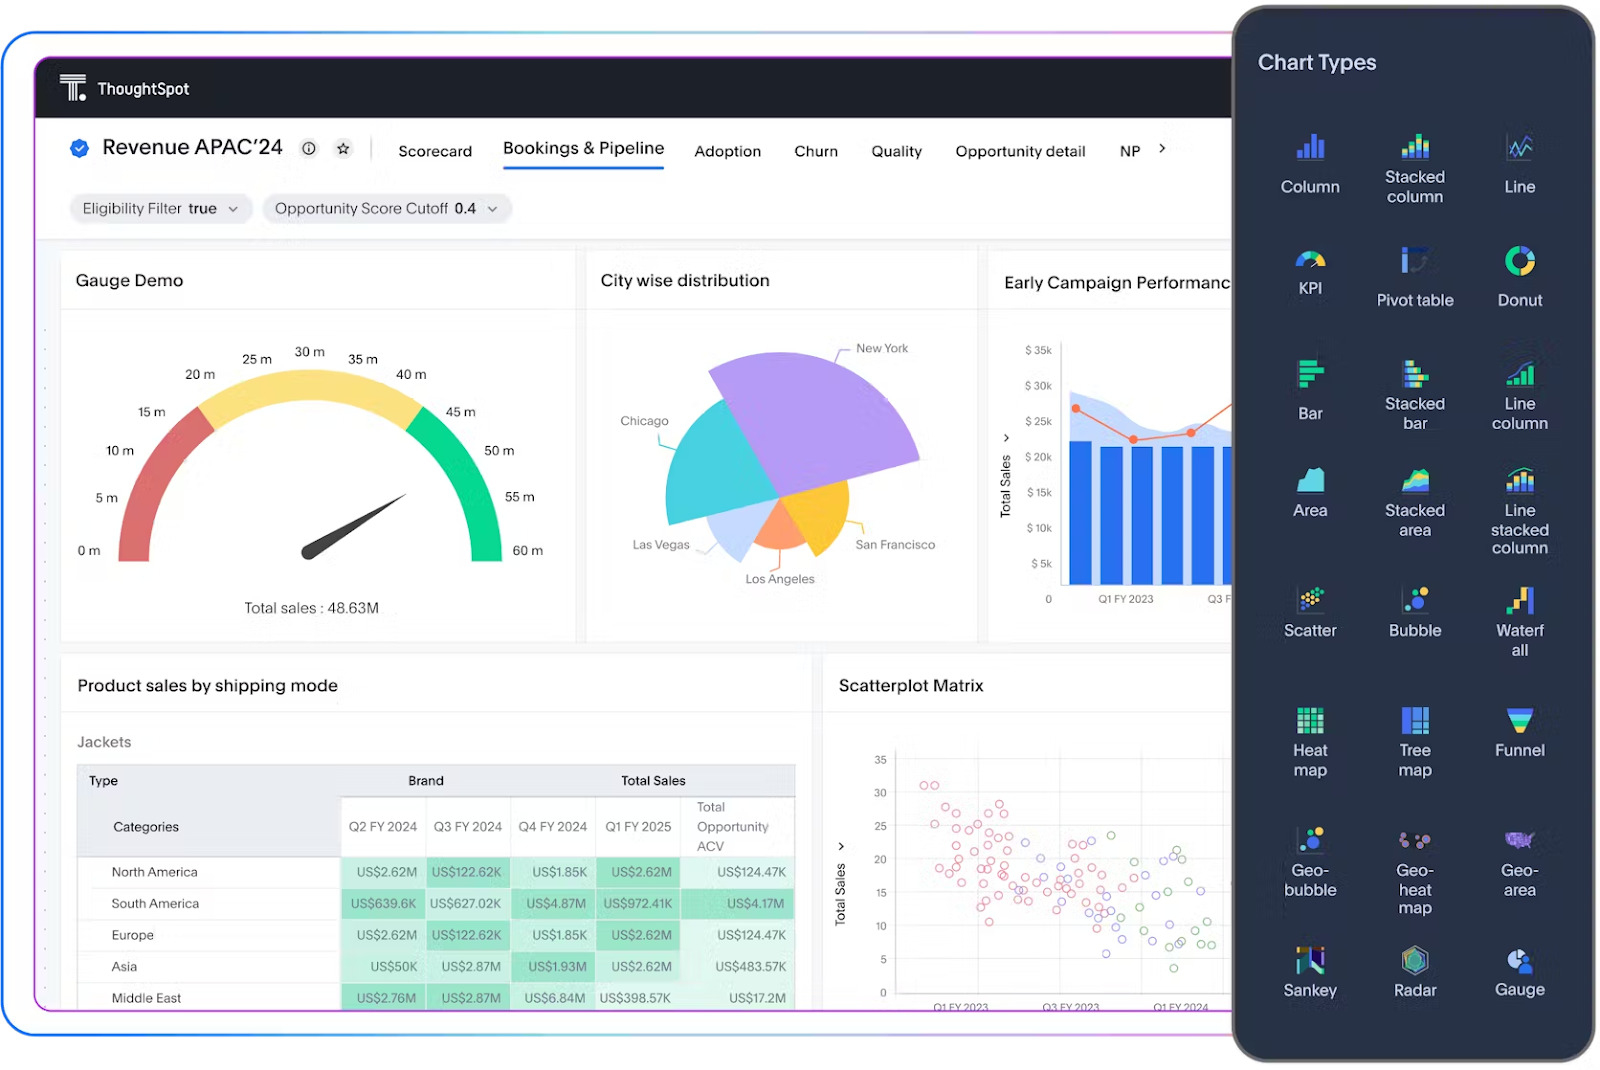
Data visualization tools
These tools turn complex datasets into clear, interactive visuals—making it faster and easier to spot trends, track KPIs, and find insights across your business. When data is visual, it’s more intuitive and more accessible to everyone.
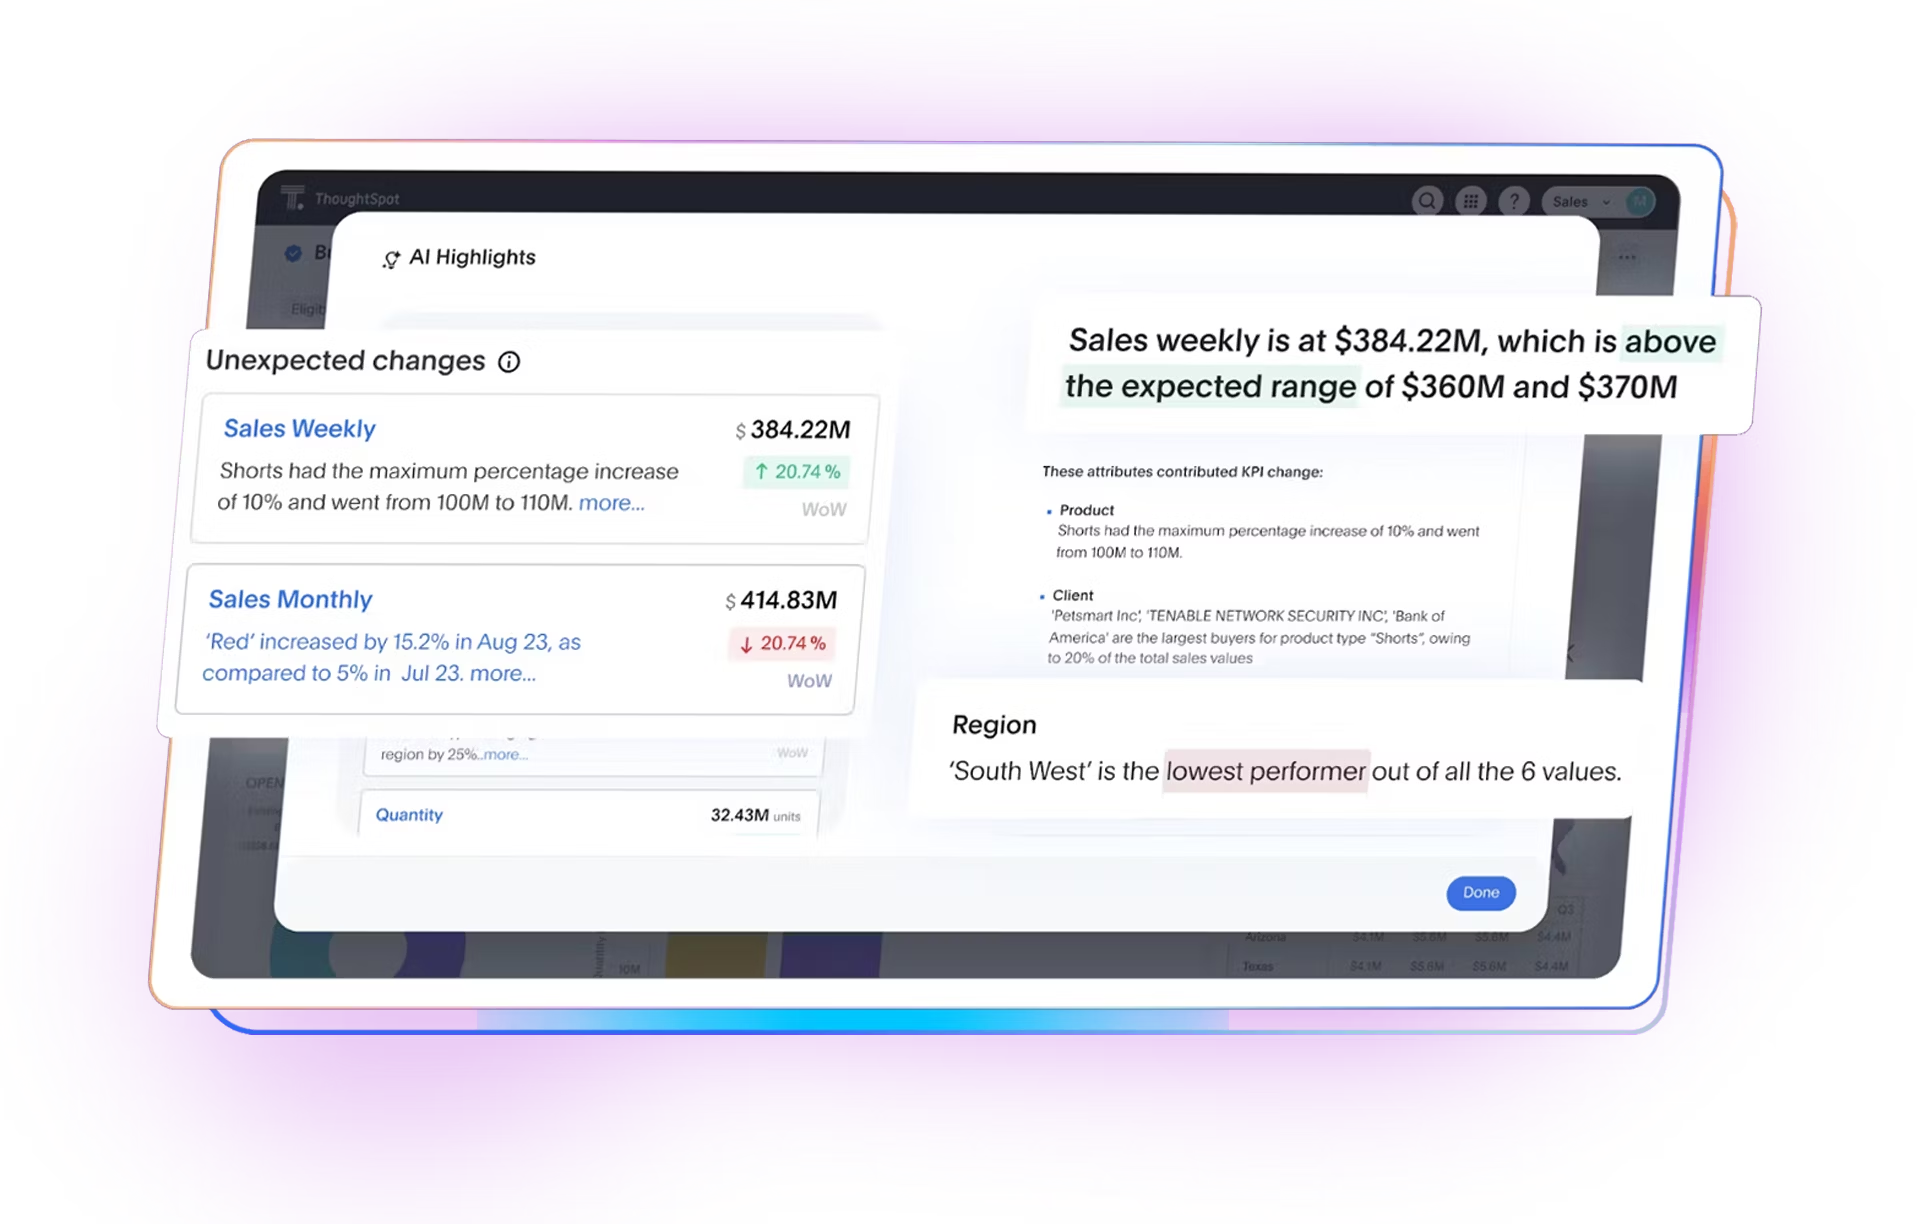
AI analytics tools
These tools use machine learning to surface hidden patterns, predict trends, and even automate anomaly detection. They continuously adapt and deliver deeper, more contextual insights to drive smarter, faster decisions.
For instance, with ThoughtSpot’s Agentic Analytics Platform, you can simply ask a question in natural language and instantly get automated insights that reveal the why behind the numbers. This helps you move from data to decisions in minutes.
Data cleaning tools
Even the most sophisticated analysis will fail if your data is messy. Data cleaning tools help you detect errors, standardize formats, remove duplicates, and fix inconsistencies. They automate the grunt work so your team can trust the integrity of the information.
Embedded analytics tools
Switching between platforms to find answers will only slow you down. Embedded analytics tools bring powerful insights right into the apps you use every day—so you can ask questions, run reports, and make data-driven decisions without ever leaving your preferred tools.
For instance, with ThoughtSpot Embedded, you bring live, interactive insights directly into your apps, so your users can explore, act, and win—without friction.
Low-code SQL builders
You don’t need to be a data scientist to explore your data. Low-code SQL builders allow you to run custom queries through visual interfaces, and no technical knowledge is required. They offer drag-and-drop tools, auto-suggestion features, and intuitive interfaces that speed up exploration, reducing reliance on data teams and democratizing data access to everyone.
And with tools like the Analyst Studio, your team gets the power tools to prepare data for AI and move effortlessly between quick ad hoc analysis and advanced analytics. It’s a collaborative workspace where you can explore your data freely.
Data exploration is a critical lever for growth, but the journey is not always smooth sailing. Without a thoughtful approach, exploration can quickly stall or, worse, lead to misguided decisions.
Here are proven best practices that help you make data exploration faster and more collaborative:
Start with a clear question: Whether it’s comparing performance or investigating the reason behind an anomaly, starting with a clear intent keeps data discovery purposeful.
Maintain data quality: Inconsistent, outdated, or poorly governed data introduces safety risks. Following strong governance practices like encryption and role-based access builds users' trust, allowing them to act confidently on the insights they find.
Embrace agentic analytics: Bottlenecks kill momentum, and users need the ability to explore data on their own terms. With ThoughtSpot’s Agentic Analytics Platform, everyone can search, visualize, and drill into data independently, while IT teams maintain control over data governance, access, and security.
Collaborate across roles and teams: Exploration isn’t a solo effort. The best insights come when technical experts, business leaders, and operational teams work together. Encouraging collaboration helps you accelerate decision-making, democratize data, and create shared ownership of data-driven outcomes.
Make it easy to go from insight to action: Finding an insight is just the beginning; the real value comes when teams can quickly act on it. Embedding exploration tools within operational workflows allows you to trigger actions, send alerts, or update systems based on real-time insights. That’s how you turn exploration into immediate business impact.
Go from data chaos to confident decisions
Put the power of data exploration directly in your users’ hands, and something impactful happens: questions get answered faster, decisions become more confident, and outcomes improve across the board. But to make that leap, you need tools built for speed, simplicity, and real-time insight.
With ThoughtSpot, no matter where your business data lives or how specific your question is, Spotter delivers real-time, contextual answers in an intuitive, conversational experience. It’s like having your own data analyst on demand, so you can ask follow-ups, drill deeper, and discover the insights you need without ever slowing down.
And when you’re ready to dive deeper, tools like Analyst Studio empower you to perform advanced analytics and tackle more complex data challenges seamlessly.
Don’t wait for reports to make decisions. Try ThoughtSpot today and get your answers now!


