


Every business, regardless of size, has a set of metrics you need to track. As you grow and adapt in an ever-changing landscape, having access to this data becomes even more important. By using a dashboard to monitor key performance indicators (KPIs), you can ensure your business stays on target.
If you’re new to KPI dashboards, you’ve come to the right place. In this article, we'll cover the basics, share examples, and show the benefits so you can make the most out of your business data.
A KPI dashboard is a visual tool that provides a snapshot of your organization's performance based on key metrics and performance indicators. It serves as a centralized platform to monitor, analyze, and display KPIs in real-time. Presented in an easily understandable format, KPI dashboards allow you to assess and make data-driven decisions quickly. These diverse dashboards—or as we call them, Liveboards—can cater to different departments and levels within your organization.
Table of contents:

An executive KPI dashboard is a high-level performance monitoring tool tailored for executives. The goal is to offer a comprehensive snapshot that enables executives to make informed decisions regarding the overall direction and health of the organization.
The key metrics that are commonly included in the executive KPI dashboard are:
Revenue growth: Percentage increase in revenue over a specific period
Profit margins: Gross, operating, and net profit margins
Customer satisfaction: Customer satisfaction scores or net promoter score (NPS)
Customer acquisition cost (CAC): Cost to acquire a new customer
Employee engagement: Employee satisfaction or engagement scores
Sales growth: Percentage increase in sales over a specific period
Return on investment (ROI): The profitability of an investment
The operational KPI dashboard is a day-to-day management tool designed for middle management and operational teams. This dashboard often incorporates efficiency, production, inventory planning, and resource utilization metrics. With the primary purpose of providing actionable insights, these metrics help teams streamline processes, identify bottlenecks, and optimize daily workflows.
The key metrics that are commonly included in the operational KPI dashboard are:
Efficiency ratio: Measures how well resources (time, money, etc.) are utilized to produce output
Production output: Quantity of units produced or services delivered.
Inventory turnover: Measures how quickly inventory is sold or used within a specific period
Cycle time: Time taken to complete a specific process or task
Quality metrics: Measures of product or service quality, such as defect rates or customer complaints
Customer service metrics: Average response time, resolution time, or customer satisfaction scores for support inquiries
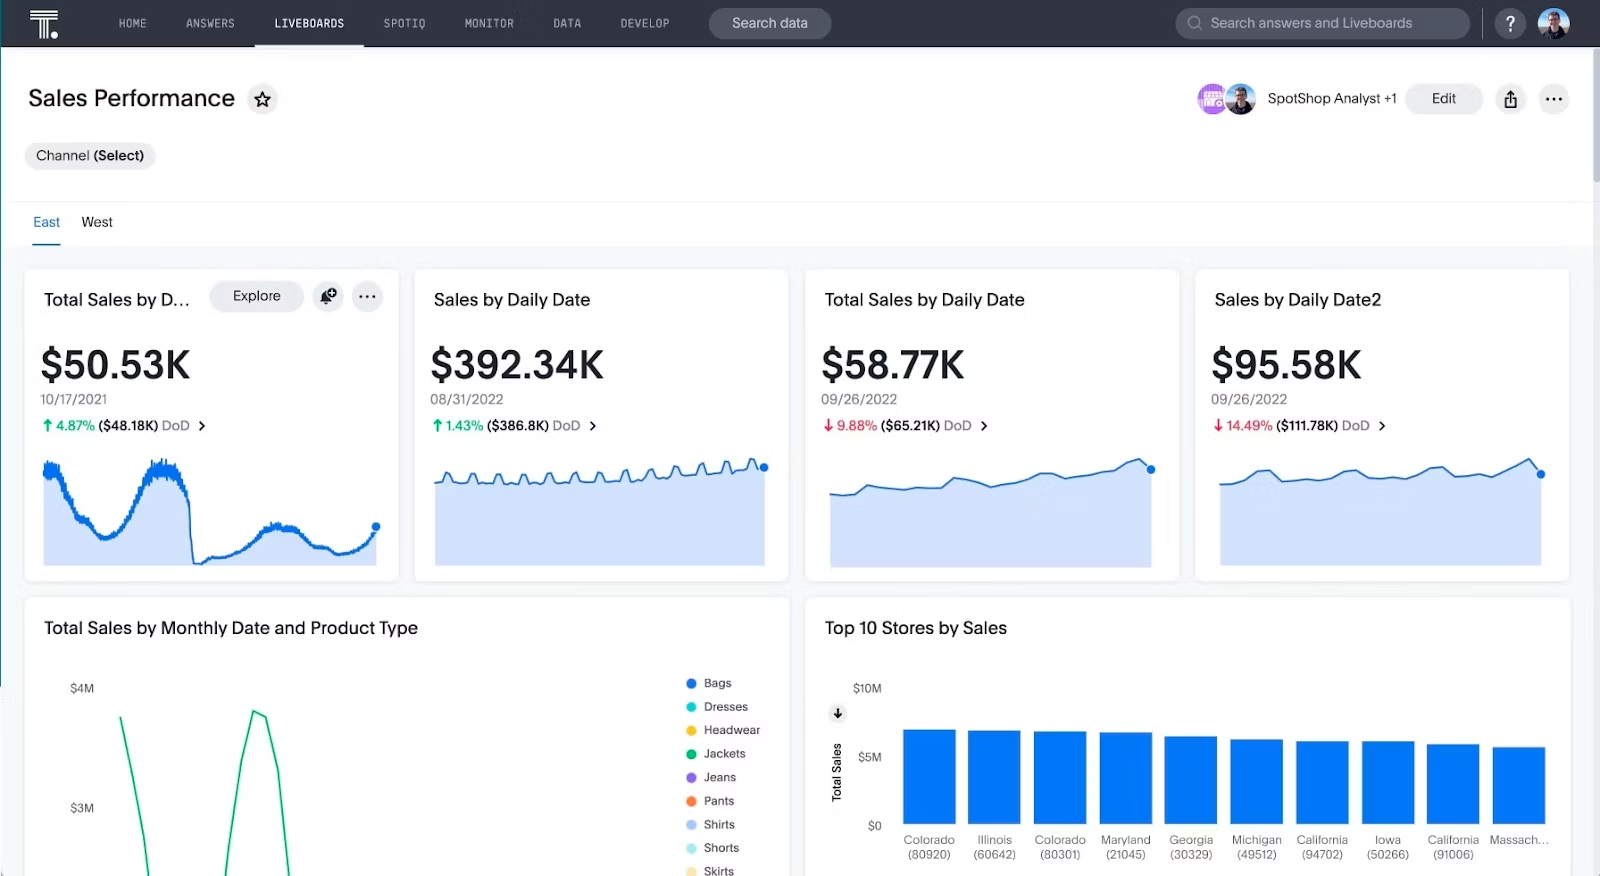
The sales KPI dashboard is used to quickly assess the health of your go-to-market organization. It provides a quick and easy way for sales managers, executives, and other stakeholders to monitor key metrics, analyze the performance, and anticipate gaps before they can negatively impact your business.
The key metrics that are commonly included in the sales KPI dashboard are:
Sales revenue: Total income generated from sales
Sales growth: Percentage increase in sales over a specific period
Conversion rate: Percentage of leads that convert into customers
Average deal size: The average value of a sales deal
Sales cycle length: The average time it takes for a deal to move from the initial contact to closing
Customer retention rate: Percentage of customers retained over a specific period
A marketing KPI dashboard is a dashboard designed for marketing professionals to evaluate and optimize strategies. This KPI dashboard example provides a comprehensive view of marketing performance, helping marketing teams understand the effectiveness of their campaigns, identify successful channels, and refine their strategies for maximum impact.

The key metrics that are commonly included in the marketing KPI dashboard are:
Lead generation: Number of leads generated through marketing efforts
Conversion rates: Percentage of leads that convert into customers or take desired actions
Cost per lead (CPL): The cost incurred for acquiring each lead
Website traffic: Total number of visitors to the website
Social media engagement: Likes, shares, comments, and other interactions on social media platforms
Email marketing metrics: Metrics such as open rates, click-through rates, and conversion rates for email campaigns
Real-time monitoring: KPI dashboards empower you to stay on top of your metrics, providing an up-to-date view of your organization's health.
Data-driven decision-making: By presenting data through curated, easy-to-digest metrics, KPI dashboards give you the power to make data-driven decisions in real-time.
Efficiency and productivity: KPI dashboards streamline the process of accessing and interpreting data, saving you invaluable time. With this increased efficiency, you can focus on strategic initiatives rather than waiting for timely data collection and analysis.
Goal alignment: By monitoring KPI dashboards, you can ensure your teams and initiatives are aligned with individual, departmental, and organizational goals and objectives—ensuring everyone in your organization is working towards common targets.
Creating a KPI dashboard involves multiple steps, from identifying the right metrics to selecting the appropriate design and platform. Here’s a practical guide on how to do it:
Step 1: Define your KPIs
Align with business goals: Ensure the KPIs you track are directly tied to your company's objectives. Examples include revenue growth, customer acquisition, or cost savings.
Determine the type of KPIs: You might track financial KPIs, marketing metrics, operational efficiency, or customer satisfaction.
Prioritize key metrics: Too many KPIs clutter the dashboard. Choose the most impactful ones.
Step 2: Choose your data sources
Internal systems: Identify where the data lives (CRM, ERP, Google Analytics, etc.).
Integration options: Make sure you can connect your dashboard to the necessary data sources for real-time updates.
Data cleanliness: Ensure your data is accurate, clean, and up-to-date to avoid wrong interpretations.
Step 3: Select a dashboard tool
Tool compatibility: Consider tools like ThoughtSpot that provide self-service analytics.
Ease of use: Choose a platform that offers an intuitive interface, customizable options, and supports real-time data.
Customization needs: Make sure the tool lets you present the KPIs in a way that suits your audience's needs (e.g., visualizations, graphs, or tables).
Step 4: Design the layout
Keep it simple: Aim for a clean, minimalistic design. Only include essential information to avoid confusion.
Logical flow: Arrange your KPIs so users can quickly get an overview of the data, typically with the most important metrics at the top.
Use visuals: Charts, graphs, and heatmaps work well for representing trends and outliers. Just be sure they are easy to interpret.
Step 5: Ensure real-time updates
Automate data pulls: Set up your dashboard to automatically refresh data at regular intervals.
Sync with data sources: Regularly sync your dashboard with your data source (daily, weekly, or in real-time).
Step 6: Test and iterate
Get feedback: Share the dashboard with stakeholders to ensure it meets their expectations and is easy to understand.
Refine based on feedback: Make adjustments based on usability and the relevance of KPIs.
Continuously update: Business goals change, so revisit your KPIs periodically and update your dashboard as needed.
Step 7: Ensure security
Role-based access: Limit access to sensitive data. Make sure only authorized personnel can view or edit the dashboard.
Compliance: Ensure your dashboard complies with relevant regulations and data privacy standards.
While KPI dashboards are important tools to monitor key performance indicators and make informed decisions, relying solely on static dashboards can limit your ability to find actionable insights. That’s because traditional static dashboards often provide a snapshot of data at a specific point in time.
In your fast-paced business environment, decisions can't wait. You need real-time insights into their KPIs to respond promptly to market shifts, emerging trends, and operational changes. And you need the ability to quickly analyze and assess those insights to identify outliers and opportunities.
With ThoughtSpot's Liveboards, you can set up a push notification to flag if an important metric drops in real-time, use AI to automatically analyze reasons for the drop, drill down to compare historic outliers and identify potential solutions. You can do all of this from your Liveboard, whether you’re on a desktop or your phone.
Here are a few ways Liveboards can be helpful:
1. Using AI-assisted analytics, SpotIQ uncovers hidden insights for enhanced decision-making.
2. Across the organization, verified dashboards ensure data governance and maintain quality.
3. Without the hassle of maintaining integrations, connectors deliver timely data to your business team as needed.
4. Real-time data tracking on mobile devices enables you to make data-driven decisions anywhere, anytime with data on-the-go.
Most businesses are using some variation of KPI software. But as we’ve seen, not all solutions are created equally—they don’t give you the ability to provide the same level of value for your business. With ThoughtSpot Liveboards, you can use data to actively shape the future of your business for the better.
See for yourself. Schedule a live demo and witness firsthand just how powerful it feels to make decisions with the pulse of your business.


