


Retail leaders are obsessed with customer experience, and rightfully so. Today’s customers expect you to provide prompt support and a seamless experience that allows them to easily explore products and make transactions—both in-store and online.
However, this can create a challenge for already-busy retail leaders. Optimizing inventories, preventing stock-outs, and managing customer interactions across all touchpoints—needless to say, you’ve got a lot on your plate.
To keep up with growing demand, retail leaders need accessible, real-time insights into their store performance. And that’s why they are turning to interactive retail dashboards. These live dashboards, as we call them Liveboards, help you identify trends, recognize patterns, and make sales forecasts, allowing you to make data-driven decisions promptly.
Table of contents:
Retail dashboards offer real-time visualizations of data, allowing retailers to track and analyze critical KPIs and metrics. With this interactive tool, you can extract data from multiple sources, understand data, and create engaging, contextual data stories.
Whether you want to monitor your inventory levels or anticipate customer demand for the next quarter, you can customize the dashboard to align with your business needs for real-time insights into your most complex business problems.
While static dashboards offer stale insights that cause delays in decision-making, interactive retail dashboards provide end-to-end visibility into your operational and financial performance. They help you stay on top of your business goals and identify critical areas that need attention. Let’s explore the various business areas where retail dashboards can help you drive value.
1. Inventory and supply chain
Imagine this: You have been eyeing a popular smartphone model, and after researching, you’ve decided to purchase it. Excited, you visit a nearby electronics store, only to find out that the smartphone is out of stock.
This can be a frustrating experience for a customer as it disrupts their purchasing plans, causing inconvenience and potentially leading to lost sales. However, you can prevent such situations with a store performance dashboard. Real-time insights into your inventory levels help you find problem areas and create an action plan to fix the issue, leading to improved satisfaction and customer loyalty. Consequently, drawing insights from your supply chain data can also help you keep your operational costs to a minimum and unlock next-level productivity.
Want to see how big players like Canadian Tires drive sales by optimizing inventory planning through data? Watch this video.
More reading: Inventory planning guide: benefits, examples, & instructions
2. Sales and marketing
Retail analytics offer granular insights into the various stages of the sales and marketing process, right from lead generation to deal closure. For instance, a retail KPI dashboard can quickly help you identify high-performing sales regions, assess the impact of promotional strategies, recognize trends, and more. You can also move one step further and create in-depth sales forecasting reports to anticipate future demands for effective resource allocation.
Here’s a real-world example of how interactive dashboards empowered the data team of luxury kitchen manufacturer Fabuwood to gain greater visibility into their sales operations:
3. Customer engagement
Retail analytics also play a critical role in understanding customer behavior and preferences, empowering you to create more personalized and engaging experiences. Managing a retail business is all about forging strong customer relationships. However, to do that, you need to know where your customers are and what they want. For instance, you may think most buyers prefer an online shopping experience. However, research by the National Retail Foundation states that physical stores remain the primary point of purchase for consumers, accounting for approximately 70% of total retail sales. Retailers should eliminate guesswork and enable data-driven decisions at every intersection.
With an intuitive BI tool, you can personalize your retail dashboard to gain real-time visibility into customer data. The goal is to help you identify their purchasing patterns, preferences, and behaviors. By doing so, you enhance in-store and online experiences, optimize merchandising processes, and boost engagement across all touchpoints, giving you an edge in the competitive retail landscape.

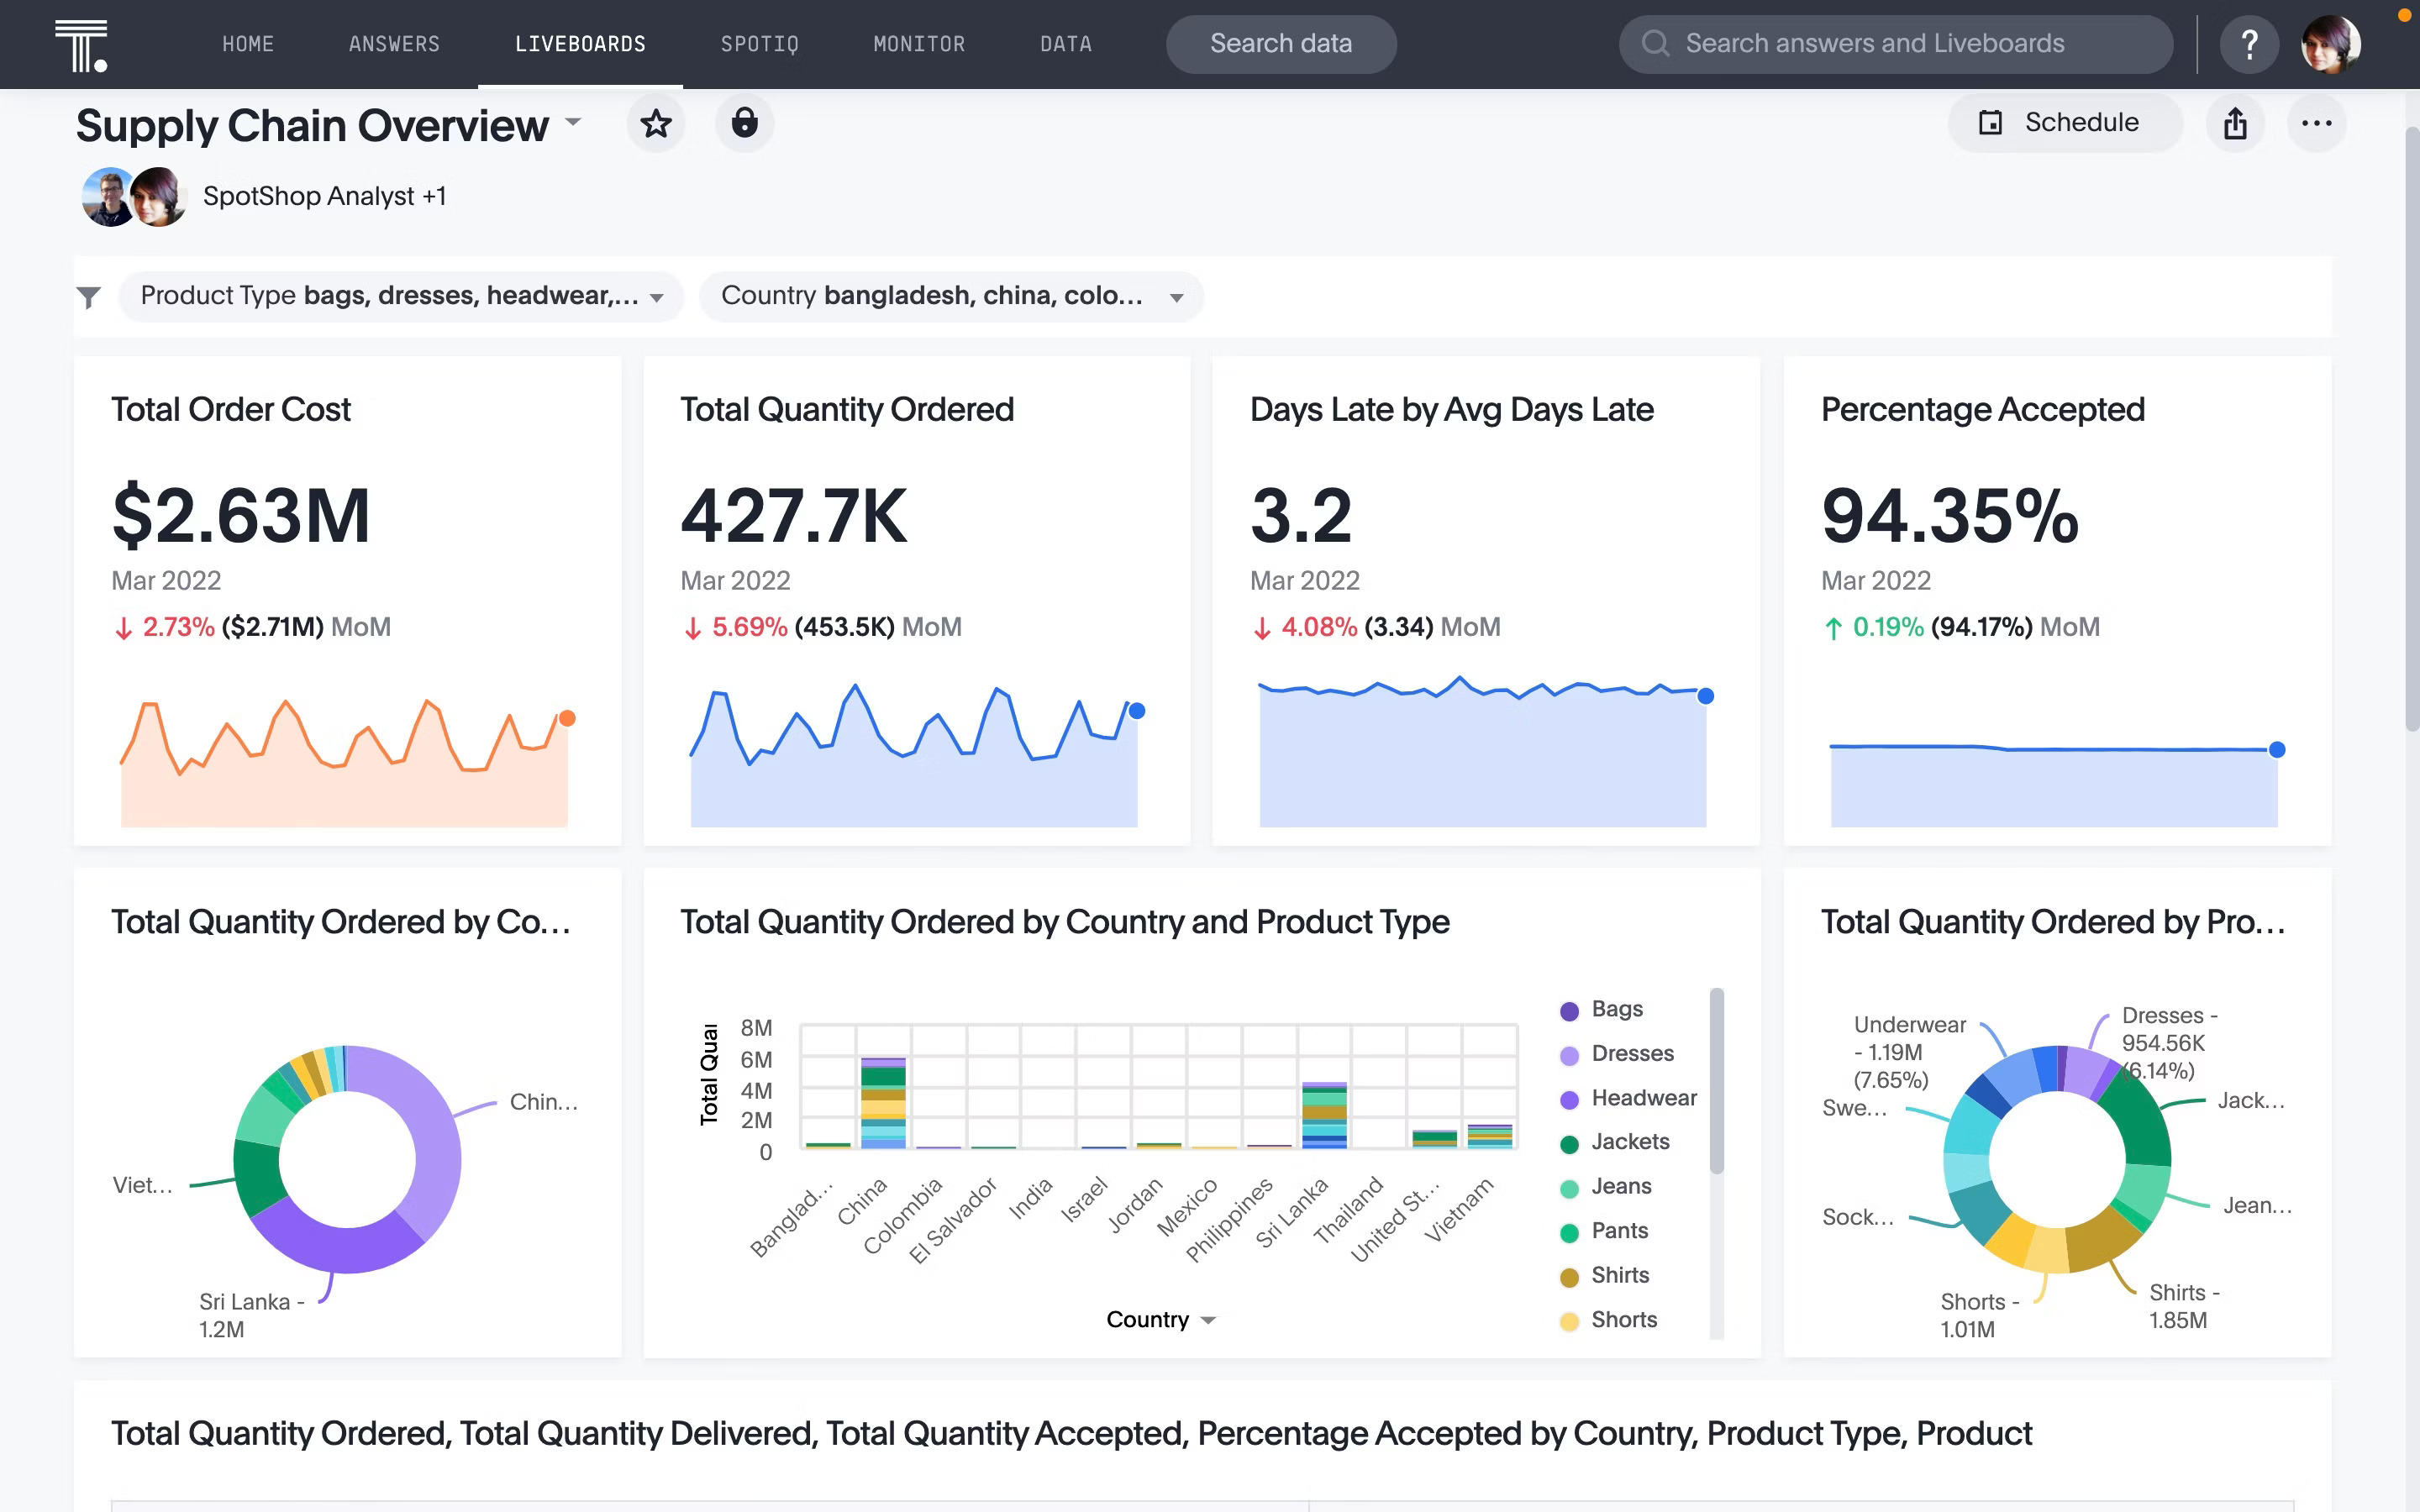
A retail store performance dashboard provides a visually intuitive snapshot of your store's health. It may include KPIs related to sales, finance, and inventory. When used strategically, the dashboard can help decision-makers easily communicate insights, identify areas for improvement, and highlight trends that may impact the overall success of the retail operation.
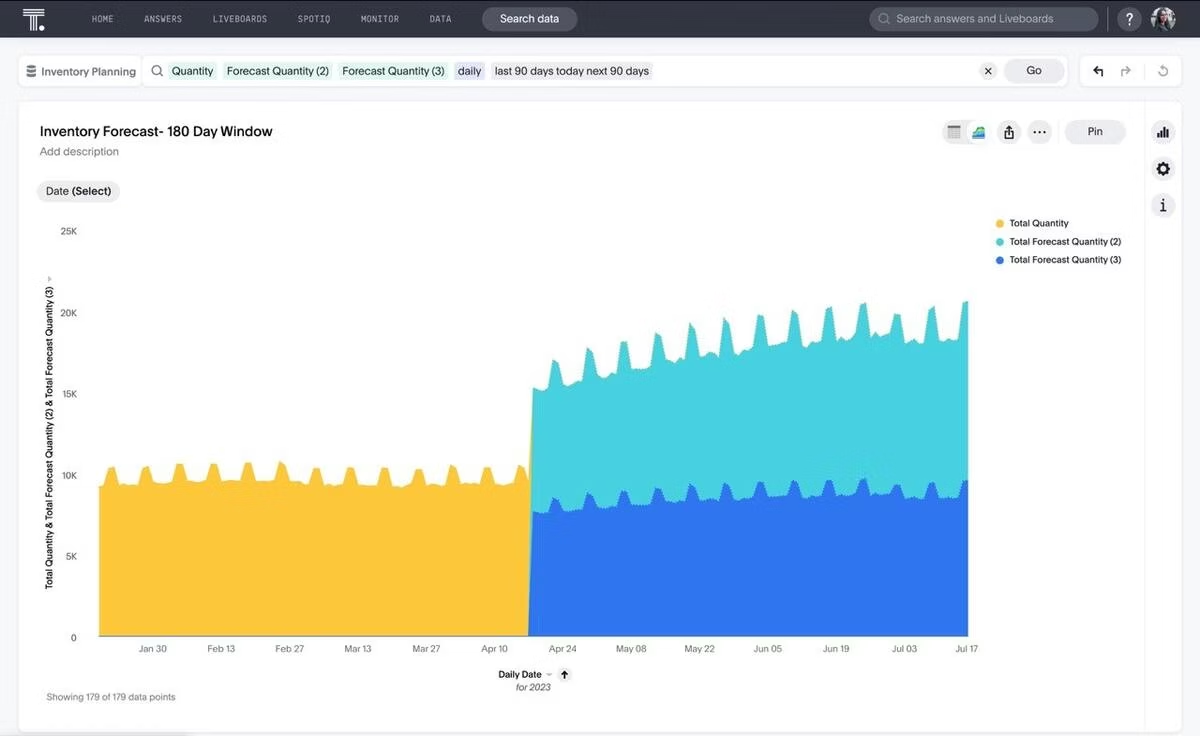
While a store performance dashboard offers a surface-level view of a specific retail store, a retail inventory management dashboard provides actionable insights into your entire inventory. It delves into your current stock levels and product categorization. You can also create demand and sales forecasting visualizations to understand areas where you can improve, maintain product availability, and minimize operational costs.
If you want to track KPIs related to a specific business function, you can customize your retail dashboard to monitor and explore hidden insights. Typically, these dashboards are helpful to decision-makers when they are evaluating current operations or exploring new revenue opportunities. When tailored for senior leadership, a retail KPI dashboard can also serve as an executive dashboard, offering high-level visibility into performance metrics that drive strategic decisions across multiple departments.
Another example to consider is a retail sales dashboard, which focuses on tracking KPIs related to your sales performance. It provides a concise and accessible overview of various sales-related data points, allowing stakeholders to monitor performance and drive revenue. Whether you want to make strategic decisions about resource allocation, product development, or sales strategies, this interactive dashboard allows you to drill into data and discover insights, facilitating effective communication and faster decision-making.
A retail supply chain dashboard is designed to track supply chain KPIs that help retailers analyze the performance of their existing operations. It is a powerful tool for reducing lead times, evaluating supplier performance, and ensuring a seamless flow of products from suppliers to customers.
Getting the most out of your data may seem daunting. That’s because most dashboard software requires extensive training, and the implementation process may take weeks or even months.
That’s not the case with ThoughtSpot. Our AI-Powered Analytics reduce the time to value through seamless integration with cloud databases and data sources. ThoughtSpot also offers a unique and intuitive approach to exploring and analyzing data—simply ask questions about your data and get AI-assisted answers, recommendations, and visualization.
See how easy it is to create ThoughtSpot Liveboards—sign up for a free demo to unlock the full potential of your data.


