


Effective supply chain management is crucial for businesses to maintain a competitive edge in today's dynamic and fast-paced marketplace. To stay ahead, organizations need to track and measure key supply chain KPIs (Key performance indicators) and metrics that provide valuable data-driven supply chain solutions and insights into their operations. These supply chain metrics help identify bottlenecks, areas for improvement, optimize processes, enhance customer satisfaction, and drive overall operational efficiency.
In this article, we will explore the top 15 supply chain metrics and KPIs that data-driven businesses should be tracking in your dashboard in 2023. These metrics cover a wide range of areas, including order fulfillment, inventory planning, supplier performance, risk management, and more.
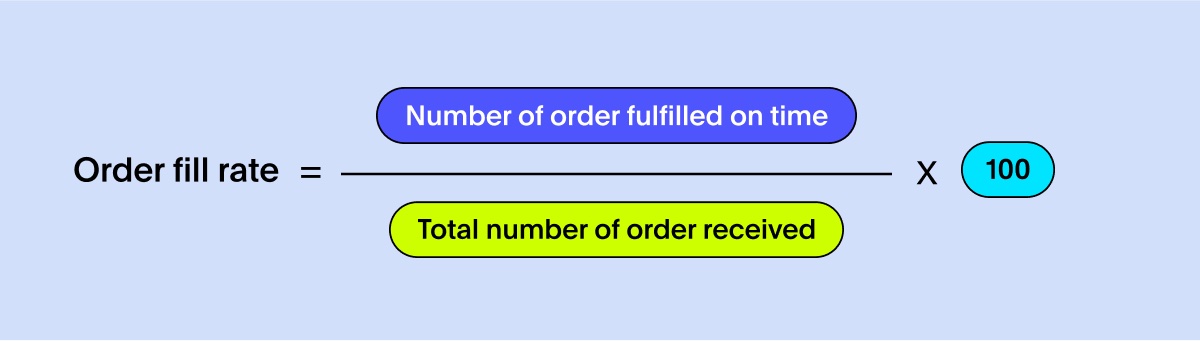
The order fill rate measures the percentage of customer orders that are fulfilled completely and on time. It reflects the efficiency and effectiveness of your supply chain in meeting customer demands promptly. A high order fill rate indicates that you are consistently meeting customer expectations, leading to increased customer satisfaction and loyalty.
To measure the order fill rate, divide the number of orders fulfilled in full and on time by the total number of orders received, and multiply by 100. Continuously track this metric and compare it against your target or industry benchmarks to assess performance.
To improve this supply chain KPI, focus on inventory optimization, demand forecasting, and production planning. Ensure accurate inventory data, streamline order processing, and maintain strong relationships with suppliers to minimize delays or stockout costs. Implement technologies like real-time inventory monitoring and demand planning software to optimize order fulfillment.
The perfect order rate measures the percentage of orders that are delivered to customers without any errors or defects. It takes into account various aspects of the order including accuracy, timeliness, condition, and documentation. A high perfect order rate indicates a supply chain that consistently delivers orders correctly and fully, resulting in improved customer satisfaction and reduced costs associated with order errors.
To measure the perfect order rate, divide the number of orders delivered without any errors by the total number of orders fulfilled, and multiply by 100. Regularly track this metric and set targets based on industry standards or internal goals. Consider implementing performance incentives to motivate and reward teams that consistently achieve high order accuracy rates.

To improve the perfect order rate, focus on enhancing order accuracy, reducing lead times, and improving communication throughout the supply chain. Implement quality control processes, provide ongoing training to staff, and collaborate closely with suppliers and logistics partners to minimize errors and ensure smooth order fulfillment.
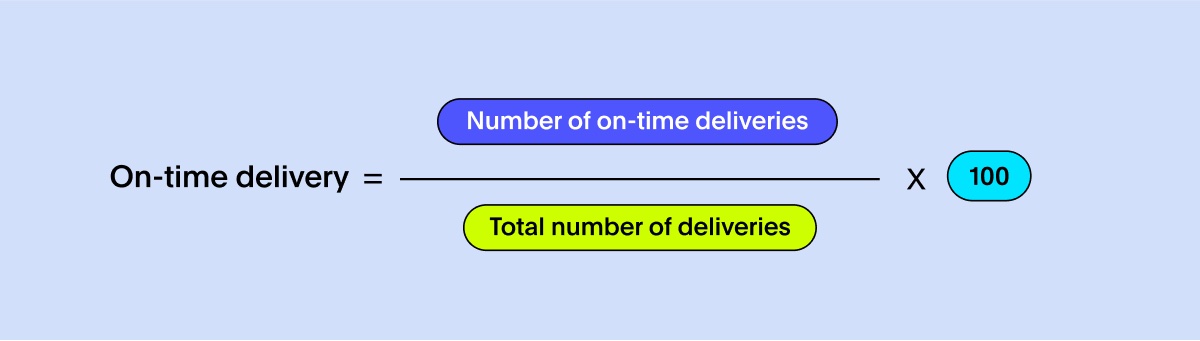
On-time delivery measures the percentage of orders that are delivered to customers within the agreed-upon timeframe. It reflects the reliability of your supply chain in meeting delivery commitments and customer expectations. High on-time delivery rates enhance customer satisfaction, foster trust, and strengthen relationships with customers.
To measure on-time delivery, divide the number of on-time deliveries by the total number of deliveries made. Monitor this supply chain KPI regularly and compare it against your target or industry benchmarks.
To improve this supply chain KPI, optimize transportation and logistics processes, streamline order processing and fulfillment, and strengthen communication with carriers and suppliers. Implement robust tracking systems, establish clear delivery timeframes, and proactively address any potential delays or disruptions to ensure timely order delivery.
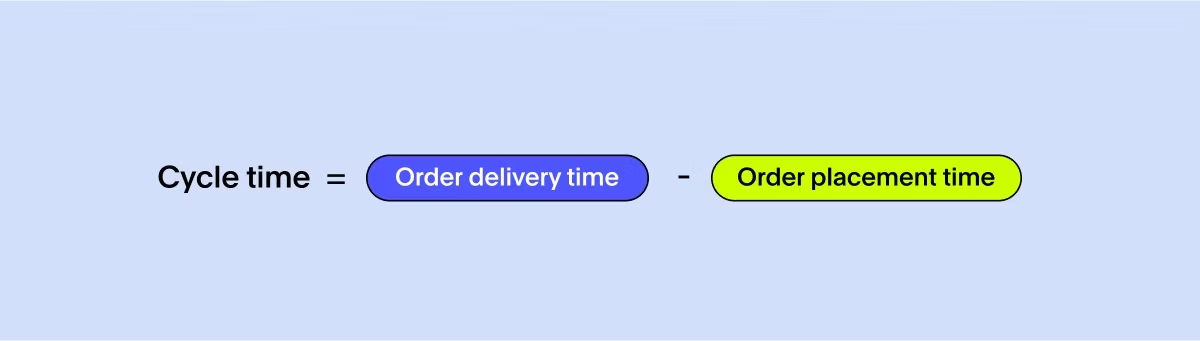
Cycle time refers to the total time it takes for a product or service to move through the entire supply chain—from order placement to delivery. It encompasses various stages, including processing, production, transportation, and any other activities involved in fulfilling customer orders. Monitoring cycle time helps identify bottlenecks, streamline processes, and improve overall efficiency.
To measure this supply chain KPI, track the duration it takes for a product or service to go from one stage to another within the supply chain. Identify the critical stages and calculate the time taken for each. Regularly analyze the cycle time and set targets to reduce it.
To improve cycle time, focus on process optimization, automation, and collaboration. Identify areas of inefficiency or delay, streamline workflows, and leverage technology solutions such as supply chain management software and automation tools to reduce cycle time and improve overall efficiency.
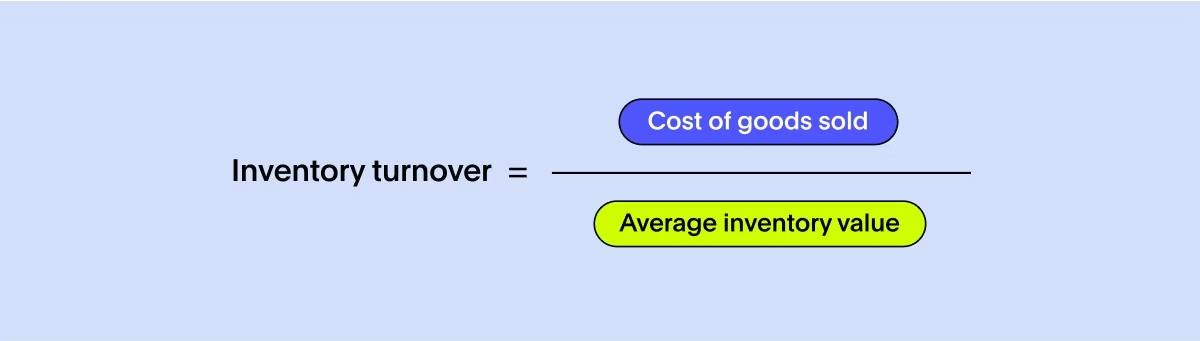
Inventory turnover measures how quickly inventory is used or sold within a specific period. It reflects the effectiveness of your inventory management and demand forecasting processes. A high inventory turnover rate indicates efficient inventory utilization, reduced carrying costs, and better cash flow.
To measure this supply chain KPI, divide the cost of goods sold (COGS) by the average inventory value. The average inventory value is the sum of the beginning and ending inventory values divided by 2. Calculate this ratio for a specific period, such as a month or a year.
To improve inventory turnover, focus on demand forecasting accuracy, optimize inventory levels, and establish effective inventory replenishment strategies. Analyze historical data, collaborate closely with suppliers, and leverage technologies like inventory management systems and predictive analytics to optimize inventory turnover and minimize excess or obsolete inventory.
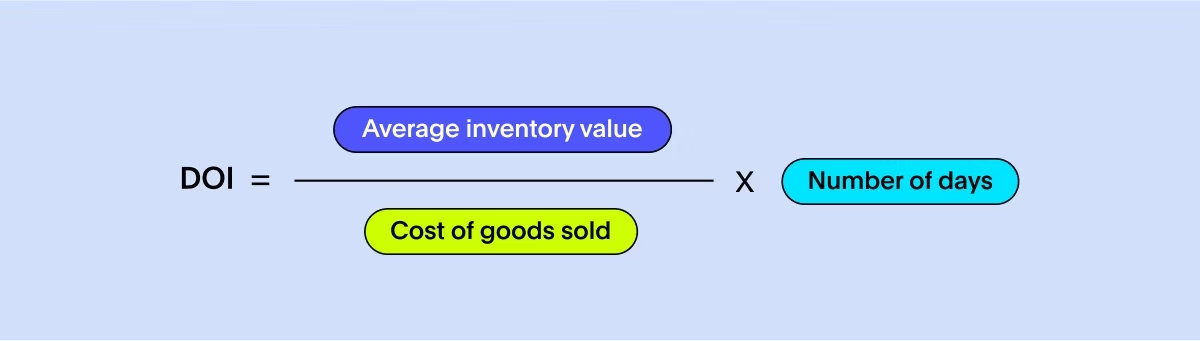
Days of inventory on hand (DOI) is a supply chain KPI that measures the average number of days it takes to sell or consume inventory. It provides insight into how efficiently inventory is managed and helps determine the optimal inventory levels to meet customer demand without incurring excessive carrying costs.
To calculate DOI, divide the average inventory value by the cost of goods sold (COGS) per day. The average inventory value is the sum of the beginning and ending inventory values divided by two. Regularly monitor and analyze DOI to identify trends and compare it against industry benchmarks or internal targets.
To improve DOI, focus on demand forecasting accuracy, optimize inventory levels, and implement efficient inventory management practices. This includes optimizing order quantities, implementing just-in-time (JIT) inventory systems, and utilizing demand-driven replenishment strategies. Analyze historical sales data, collaborate closely with suppliers, and leverage technology solutions like inventory management systems to optimize inventory turnover and reduce excess inventory.
Cash-to-cash cycle time (C2C) measures the time it takes for cash invested in the supply chain to be converted back into cash through sales. It considers the entire cash flow cycle, including the time required to pay suppliers, convert inventory into sales, and collect payment from customers. A shorter C2C cycle time indicates better cash flow management and improved working capital efficiency.
To measure C2C, calculate the average number of days it takes for cash to flow from the initial outlay to the ultimate cash receipt. This includes the average days of inventory on hand, average days of payables outstanding (DPO), and average days of sales outstanding (DSO). Continuously monitor and analyze C2C to identify areas for improvement and compare it against industry benchmarks or previous performance.

To improve C2C, streamline cash flow processes, optimize inventory management, negotiate favorable payment terms with suppliers, and implement efficient accounts receivable and accounts payable management practices. This includes implementing electronic invoicing systems, optimizing order-to-cash processes, and utilizing supply chain finance solutions to accelerate cash flow and reduce the overall C2C cycle time.
Supplier quality is a metric that evaluates the performance and reliability of your suppliers in delivering products or materials that meet the required standards and specifications. It assesses factors such as product quality, compliance with specifications, and adherence to delivery schedules. High supplier quality ensures resilience in your supply chain, reduces rework or rejection costs, and improves customer satisfaction.
To measure supplier quality, assess supplier performance through various parameters, such as the number of defects or non-conforming products, on-time delivery rates, and adherence to quality specifications. Regularly review supplier performance and establish a rating system based on defined criteria. Conduct supplier audits, evaluate quality management systems, and solicit feedback from internal stakeholders and customers.

To improve supplier quality, establish clear quality expectations and communicate them to suppliers. Develop mutually beneficial partnerships with suppliers, conduct regular performance reviews, provide necessary training and support, and collaborate closely to address quality issues. Implement supplier quality management programs, perform regular supplier evaluations, and establish continuous improvement initiatives to ensure consistent high-quality supplies.
Supplier lead time measures the time it takes for suppliers to deliver ordered products or materials. It includes the time from placing the order to the time it arrives at your facility. Tracking and managing supplier lead time is crucial for maintaining a responsive supply chain, meeting customer demand, and minimizing disruptions caused by delays in the supply chain.
To measure supplier lead time, track the time taken for suppliers to fulfill orders from the date of order placement. Monitor lead time performance for each supplier and compare it against established expectations or industry benchmarks. Analyze variations in lead time and identify opportunities for improvement.

To improve supplier lead time, enhance communication and collaboration with suppliers, establish clear expectations for lead time, and work together to reduce lead time variability. Streamline order processes, provide accurate forecasts and demand information, and explore opportunities for process automation and integration. Developing strong relationships with suppliers and exploring alternative sourcing options can also help minimize lead time and increase supply chain responsiveness.
Freight cost per unit shipped measures the average cost of transporting a single unit of product from your facility to the customer. It includes transportation costs such as shipping fees, fuel costs, handling charges, and any additional surcharges. Monitoring this supply chain KPI helps assess transportation efficiency, identify cost-saving opportunities, and optimize logistics operations.
To measure freight cost per unit shipped, divide the total freight cost by the number of units shipped during a specific period. Regularly track and analyze this metric, and compare it against industry benchmarks or previous periods to identify cost trends and potential areas for improvement.

To improve freight cost per unit shipped, consider optimizing transportation routes, consolidating shipments, negotiating favorable freight rates, and exploring alternative transportation modes or carriers. Implement transportation management systems (TMS) to optimize route planning and load optimization. Collaborate with logistics partners to leverage their expertise and negotiate more favorable contracts.
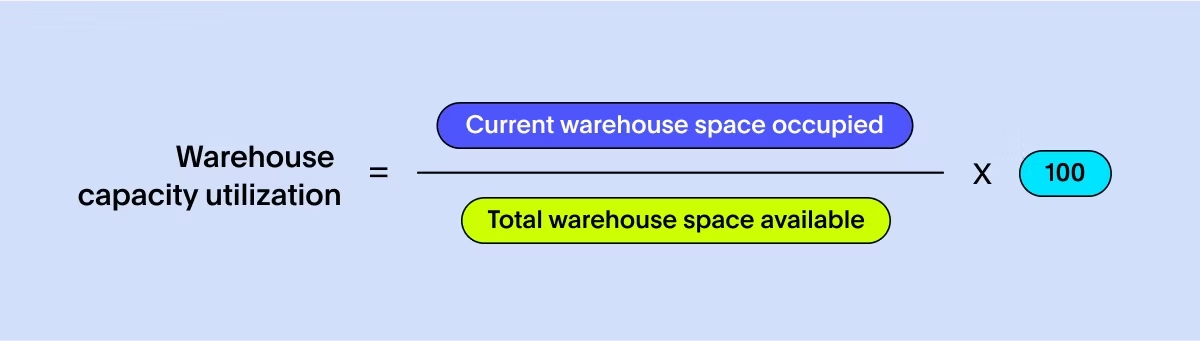
Warehouse capacity utilization measures the extent to which your warehouse space is being effectively utilized. It reflects the efficiency of warehouse operations and the ability to maximize available storage space. Monitoring warehouse capacity utilization helps optimize space utilization, minimize storage costs, and ensure smooth warehouse operations.
To calculate warehouse capacity utilization, divide the total occupied warehouse space by the total available warehouse space, and multiply by 100. Regularly assess and track this metric to identify areas of underutilization or overutilization.
To improve warehouse capacity utilization, consider implementing effective warehouse layout and organization strategies. Optimize space allocation, implement efficient storage systems, and regularly review inventory levels to identify obsolete or slow-moving items. Utilize warehouse management systems (WMS) to optimize space utilization, streamline picking and storage processes, and automate inventory management.
Return rate measures the percentage of products or orders that are returned by customers. It reflects the effectiveness of your product quality, order fulfillment processes, and customer satisfaction. Monitoring return rates helps identify potential issues, improve product quality, and enhance customer experience.
To measure return rate, divide the number of returned products or orders by the total number of products or orders shipped, and multiply by 100. Continuously track return rates and categorize returns based on reasons such as product defects, incorrect orders, or customer dissatisfaction.

To improve return rates, focus on enhancing product quality, order accuracy, and customer service. Implement quality control processes to minimize product defects, provide clear product descriptions and specifications to reduce order errors, and improve customer support and communication channels. Analyze return data to identify recurring issues and take corrective actions to prevent future returns.
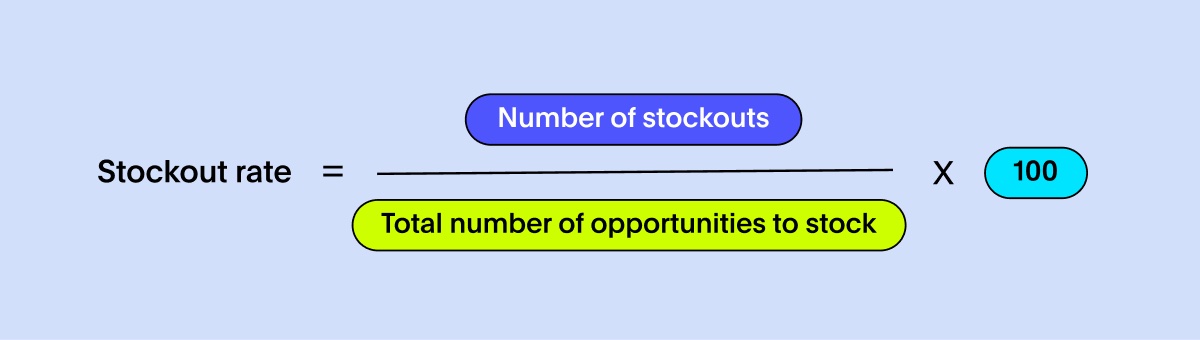
A stockout occurs when an item is not available for sale or delivery when required. The stockout rate is the percentage of times this happens. Lower stockout rates are preferable, as they indicate better inventory management and customer satisfaction. To calculate stockouts, you need to track instances where you were unable to fulfill customer demand due to insufficient inventory. Here's a simple formula to calculate the stockout rate:
Here's how you can break down the components of the formula:
Number of stockouts: Count the number of times you were unable to fulfill customer demand due to insufficient inventory. This can be done by tracking instances where you received customer orders but did not have the required products in stock.
Total number of opportunities to stock: Calculate the total number of opportunities where you could have stocked the requested products. This includes the total number of customer orders or instances where demand was expected.
For example, if you received 50 customer orders during a specific period and experienced stockouts in 5 of those orders, the calculation would be as follows: Stockout rate = (5 / 50) x 100 = 10%. This means that the stockout rate for that period was 10%, indicating that 10% of customer orders were not fulfilled due to inventory shortages.
It is important to track stockout instances consistently over time to identify trends, understand the reasons behind stockouts, and take necessary actions to reduce them. By minimizing stockouts, you can improve customer satisfaction, maintain reliable order fulfillment, and optimize your inventory management processes.
Supply chain risk index assesses the potential risks and vulnerabilities in your supply chain. It considers various factors such as geopolitical issues, natural disasters, supplier disruptions, and regulatory changes that can impact your supply chain operations. Monitoring supply chain risk helps identify potential threats, develop mitigation strategies, and ensure business continuity.
Measuring supply chain risk requires a comprehensive assessment of potential risks and their potential impact. Consider factors such as supplier risk, demand volatility, transportation disruptions, and regulatory compliance. Evaluate each risk factor on a scale and develop a weighted index that reflects the overall supply chain risk. In addition, optimize your safety stock levels to provide a buffer against unexpected demand fluctuations or supply disruptions. Regularly review and adjust safety stock levels based on historical data, demand patterns, and supplier performance.
To improve supply chain risk management, develop a proactive risk mitigation strategy. Identify critical risks, establish contingency plans, diversify suppliers and transportation routes, and implement robust risk monitoring and communication systems. Regularly review and update the supply chain risk index based on changing market conditions and emerging risks.
These metrics focus on environmental and social aspects of the supply chain, such as carbon emissions, waste generation, water usage, labor conditions, and ethical sourcing. They help assess the sustainability performance and the impact of the supply chain on the environment and society.
Improving sustainability metrics for your supply chain involves a combination of strategic planning, operational changes, collaboration with suppliers, and ongoing monitoring. Before you can put any measures in place, you first need to be aware of your current benchmarks and establish your ideal state.
Then, you can start planning strategies for improvement. These actions might include methods like incorporating green technologies, running more lean and efficient operations, and incorporating data and analytics into your decision making and reporting measures. NGO’s and other industry associations who are focused on sustainability may be able to assist you along your journey.
How to effectively track and measure supply chain KPIs and metrics using ThoughtSpot
ThoughtSpot is a powerful analytics platform that can help streamline the tracking and measurement of supply chain metrics and KPIs. It provides self-service analytics capabilities, allowing users to easily access and analyze supply chain data in real-time. Here are some steps to effectively track and measure supply chain metrics and KPIs using ThoughtSpot:
Add a supply chain KPI Liveboard in ThoughtSpot
Identify the key supply chain metrics and KPIs that are relevant to your business goals and objectives.
Connect relevant data sources into the ThoughtSpot platform, including ERP systems, logistics data, and other relevant data repositories.
Create bespoke Liveboards and KPI reports within ThoughtSpot to visualize and track the selected metrics and KPIs.
Utilize the ad-hoc query capabilities of ThoughtSpot to explore data, identify trends, and gain actionable insights.
Leverage the drill-anywhere and collaborative features of ThoughtSpot to share insights and collaborate with cross-functional teams.
Regularly monitor and analyze the tracked metrics and KPIs within ThoughtSpot to identify performance gaps, areas for improvement, and opportunities for optimization.
Utilize ThoughtSpots SpotIQ feature to find trends, correlations, and outliers in your data that you might not have found on your own.
By leveraging the power of ThoughtSpot, businesses can gain real-time visibility into their supply chain performance, identify bottlenecks, and make informed decisions to optimize their supply chain operations.
Make data-driven decisions with ease
Tracking and measuring supply chain metrics and KPIs is crucial for businesses to optimize their supply chain performance, enhance customer satisfaction, and drive operational efficiency. The 14 supply chain metrics and KPIs discussed in this article provide valuable insights into various aspects of the supply chain, from order fulfillment to inventory management, supplier performance, and risk management.
By regularly monitoring and analyzing these supply chain metrics and KPIs, businesses can identify areas for improvement, implement targeted strategies, and stay ahead of the competition in today's dynamic and competitive business landscape. Leveraging advanced AI analytics platforms like ThoughtSpot can further enhance the effectiveness of supply chain measurement and enable data-driven decision making.

Remember, every business is unique, so it's important to select the metrics and KPIs that align with your specific goals and objectives. Continuously evaluate and adapt your measurement framework to address changing business needs and industry dynamics, ensuring your supply chain remains agile, resilient, and optimized for success. Start your demo to optimize the insights that matter most and make data-driven decisions with ease!


