Research by Gartner shows that 83% of business strategies fail due to faulty assumptions and unclear objectives. To avoid falling into this trap, you need to set concrete goals and gain actionable insights from your data.
That’s where OKRs and KPIs come in. These popular goal-setting and performance measurement frameworks empower you to make data-driven decisions. Let’s take a closer look at both systems to see how they work.
Objective and Key Results, also known as OKR, is a popular goal-setting framework that defines objectives and tracks results. This collaborative structure helps teams focus on business goals and assess their performance in a quantifiable manner.
Key components of OKR
The OKR framework focuses on two critical elements—objectives you want to achieve and key results, which are specific, measurable outcomes that indicate progress toward achieving the objectives. Let’s break these down further:
Objectives: These are the qualitative description of the business goals that the organization aims to achieve. They answer the question, "What do we want to accomplish?" and provide a clear sense of direction.
Key results: These are quantifiable metrics that help you measure the progress toward achieving the desired objectives. They aim to answer the question, "How will we measure our progress toward the objective?’
OKR example
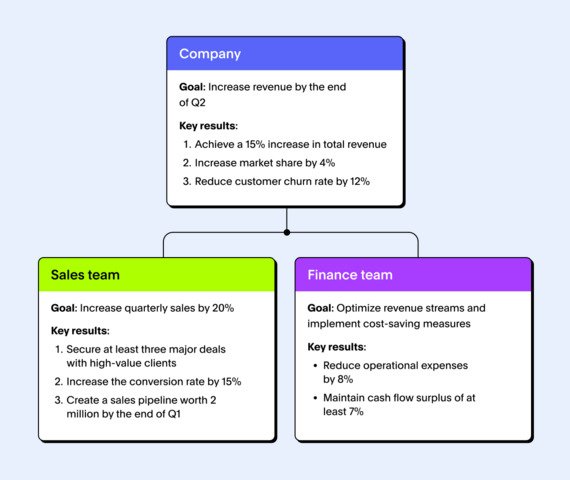
Picture this: Your company's business goal for the upcoming quarters is to boost revenue by 15%. To make this massive goal attainable, you can break down the organization's goal into departmental OKRs.

The example above shows how the sales and finance teams align their efforts to drive revenue growth. Each team's OKRs contribute to the overarching organizational goal, fostering transparency and collaboration to achieve the desired outcome.
Key Performance Indicators (KPIs) are a set of numbers or metrics that measure performance, monitor changes, and offer teams insights to make data-driven decisions. For instance, organizations use finance KPIs, marketing KPIs, or HR metrics to gain valuable insight into a project’s progress or identify whether they are on track to meet specified goals.
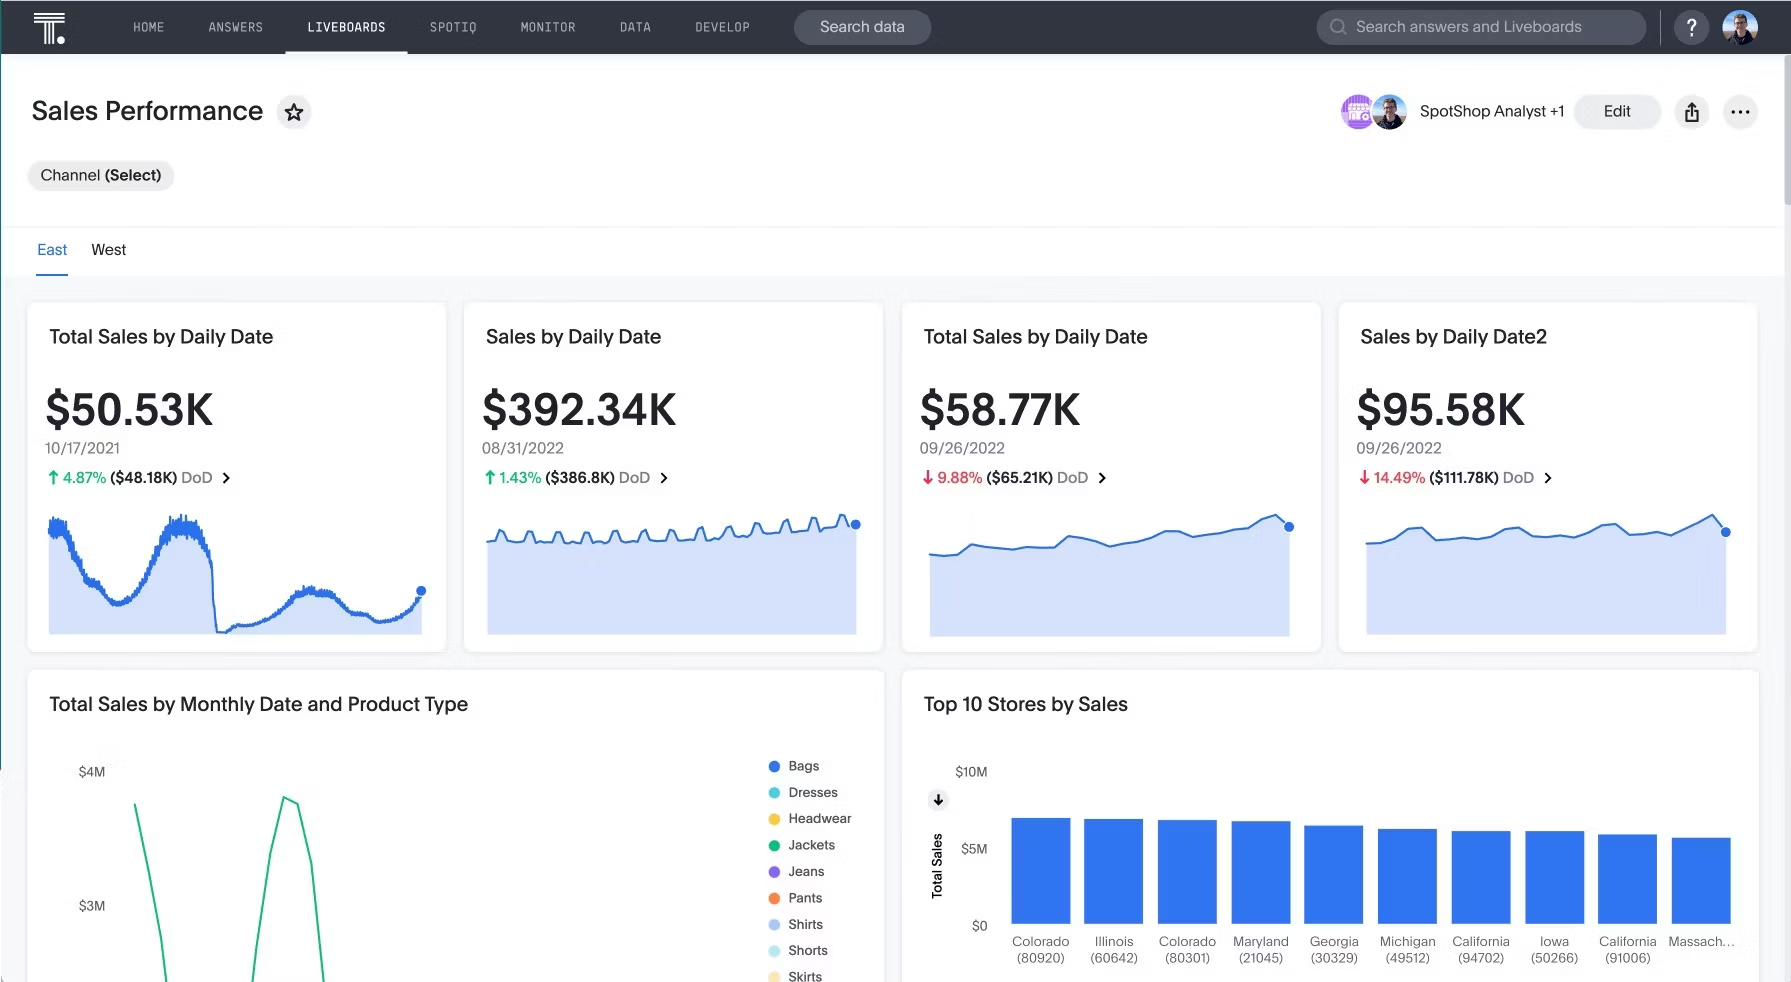
By leveraging a modern BI tool, you can create KPI dashboards and gain a complete snapshot of your business performance. These diverse dashboards—or as we call them, Liveboards—help you monitor, analyze, and track KPIs in real time through interactive data visualizations and advanced AI analytics.
KPI example
Using the same example above, the sales and finance team will use different sales KPIs and finance KPIs to accurately assess the goal’s progress over time.
Sales KPIs:
Monthly sales revenue: The total income generated from sales
Sales growth rate: Percentage increase in sales over a specific period
Conversion rate: Percentage of leads that converted into customers
Total pipeline value: Measures the total value of all opportunities in the sales pipeline. It provides insight into the potential revenue that the sales team can generate.

Finance KPIs:
Revenue growth rate: The percentage increase in a company's revenue over a specific time period
Working capital: The difference between a company's assets and liabilities.
Inventory turnover ratio: Calculates the number of times inventory is sold within a specific period
Free cash flow: Measures how much cash the company has after meeting its operational expenses
1. Scope
A key OKR vs KPI distinction is how they differ in scope. OKRs have a broader and more strategic focus. They represent big-picture goals with metrics attached. By offering team members clarity on what they are trying to achieve and what measures they will be using, OKRs set the target trajectory for your business and its departments.
On the other hand, KPIs are specific, quantifiable measures that track the progress of a particular business process, function, or project. Different departments, such as sales, operations, or finance, may have their own set of KPIs that help them identify trends, relationships, and outliers.
2. Purpose
Research by Asana shows that 34% of workers would feel more motivated if they could understand how their work contributes to the company’s mission. With OKRs, team members gain a solid grasp of their company’s goals and understand how their strategies contribute to them. This transparent and collaborative approach makes work more engaging for employees.
KPIs work more as performance-evaluating tools that help decision-makers track the progress of their projects and make informed decisions. You can monitor real-time changes in data and immediately address risk areas. You can also see where you’re succeeding and celebrate team wins together. This level of accountability helps to boost morale and motivate your team.
3. Timeframe
Another key OKR vs KPI difference is how frequently they are monitored. Since OKRs focus on high-level objectives, they are evaluated quarterly or annually. For example, you might have company and team QBRs where leaders share projects they are working on to hit goals set out through the OKR and share the success of those measures.
In contrast, KPI dashboards offer real-time monitoring, allowing executives and team members to identify bottlenecks and anticipate gaps before they can negatively impact your business.
For instance, ThoughtSpot’s monitor function allows you to monitor KPI changes on the go. You can even set up push notifications to the places you work (slack, salesforce, and even your mobile devices) to notify you when your KPI satisfies a certain threshold condition. This level of real-time monitoring empowers you to swiftly take action and mitigate risks.
Once you understand the differences between OKRs vs KPIs, you'll know which one to go to in your moment of need. That said, most businesses take an integrated approach—incorporating both methods creates a perfect balance between aspirational goal-setting and practical performance measurement.
By aligning data with business goals, KPIs and OKRs empower you to navigate the complexities of the business landscape with confidence. Put simply, use OKRs to set the company’s strategic direction, and leverage KPIs to focus on day-to-day business activities.
1. Continuously monitor and report progress
Although most companies review their OKRs quarterly and KPIs almost daily, you should still create regular check-ins to ensure the set goals align with the current business landscape. Also, regularly share your findings with stakeholders to facilitate a deeper understanding of your data.
2. Ensure data quality
To keep your business moving in the right direction, you first need to ensure the data you use for real-time monitoring is reliable and accurate. From the moment you start collecting data, use data cleaning tools to remove any missing or duplicate values. This can greatly improve decision-making processes, reduce risks, and encourage users to utilize data at a greater scale.
3. Focus on simplification
Too often, businesses fail to achieve the goals they’ve set. Perhaps the goals were unrealistic or far too complex. By simplifying your OKRs and KPIs, you’ll help your teams focus on key priorities. Spend time deciding what matters, and don’t add too many things to your plate, as this may create confusion and lead to misinformed decisions.
4. Choose the right dashboard tool
With the right dashboard software, you can stay on top of all your KPIs and access the most up-to-date information without any delays.
ThoughtSpot is that partner. Our AI-Powered Analytics help you monitor KPI changes in real-time, understand why these changes are happening, and gain valuable insights. Instead of relying on static dashboards that serve yesterday’s insights, our Liveboards allow you to drill into specific searches, apply filters, and pin charts for faster and more nuanced decision-making.
Whether you are in sales, marketing, or operations, real-time insights are the key to making successful decisions. Building interactive dashboards with ThoughtSpot AI-Powered Analytics can help you see your data in a whole new way.
Schedule a demo today to see how easy it is to build and share AI-powered Liveboards.


