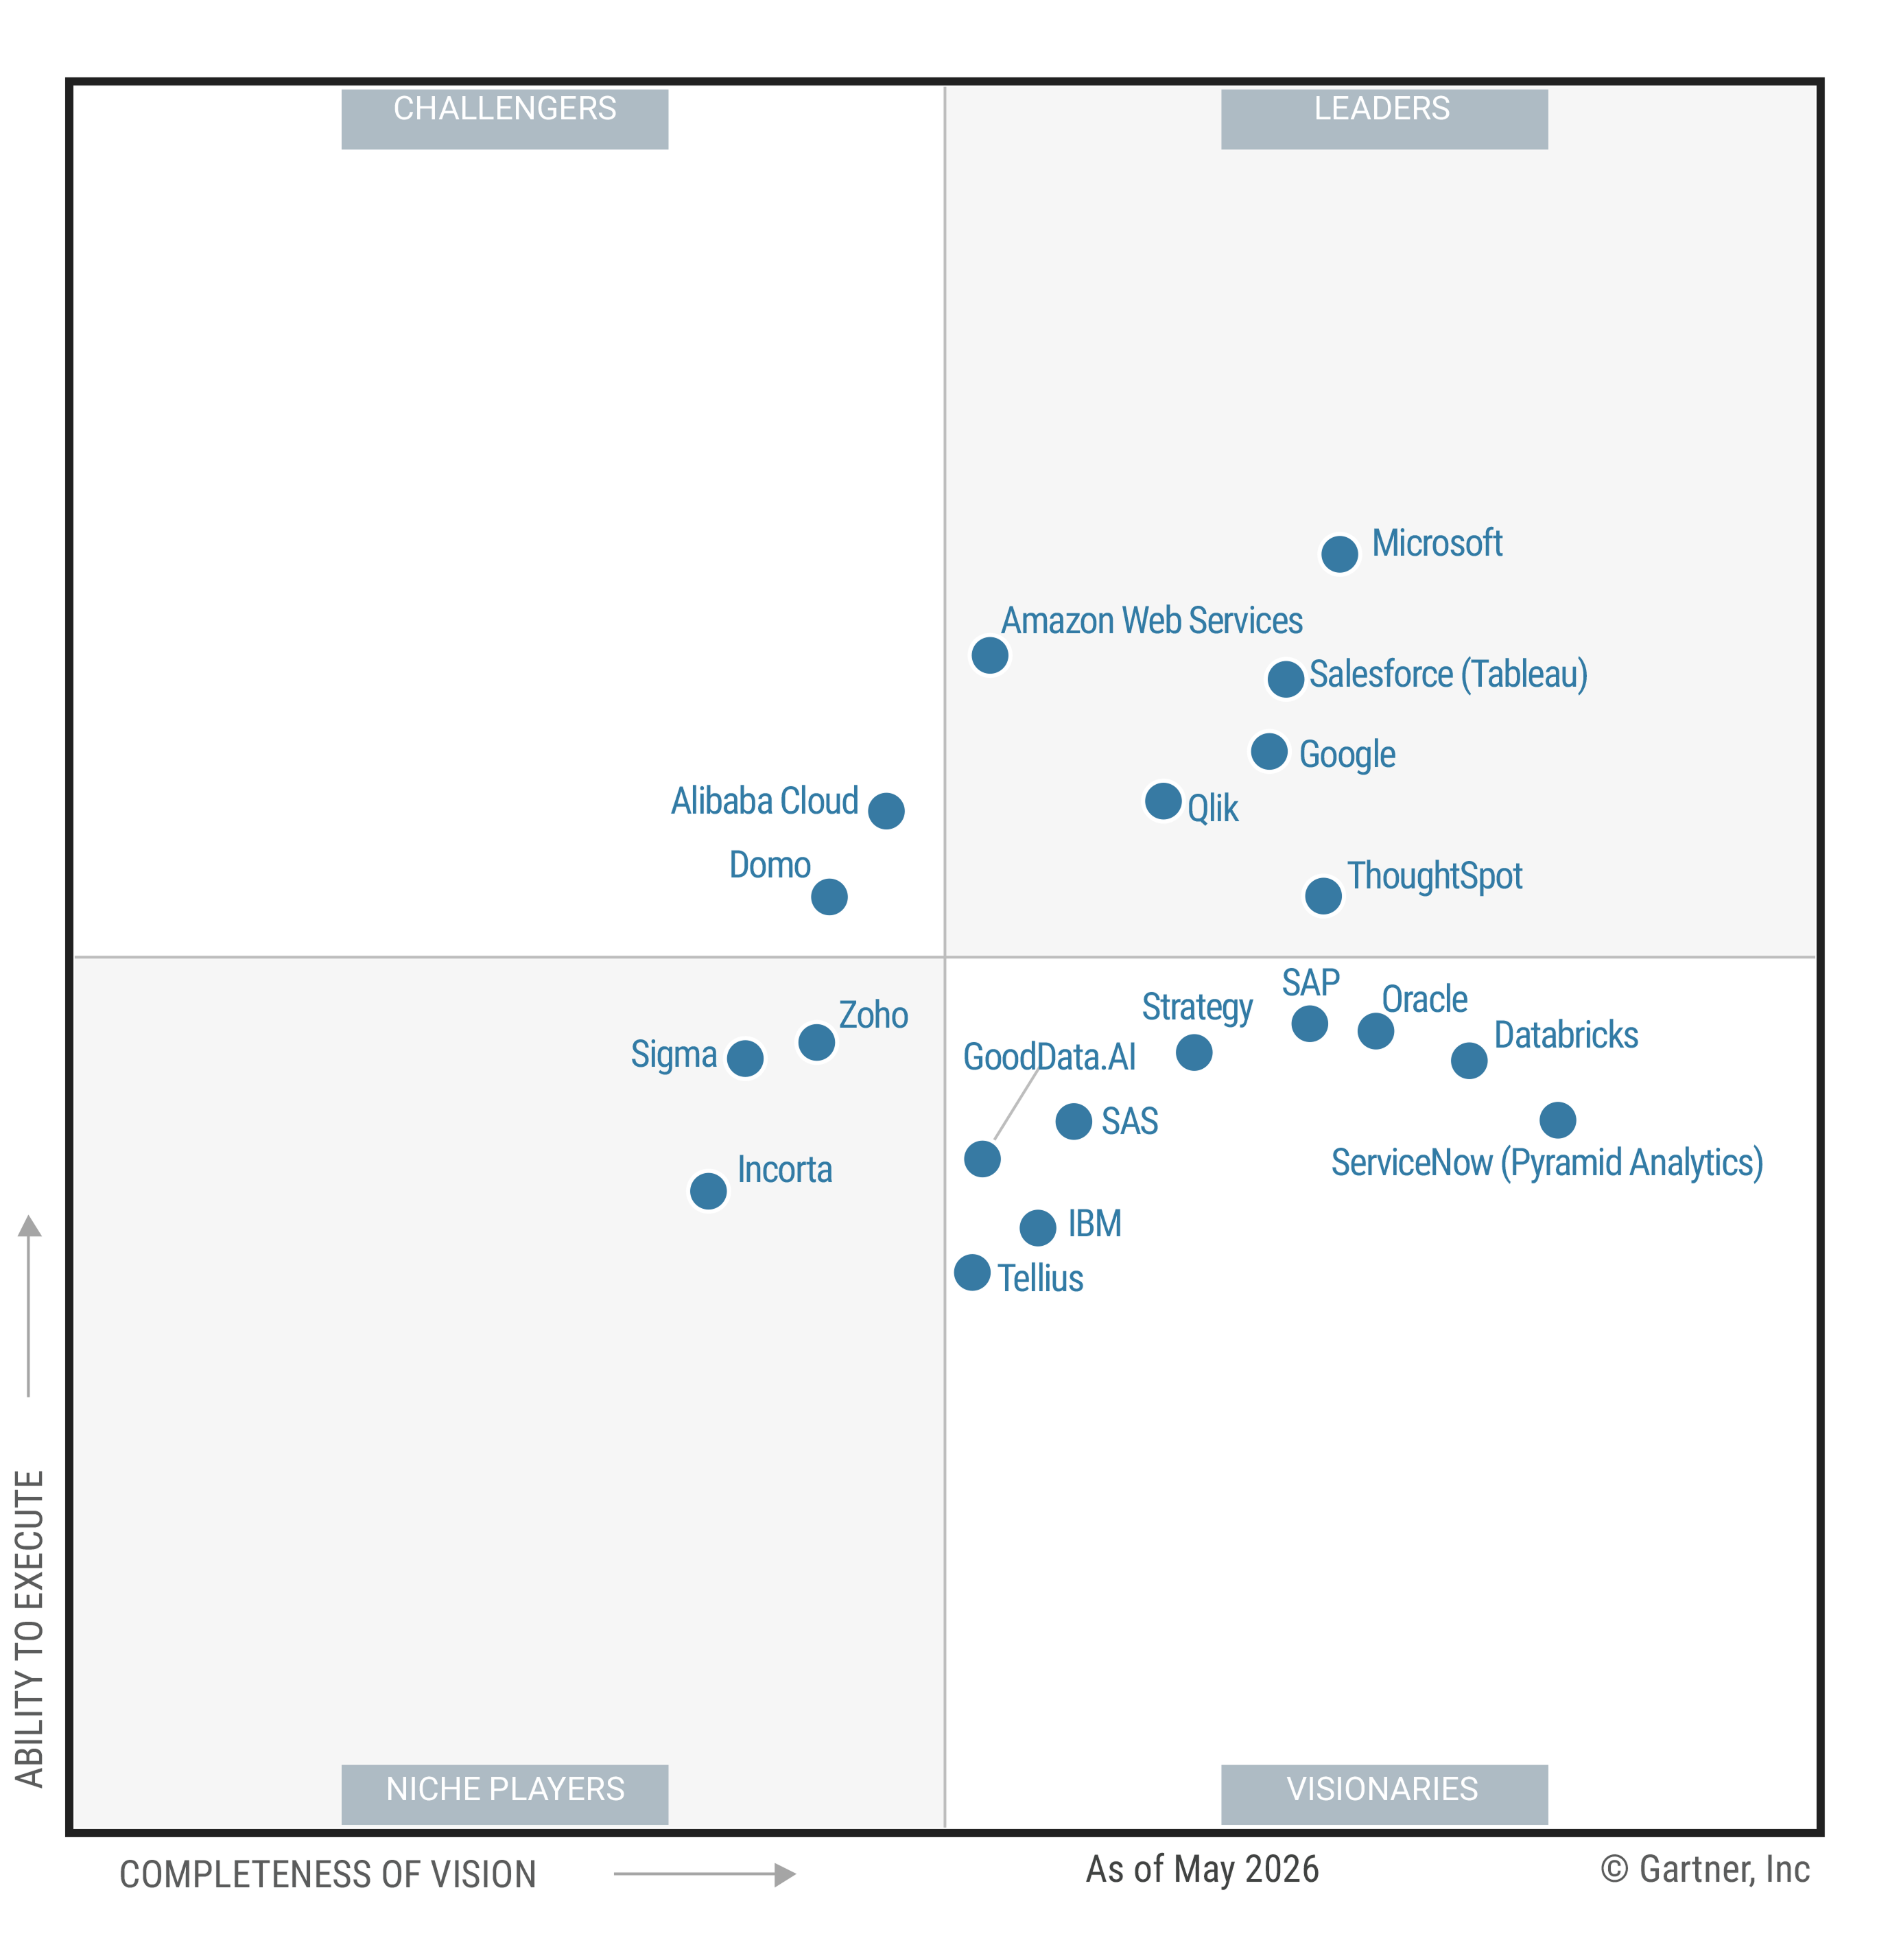
Tableau remains a market-leading BI platform because its drag-and-drop interface lets business users build visualizations without writing code. This capability is why many teams still rely on it. But as organizations grow, that same interface is creating friction.
Every new query requires a new dashboard build, so teams wait on analysts to create views. Data freshness depends on extract schedules that run at fixed intervals, so dashboards can lag behind business events. Advanced features like calculated fields carry a steep learning curve, concentrating expertise in a small group.
Companies with mature AI-ready data and analytics capabilities see up to 65% greater business outcomes than their peers, according to Gartner research. Modern platforms achieve this by allowing business users to ask questions directly of live, governed data without needing to build dashboards.
This page compares five Tableau competitors, what G2 reviewers say about each, and which questions to answer before you switch.
How to Tell When Your Team Has Outgrown Tableau
Tableau's ease of use is why most teams chose it originally. But as organizations scale, that same design creates friction. The platform attaches a dashboard to every metric, so each new question needs a build cycle, and data freshness depends on extract schedules. This manifests in five concrete ways:
Business users cannot self-serve
Without an intuitive low-code interface for asking new questions, frontline decision-makers find themselves waiting on technical teams just to pull insights. Tableau restricts users to pre-defined questions and answers. Exploring a new path means going back to a trained expert. Modern natural-language platforms solve this by letting leaders ask follow-up questions directly without filing a request.
Advanced features carry a steep learning curve
Calculated fields, LOD expressions, and table calculations are tricky for new users to pick up quickly. Many need formal training just to build a first dashboard. A natural-language interface sidesteps the syntax entirely. You type the question the way you would say it, without learning expression syntax.
Start Getting Better Insights
Scheduled extracts keep data stale
Tableau teams tend to use scheduled extracts for performance reasons, meaning dashboards can show hours-old information. Tableau does support live connections, but they often slow performance on large datasets. Modern platforms optimize for live warehouse queries by default, so insights reflect current business conditions without that trade-off.
Dashboard maintenance spirals
New data requests create a "dashboard factory" problem where teams spin up dashboards for every new request. Minor changes like adding metrics or renaming columns often require manual updates or rebuilding entire sheets, leading to sprawl over time. A governed semantic layer propagates definition changes automatically to all downstream reports, eliminating the need for manual fixes to each sheet.
AI features require additional infrastructure or tiers
Tableau added natural-language and AI capabilities through Tableau Pulse and Einstein AI, but they sit outside the main interface and require Tableau+ or Salesforce Data Cloud. These AI answers sit alongside dashboards as supplementary layers. Newer, search-first platforms make natural language the core experience, allowing users to get answers directly without navigating to traditional dashboards.
If one of these five describes your team's friction point, you are reading about Tableau competitors for the right reason.
What Counts as a Tableau Software Competitor
A Tableau competitor is a platform built to do what Tableau does: connect to data, turn it into something visual, and put it in front of the people making decisions. The right fit depends on what is slowing your team down today. Cost, governance, embedding, or the wait between a question and an answer each point toward a different tool.
Five Tableau Software Competitors Worth Evaluating
ThoughtSpot
ThoughtSpot carries a 4.4-star rating on G2 across 333 reviews. Its core differentiator is Spotter, an AI agent that answers questions in plain language without requiring a dashboard build. When you type a question, a language model interprets your wording and Spotter runs multi-step analysis. It can detect an anomaly, identify likely causes, and generate code to investigate further. The platform also integrates with Slack, Salesforce, and Jira, so findings can trigger actions directly in the tools where work happens.
Where ThoughtSpot fits best is teams whose main bottleneck is the wait between a question and an answer. It removes the dashboard-build step for exploratory questions and puts analysis automation in the hands of business users. Like other natural-language BI tools, it requires well-governed, well-modeled data underneath. Gartner's Market Guide for Agentic Analytics covers what "AI-ready" infrastructure actually means.
ThoughtSpot starts at $25 per user per month for the Essentials tier, and supports embedded analytics for customer-facing and internal applications. Frontify reduced the time to generate insights by 99% after switching from Tableau, a shift documented in their case study.
Sigma Computing
Sigma Computing holds a 4.4-star G2 rating across roughly 558 reviews, tied with Looker. Sigma puts a spreadsheet interface directly on top of your data warehouse. An analyst who knows Excel formulas can build a working model without learning SQL.
Sigma also supports writeback, so you can edit data directly inside the platform. Tableau does not offer that. Teams running planning or what-if scenarios often need writeback functionality. G2 reviewers describe Sigma as lighter on built-in AI and automation than ThoughtSpot or Power BI.
Related read: ThoughtSpot's Sigma comparison
Power BI
Power BI holds the highest G2 rating in this group: 4.5 stars across roughly 1,550 reviews. It integrates with Excel, Teams, and Microsoft Entra ID, so identity management and licensing consolidate into infrastructure many companies already run. Power BI Pro starts at $10 per user per month.
Copilot adds AI-assisted report generation. Reviewers note it performs best on data already inside the Microsoft ecosystem. Larger models, more frequent refreshes, and other advanced features require Premium pricing, which closes much of the cost advantage of that $10 entry price.
Related read: ThoughtSpot's Power BI comparison
Looker
Looker sits at 4.4 stars across more than 1,600 G2 reviews, on par with Tableau and ThoughtSpot. Its core structure, LookML, defines a metric once, and every dashboard, report, and embedded view pulls from that same definition. This keeps finance and sales working from the same numbers.
The trade-off is time. G2 reviewers point to a steep LookML learning curve and a longer setup than lighter tools. Looker works best for teams that already have a data engineer or analytics engineer on staff to build the model.
Related read: ThoughtSpot's Looker comparison
Qlik Sense
Qlik Sense matches Tableau's own G2 rating: 4.4 stars across 763 reviews. Its associative engine works differently from Tableau's query-based model. Selecting a value in one chart updates every connected chart to show what is related, without a query written in advance to define that relationship.
Entry pricing starts around $30 per user per month for SaaS deployments, lower than Tableau's Creator tier near $75. Qlik's flexibility comes with its own learning curve once you move past basic exploration.
Related read: ThoughtSpot's Qlik comparison
How the Five Compare
|
Platform |
G2 Rating |
Best For |
Starting Price |
Key Trade-off |
|
Tableau |
4.4/5 (3,736 reviews) |
Deep, code-free visual customization |
Creator tier ~$75/user/month |
High cost at scale; steep learning curve for calculated fields and LOD expressions |
|
ThoughtSpot |
4.4/5 (333 reviews) |
Natural language answers without building a dashboard first |
From $25/user/month (Essentials) |
Requires well-governed, well-modeled data to perform |
|
Power BI |
4.5/5 (~1,550 reviews) |
Teams already standardized on Microsoft 365 and Azure |
$10/user/month (Pro) |
Advanced features gated behind Premium capacity |
|
Looker |
4.4/5 (~1,618 reviews) |
One governed metric definition across every report |
Custom pricing |
Steep LookML learning curve; longer setup |
|
Qlik Sense |
4.4/5 (763 reviews) |
Exploring data relationships without predefined queries |
From ~$30/user/month (SaaS) |
Learning curve for advanced features |
|
Sigma Computing |
4.4/5 (~558 reviews) |
Spreadsheet-fluent analysts working directly on the warehouse |
Custom pricing |
Lighter on built-in AI and automation than ThoughtSpot or Power BI |
Why Teams Replace Tableau
The five pain points above manifest in three concrete pressures that G2 reviewers cite most often.
Cost at scale: A Creator license runs close to $75 per user per month. Companies report that expanding past a small core team pushes annual licensing into six figures.
Learning curve: Setup requires mastering calculated fields and Level of Detail expressions, concentrating expertise and slowing adoption.
Performance: Dashboards degrade as datasets grow or users add complex filters, especially over live connections. These pressures emerge because Tableau was built around the idea of a small trained group building views for everyone else to consume. That model works well at the start. It breaks once you need self-service and speed.
How You Decide Which One Fits
Start by identifying what is actually broken today. That is more useful than starting from a wishlist of nice-to-have features. Power BI's entry price is hard to beat inside a Microsoft-standardized company. Looker's semantic layer fits teams that need one governed metric definition across every report. ThoughtSpot's natural language search fits teams whose main bottleneck is the wait between a question and an answer.
Next, define what a better outcome looks like before running a trial. "Faster dashboards" and "fewer requests to the data team" sound similar. They point toward different tools. A team that primarily needs faster builds might pick Power BI or Looker. A team that primarily needs to reduce requests picks ThoughtSpot.
Test more than one platform against your own data before committing. Every vendor demo looks clean on curated data. What matters is whether your messiest data source behaves the same way once it is inside the platform.
The Data & AI Chief podcast covers how other data leaders evaluated and switched BI platforms, for anyone still researching. In the podcast, Andi Gutmans said, “Over ninety percent of enterprise data is actually unstructured data... AI is really good at reasoning around this unstructured data, and so we can make a hundred percent of the data state light up.”
Where ThoughtSpot Fits If You're Ready to Move Past Drag-and-Drop
ThoughtSpot removes the dashboard-building step for any question that does not need a custom visual. A business user types a question in plain language, and Spotter answers from governed data, so the person who has the question gets the metric without filing a request.
Spotter runs the follow-up analysis a dashboard leaves to a person. It works from an anomaly to its likely cause and generates the code to confirm it. Every answer resolves against the same governed semantic model, so two people asking the same question get the same metric. Companies with that kind of AI-ready maturity see measurable gaps in business outcomes, as Gartner's research shows. The difference comes down to getting the underlying data model right first.
Ready to give your product governed answers a compliance team can sign off on? Schedule a demo today.