


Modern businesses today are built on processes, products, and experiences. Behind these is data, with the insights in this data capable of improving every facet of a company. That’s why organizations are spending more on business analytics technologies than ever before as they look to create a culture of data-driven decision making.
Effective operational reports can be a powerful driver for improving business performance with data-driven insights. They provide you with the opportunity to visualize data in a digestible, organized manner around a particular topic area, making it easier to see the reality instead of what could otherwise be intangible, complex issues that need addressing. Operational reporting is critical, as it helps enterprise executives identify key trends and make strategic decisions quickly. In this post, we'll look at what operational reporting is, examples, various types of these BI reports, best practices on how to create successful ones, and more.
What is operational reporting?
Operational reporting is a process of collecting, analyzing, and presenting data related to the day-to-day operations of a business. This type of BI reporting focuses on providing accurate, up to date information that is critical for decision-making and improving business performance. Operational reports typically include information on sales, inventory, production, customer service, marketing, and finance. Ideally, these reports are created using an analytics platform like ThoughtSpot that connects directly to data sources such as a cloud data platform, so the reports showcase insights as up to date and fresh as the underlying data.
The importance of operational reporting in business decision-making cannot be overstated. While in use for years, the rise of the modern data stack has made real-time, interactive operational reports that can be used by employees on the frontlines more important than ever. That’s because accurate and timely information is critical for managers to make informed decisions that can have a significant impact on the bottom line, with some research showing companies leading here generating 10-30% more revenue than competitors. Operational reports provide managers with the necessary data to make decisions that can optimize business processes, identify areas of improvement, avoid unnecessary risk, and capitalize on opportunities.
Examples of operational reporting
Nearly every part of an organization can benefit from operational reporting because it provides a systematic means to analyze, understand, and act on the reality of your business. While valuable across an organization, these are some of the most common use cases and examples of operational reporting.
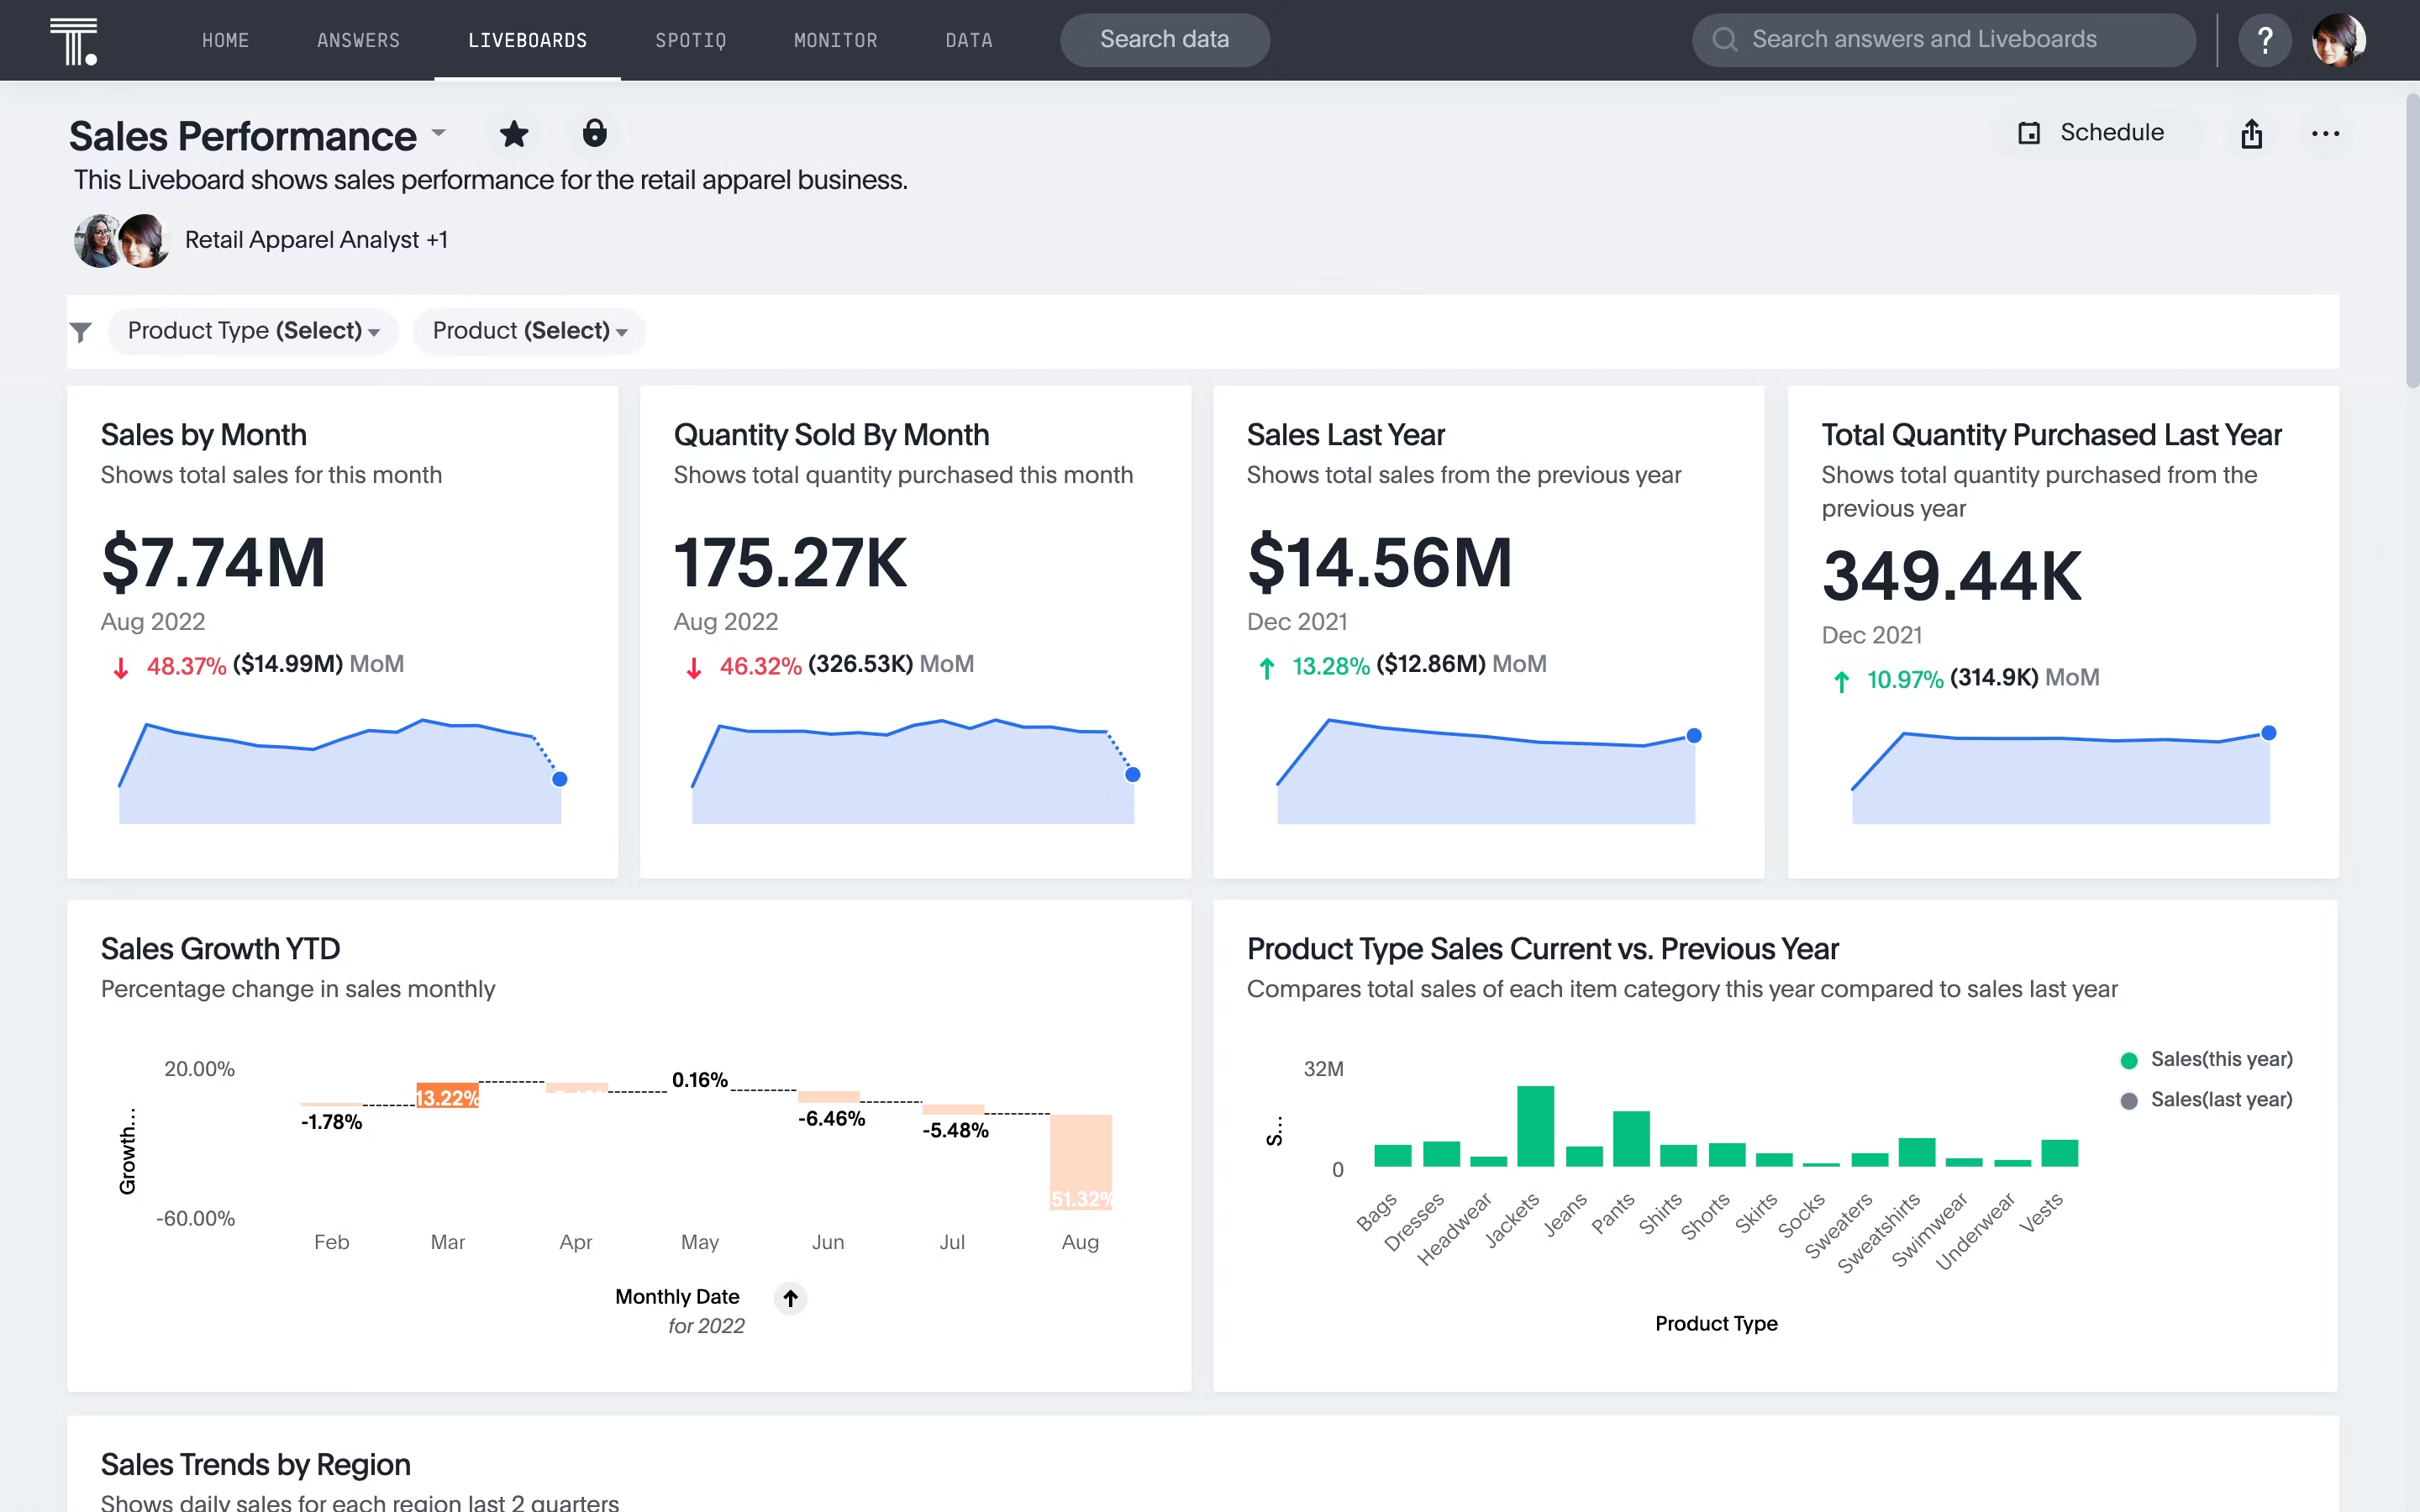
Sales reporting
Behind every great sale today is a litany of data that can be used to inform the broader sales process, improve cycles, and boost results. Sales reporting is used to forecast sales, analyze trends, track sales KPIs, analyze trends, and identify areas for improvement. This type of operational report typically includes data such as product sales, customer segmentation, and market trends.
Inventory management reporting
Businesses know they live and die by their ability to optimize their inventory. Inventory management reporting is used to track inventory levels, manage stock availability, ensure that the right products are in stock, and make sure teams are hitting their inventory management KPIs. This type of operational report typically includes data that can help optimize inventory such as inventory levels, order frequency, and product demand. By optimizing their inventory with ThoughtSpot, companies like Canadian Tire were able to grow sales by 20%, even as nearly half of their brick and mortar locations were closed during the pandemic.
Financial reporting
Financial reporting is used to track financial KPIs, identify areas of cost savings, and ensure that the organization is meeting its financial goals. This type of operational report typically includes data such as revenue, expenses, and cash flow. While these reports are often utilized by finance teams, and include data visualizations for finance professionals, they are a collection of insights that impact every part of an organization. Depending on the organization, these could also be used to report financial information to the public and regulatory bodies. Accordingly, these reports are often some of the most scrutinized examples of operational reporting.
Customer service reporting
By continually learning about their customers wants, needs, and behaviors, organizations that use data to improve their customer experience are able to delight and retain users year after year. Customer service reporting is used to track customer satisfaction, identify areas of improvement, reduce customer churn, and ensure that the organization is meeting its customer service goals. This type of operational report typically includes data such as response times, customer feedback, and service performance, and may be measured by customer service KPIs like net promoter score.
Production reporting
How quickly and how efficiently businesses can produce goods has a direct impact on their ability to grow and create profit. Production reporting is used to track production planning KPIs, performance, analyze trends, and identify areas for improvement to achieve these goals. This type of operational report typically includes data such as production output, equipment utilization, and safety measures.
Start Getting Better Insights
Key components of operational reporting
Building the right data pipelines, ensuring data cleanliness, transforming your data through ETL or ELT, all in a bid to create an operational report can make the entire process seem overwhelming. By breaking the components into discrete pieces, companies can easily implement operational reporting.
Data collection
The first step in operational reporting is to gather data from various sources. This includes data from internal systems, such as ERP and sales databases, as well as external sources, such as customer surveys or market research. Often this includes transforming data, either through ELT or ETL. Once the data is collected, it must be organized into meaningful categories and analyzed to identify patterns and trends.
Data analysis
Once the data is collected and organized, it needs to be analyzed to identify areas of improvement. This can include analyzing trends, comparing, performance against industry averages, and identifying opportunities for improvement. Data analysis can be done manually or with the help of business intelligence tools. The most successful companies have empowered business users and domain experts, not just data professionals, to use AI-Powered Analytics to ask and answer their own data questions as they build these operational reports.
Data visualization
Simply analyzing data is not enough; you need to be able to share the insights through your report in a way that others can quickly comprehend, which is why visualizing data in reports is so important. Data visualization is the process of presenting data in a graphical format to make it easier to understand and interpret. This can include using charts, graphs, and tables to display data in a way that is more easily digestible. By visualizing data, managers can quickly assess performance and make better-informed decisions. Ideally, look for a data visualization tool that allows you to create interactive data visualizations, so that as one chart sparks another thought or question, you can immediately explore it.
Self service reporting
Once the data has been collected, analyzed, and visualized, it needs to be reported. Self-service reports need to be clear and concise, providing a snapshot of performance and trends in an easy-to-understand format. Self-service reports should also include actionable insights to help managers make better decisions.
Types of operational reports
While operational reporting can benefit nearly every pocket of an organization, the kind of report that would be the most beneficial varies greatly. While every business is different, here are some common types of operational reports.
Daily/Weekly/Monthly reports
These reports are typically used to track performance on a daily, weekly, or monthly basis. They can include information on data KPIs, sales, customer service, inventory, production, and financial data. They are used to track progress toward goals and identify areas of improvement.
Exception reports
It’s great to know things are going according to plan, but it’s often more valuable to know when they aren’t - and why. Exception reports are used to identify and alert managers when performance deviates from the norm. They can be generated on a daily, weekly, or monthly basis and are used to identify any unusual or unexpected behavior.
Ad hoc reports
You won’t always be able to predetermine every report your company will need. Ad hoc reports are created on the fly, in real time for specific purposes and can include any type of report. They are usually used to examine a particular issue or trend in more detail.
Drill-down reports
How often was your first question your only question when it comes to business? Usually, that’s just the beginning, where every insight or answer sparks another more specific question. Drill-down reports are used to explore data in more detail. They allow managers to “drill down” into the data to analyze trends, identify areas of improvement, and capitalize on opportunities. Because data analytics tools like ThoughtSpot connect directly to the entirety of your data, you can drill endlessly, not just along predetermined paths.
What is the difference between analytical and operational reporting?
Analytical reporting is focused on understanding the data and drawing insights from it. This type of reporting is used to make decisions about strategic initiatives, such as launching a new product or entering a new market. Operational reporting, on the other hand, is focused on tracking and monitoring performance so that managers can make decisions on a day-to-day basis to identify areas of improvement and capitalize on opportunities. Analytical and operational reporting both serve an important purpose in any organization and should be used together to make informed decisions.
Best practices for implementing operational reporting
1. Define clear goals and objectives
Before implementing operational reporting, it is important to define clear goals and objectives. At this phase, include business users to ascertain the actual business challenge you’re solving and the requirements for solving this challenge. This includes understanding what data needs to be collected, how often it needs to be collected, how it should be reported, and how users expect to interact and leverage these reports.
2. Involve stakeholders in the process
It is important to involve stakeholders throughout the process of implementing operational reporting. This includes communicating the goals and objectives, collecting feedback on reports, and collaborating to identify areas for improvement.
3. Identify the right data sources
Reports are only as valuable as the data they are built on. It is important to identify the right sources of data to ensure the accuracy and quality of your reports. This includes understanding where data is stored, how it is structured, and any potential issues with the data, including any issues with data quality.
4. Choose the right reporting tools
Choosing the right reporting tools is essential for creating accurate and meaningful reports. It is important to choose tools that are easy to use, have good visualization capabilities, and allow for ad hoc reporting, especially if you are in a dynamic industry or market
5. Ensure data accuracy and consistency
Accuracy and consistency are key for operational reporting. It is important to regularly check the accuracy of data and ensure that it is being reported consistently, through statistical methods and data science, as well as cross checking with other data sources and domain experts.
6. Monitor and review reports regularly
Finally, it is important to regularly monitor and review reports. This includes checking for accuracy, data reliability, identifying any trends or patterns, and making sure that the data is being reported promptly. This will help ensure that operational reporting is as effective and useful as possible.
Get more meaningful insights from your operational reports
Operational reporting is an integral part of any business as it helps organizations track performance and analyze trends to make informed decisions. With the help of real-time data, operational reports dispense meaningful insights. It is important for businesses to plan their overall strategy in order to effectively generate and utilize operational reporting, so they can gain deeper visibility into their operations. When creating operational reports, it is essential to consider factors like types of report and resolution timeline. Best practices for operational reporting include speed optimization, intuitive development, understanding of user needs and automation. Following these tips can ensure that you get comprehensive data quickly, without exerting too much effort.
If you’re still unsure how to approach your operational reporting process or how to attain meaningful insights with the help of technology advancements, we recommend signing up for a ThoughtSpot free trial to explore its reporting benefits.


