


Just as a baker needs to understand the intricacies of each ingredient and step to perfect their cupcakes, manufacturers must grasp these key manufacturing metrics to optimize their operations.
Recent insights, including those from Deloitte, highlight a positive growth trend among US manufacturers. However, when we look beyond the numbers, we also notice that millions of manufacturers incur losses due to unexpected machine breakdowns, unplanned downtime, and lack of maintenance. To truly excel, it's essential to have a comprehensive understanding of operations, much like a baker's awareness of every ingredient's role in the final product.
As leaders look beyond traditional approaches, leveraging the right manufacturing analytics software, building their dashboards, focusing on the right metrics, and getting real-time insights can unlock fresh paradigms. This guide will explore the top manufacturing KPIs that can help you identify bottlenecks and build operational agility.
1. Overall equipment effectiveness (OEE)
Much like ensuring the oven temperature is just right for baking cupcakes, OEE ensures that manufacturing equipment is operating at its optimal efficiency. OEE, the worldwide gold standard worldwide for manufacturing efficiency, measures how effectively the plant and production equipment are utilized compared to their full potential.
This manufacturing KPI is depends on three significant factors:
Availability: Measures how often the machine is available for use, including the calculation of planned and unplanned stoppages
Performance: Measures how speedily the machine runs
Quality: Measures the total number of goods produced against planned units

To calculate OEE, you simply need to multiply the three factors listed above. This will help you identify:
Planned downtime
Production rejects
Rejects on startups
Machine breakdowns
Speed slowdowns
Micro stops
To improve the OEE rate, you should develop strategies to eliminate inefficiencies. Typically, the OEE rate of a company falls between 40% to 60%, which translates to efficient operation.
On the other hand, highly efficient factories strive to achieve a score of 85%. The only way to achieve this is by regularly monitoring your data, adopting digital solutions, and establishing stringent quality standards.
2. Cycle time
Cycle time in manufacturing is akin to the baking time for cupcakes. It's about ensuring that each product, like each cupcake, is given the right amount of time to be perfectly crafted. Cycle time measures the duration of transforming raw materials into finished products. This manufacturing metric helps reduce waste and improve product scoping. To calculate cycle time, divide the total time it takes to produce certain goods by the number of units produced.

To improve cycle time, you need to identify bottlenecks hampering your operations. While bottlenecks constantly change, you can start small by streamlining the process and reducing unnecessary setup activities. Regularly monitoring operational difficulties can also help. Just remember that improving your cycle time is sometimes linear and involves facilitating continuous improvements to the workflow.
Start Getting Better Insights
3. Scrap rate
Envision the process of baking cupcakes, only to find that a few aren't up to par and need to be set aside. In the manufacturing world, the scrap rate serves a similar purpose, pinpointing those products that aren't up to standard. Even after production is complete, manufacturers still have to ensure that any waste produced is recycled or properly disposed of. This manufacturing KPI represents the percentage of materials that cannot be recycled or restored, leading to their rejection. Such waste not only impacts the environment but also creates added costs for your business. To calculate how much scrap is generated throughout the manufacturing process, you divide the total scrap generated by the total number of goods produced.

To improve scrap rates, manufacturers must adopt sustainability practices. This includes using recycled materials in production, implementing a waste management system, and utilizing automation technologies to reduce production errors. These strategies help ensure you get the most out of your initial investment.
4. First-pass yield
Think of the first-pass yield as the initial quality check, much like inspecting cupcakes fresh out of the oven. Imagine this: you’ve baked cupcakes for your local bakery sale. However, a few didn't quite come out right, maybe sticking to the mold or cracking a bit. So you add a swirl of frosting or a sprinkle of toppings to ensure they are perfect.
Here, we are just talking about a few cupcakes, imagine this in large-scale manufacturing, where you produce thousands of goods per hour. The resources, time and additional materials required to fix even a minor mistake can quickly add up. Diving deep into the first pass metric helps you pinpoint and address the factors negatively influencing your production flow, aiming for fewer imperfections. To determine the first pass yield, divide the number of quality goods by the total number of goods produced.

Bosting the first-pass yield requires a keen eye on factors like machine uptime, operational efficiency, and production volume. Strategically orchestrating the entire sourcing and design journey in a structured manner is equally pivotal to hitting the mark consistently.
5. Customer reject rate
Just as a baker might receive feedback on a new cupcake flavor, the customer reject rate in manufacturing offers insights into products that aren't resonating with customers. This KPI for manufacturing represents the percentage of products that customers send back or reject. To determine this manufacturing metric:

A rising reject rate may indicate issues within the supply chain or perhaps a misalignment with market demands. Addressing these concerns is essential to ensure that every product meets customer expectations.
Reducing customer reject rate requires access to real-time insights that allow you to take swift action. Also, having a critical understanding of what influences customer experience can be a game-changer in bringing down the customer reject rate.
6. Cost of downtime
A sudden oven malfunction while baking cupcakes can disrupt the entire process. Similarly, downtime in manufacturing can lead to significant operational hiccups. When machinery grinds to a stop, it's not just about halted production; it's also about the financial implications.
To gauge the financial impact of unplanned downtimes per hour, consider three primary factors: R, E, and C. In this context:
R (Lost Revenue): Represents the revenue lost during the downtime based on revenue generated per operation hour.
E (Lost Productivity): Quantifies the cost tied to reduced employee output, often calculated as the wages paid to idle employees.
C (Cost to Recover): Accounts for the expenses of getting back on track, including repair and replacement costs.

While this formula provides a foundational understanding of the costs associated with downtime, there are other impacts to consider, such as Intangible Costs from damage to brand reputation, Inventory Costs related to storing raw materials, Expedited Shipping to meet delivery commitments, or Wasted Materials if they're time-sensitive.
It's essential to recognize that while the basic formula provides a snapshot of the immediate financial implications of downtime, the broader impacts can compound these costs, making unplanned disruptions even more expensive for manufacturers.
Addressing and minimizing downtime requires understanding its root causes and deploying a proactive response strategy. According to Forbes, these unexpected pauses can rack up as much as $50 billion a year. In a world where time is money, calculating downtime becomes imperative for companies to identify bottlenecks and apply strategies that ensure well-run, efficient operations.
7. Inventory turnover rate (ITR)
Imagine you're a baker, keeping a close eye on how swiftly those freshly baked cupcakes fly off the shelves. In manufacturing, the Inventory Turnover Rate (ITR) serves a similar purpose, offering a lens into the efficiency of product movement from stockrooms to sales. ITR is a pivotal metric that aids production leaders in making informed decisions. It reflects the speed at which a company's products transition into sales. To compute the ITR, one divides the cost of the total goods sold by the average inventory held during a specific period.

A dwindling ITR suggests that products might gather dust on the shelves, hinting at potential wastage or obsolescence. Conversely, a soaring ITR indicates adept inventory planning, ensuring timely restocking and brisk sales.
Enhancing the ITR isn't merely about stock availability. It's a dance between anticipating customer demand and mitigating potential losses. By harnessing the power of predictive analytics, you can glean insights into product movement, discern production needs, and gauge the market's pulse on how long it takes to sell your goods.
8. Production volume variance
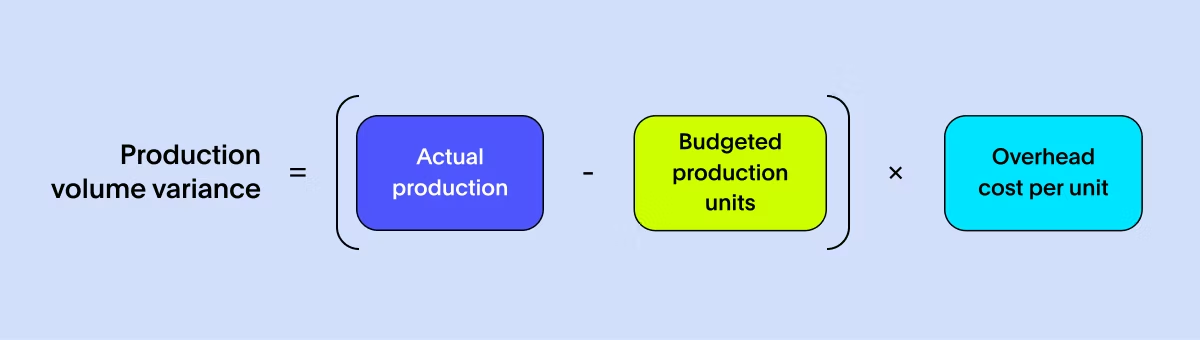
Imagine you've planned to bake a hundred cupcakes for a big event but end up with ninety or a hundred and ten. That's a variance in your baking output. Similarly, the Production Volume Variance measures the difference between planned and actual output in manufacturing. This variance provides insights into overhead costs, guiding manufacturers in making inventory and operational efficiency decisions. To calculate this manufacturing metric, subtract the budgeted production units from the actual production and multiply it by the overhead cost per unit.
A favorable variance might be like baking extra cupcakes due to a sudden surge in demand. Conversely, a negative variance is akin to falling short of the planned number.
Keep production processes highly efficient to improve your production volume variance. You can achieve this by investing in new technologies, reducing overhead costs, battling supply chain issues, or collaborating with reliable suppliers.
9. Supplier quality
Think of this as choosing the best ingredients for your cupcakes. The Supplier Quality Score evaluates the performance of suppliers, much like you'd assess the quality of your baking ingredients. Factors like defect rate, delivery punctuality, and customer service play a role. While criteria might vary, many companies use a rating system.
Dive deep into the performance metrics, understand where suppliers excel or falter, and set clear expectations. Many companies conduct regular one-on-one sessions and roll out programs to educate suppliers about evolving quality standards to keep expectations aligned.
10. Revenue per employee (RPE)
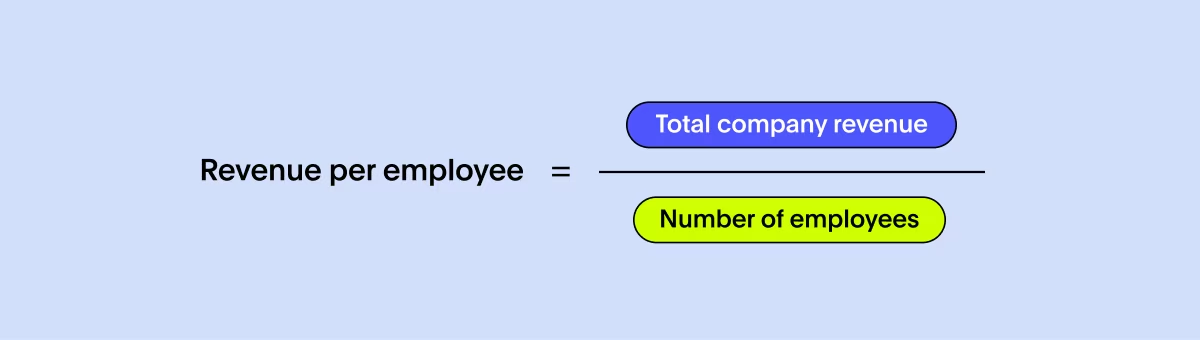
This manufacturing and procurement KPI is like understanding how many cupcakes each baking team member can produce. RPE gives a snapshot of the revenue contribution of each employee. To calculate this metric, you divide the total company revenue by the number of employees.
Conducting an audit is essential to address the problem and improve your RPE ratio. Benchmarking by comparing your metric with a competitor is a standard industry practice. Companies with high RPE continuously invest in employee development programs to bridge the skills gap and provide better growth opportunities.
11. Lead time
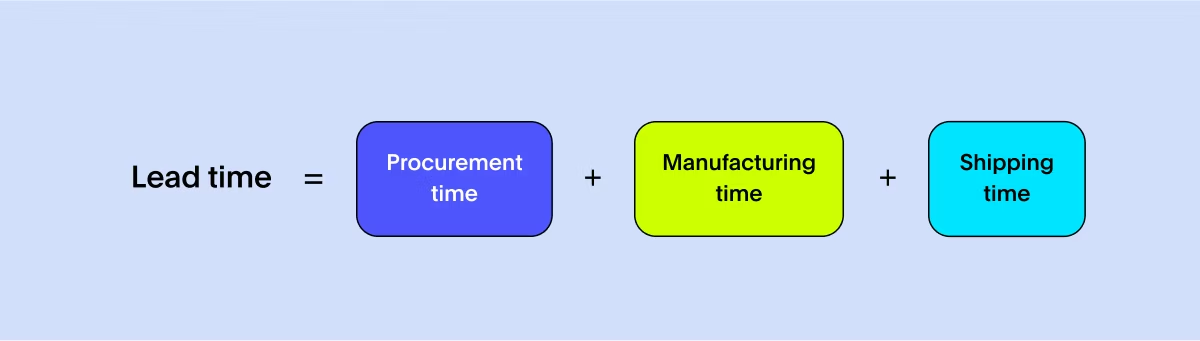
There's a process and a timeline, from deciding to bake cupcakes to having them ready for sale. Lead Time measures the duration from product conception to delivery —involving procurement, production, quality assurance, and delivery. Sum up the procurement, manufacturing, and shipping time to calculate lead time.
Creating smoother workflows, eliminating unnecessary steps, forging stronger collaboration with local suppliers, and integrating automation for faster production are all ways to improve lead times. Lead time is often confused with cycle time which calculates the duration to complete a particular task, whereas lead time considers the time for an entire business process.
12. Defect per million opportunities (DPMO)
Imagine finding a tiny flaw in one cupcake out of a million. DPMO offers a granular look at product quality, highlighting areas for continuous improvement. As the name suggests, DPMO gives you the number of defects per one million units. You can use a few different methods to calculate DPMO, but the most common is to divide the total defects found in a given sample by the total units produced, and then multiply by one million.

As per the Six Sigma methodology, companies with a DPMO value of 3.4 have efficient production processes. Anything above this value requires intervention. To improve DPMO, you should start by investigating your workflow. Once you have recognized where the issues stem from, you need to improve your quality control processes. Regular maintenance, using automated bots, and finding gaps in supply chains can go a long way in reducing DPMO.
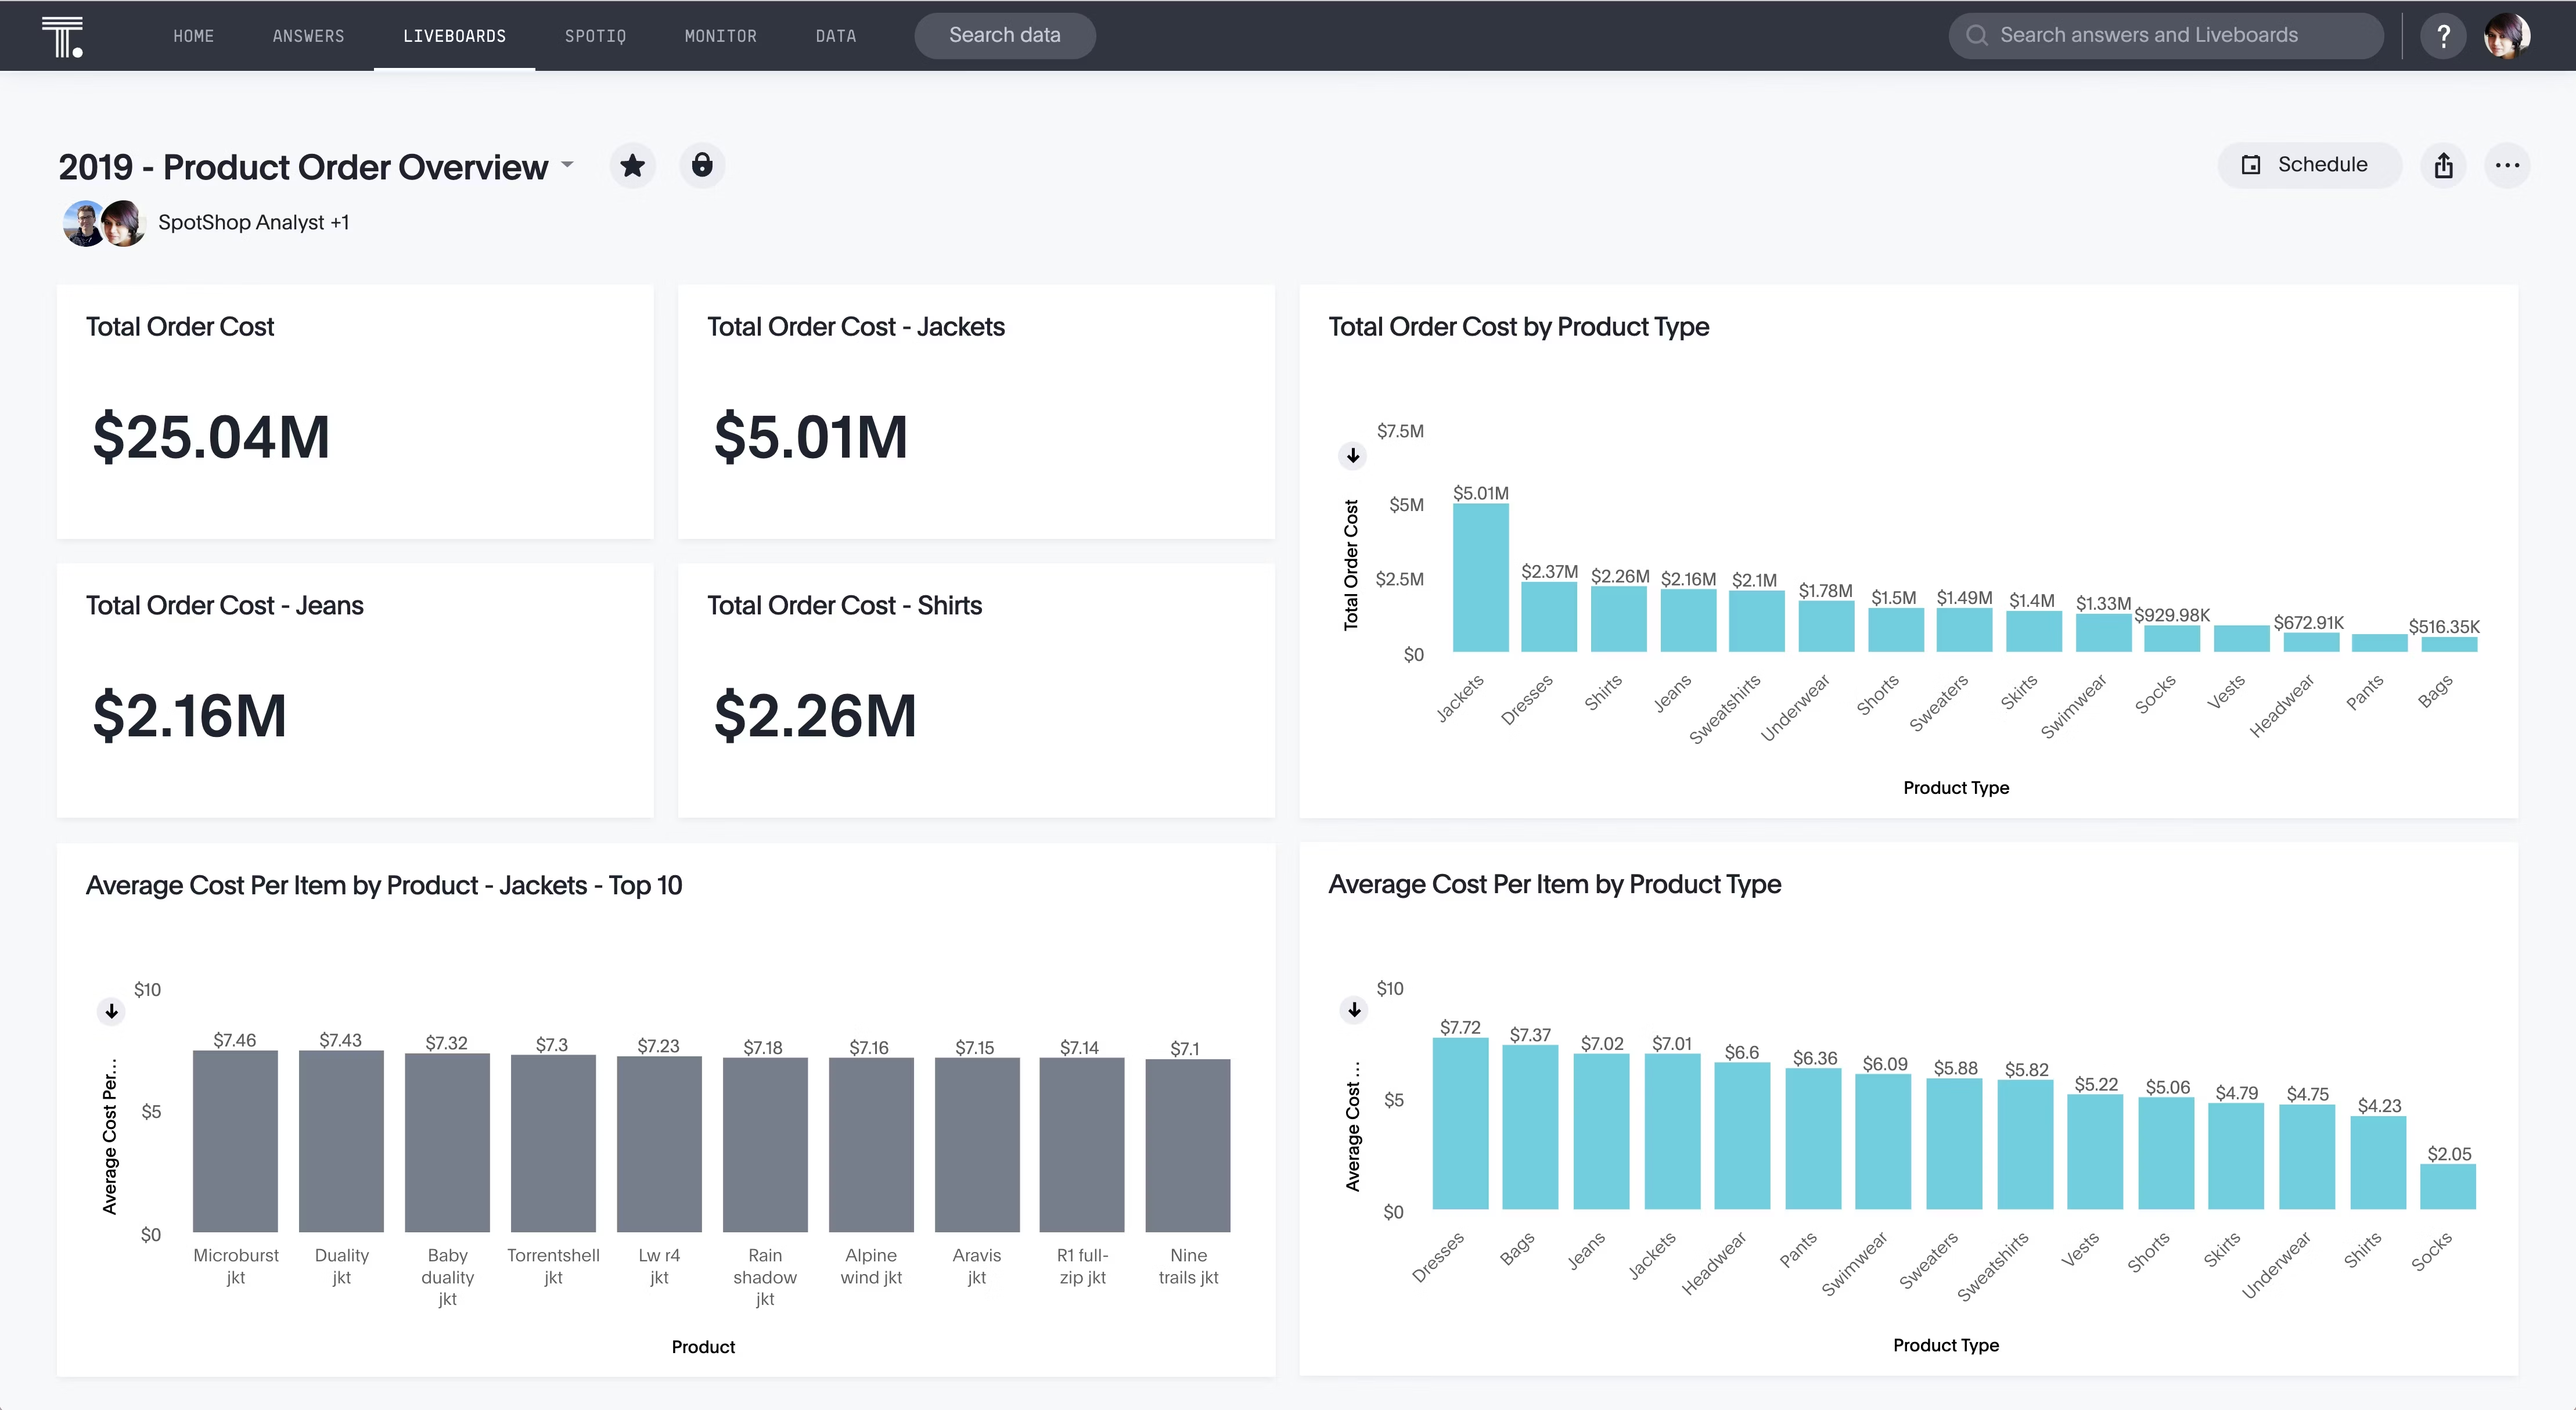
See real-time results by ditching your dashboards for Liveboards
Understanding and optimizing these KPIs becomes crucial for success as the manufacturing industry evolves. Just as baking the perfect cupcake requires attention to detail, precision, and constant monitoring, achieving excellence in manufacturing demands a similar dedication. While you can promptly assemble all the above manufacturing KPIs into a single dashboard, it still needs to give you access to real-time, drillable, AI-enhanced insights.
Traditional methods leave analysts working through ever-growth backlogs, creating timely delays and often preventing data-driven decision-making. The key to remaining competitive is ruthless prioritization and perfect deliveries. However, doing this requires real-time data insights.
With ThoughtSpot, you can build live dashboards with ad-hoc reporting to get to the ‘why’ faster. Manufacturers like Factory 14 and Fabuwood use Liveboards to lower lead times and enable quicker decision-making. Our interactive visualizations and natural language search experience empower every business user to gauge maturity, identify improvement areas, and track each manufacturing operation’s success.
After all this talk about baking, I might just need to grab a cupcake myself!
Want to see this for yourself? Sign up for a free trial and uncover insights that can transform your operations for the better.


