


Remember when answering a simple business question meant hours of data modeling, writing SQL, and piecing together reports? Yeah, luckily, those days are long gone.
Today’s BI reporting tools are built for the way you work, not the other way around. And the best part? You don’t need to be a data whiz to leverage it. With just a few clicks, you can turn scattered data into clear, actionable visuals that actually drive business decisions.
If you’re wondering how it all works and where to start, you’re in the right place. In this article, we’ll walk you through the world of BI reporting.
Table of contents:
Business Intelligence (BI) reporting is the process of collecting, organizing, and presenting data using different visual tools like charts, graphs, dashboards, and reports. Instead of drowning in spreadsheets, BI reporting gives you a clear view of key performance metrics, so you can identify trends, spot opportunities, and act fast.
Think of it like this: You’re running a fast-growing e-commerce brand. With BI reporting, you’re not guessing which products are trending, you’re watching it happen in real time. See a sales spike? Spot a dip in campaign performance? The insights are all right there, ready to act on.
It gives modern teams the power to turn data into decisions and decisions into actual business outcomes.
Let’s explore how modern BI reporting tools are helping businesses gain greater value from their data:
1. Faster problem solving
When every second counts, waiting for weekly reports from your data team only slows your business down. Your reporting tool should put insights in your hands, instantly:
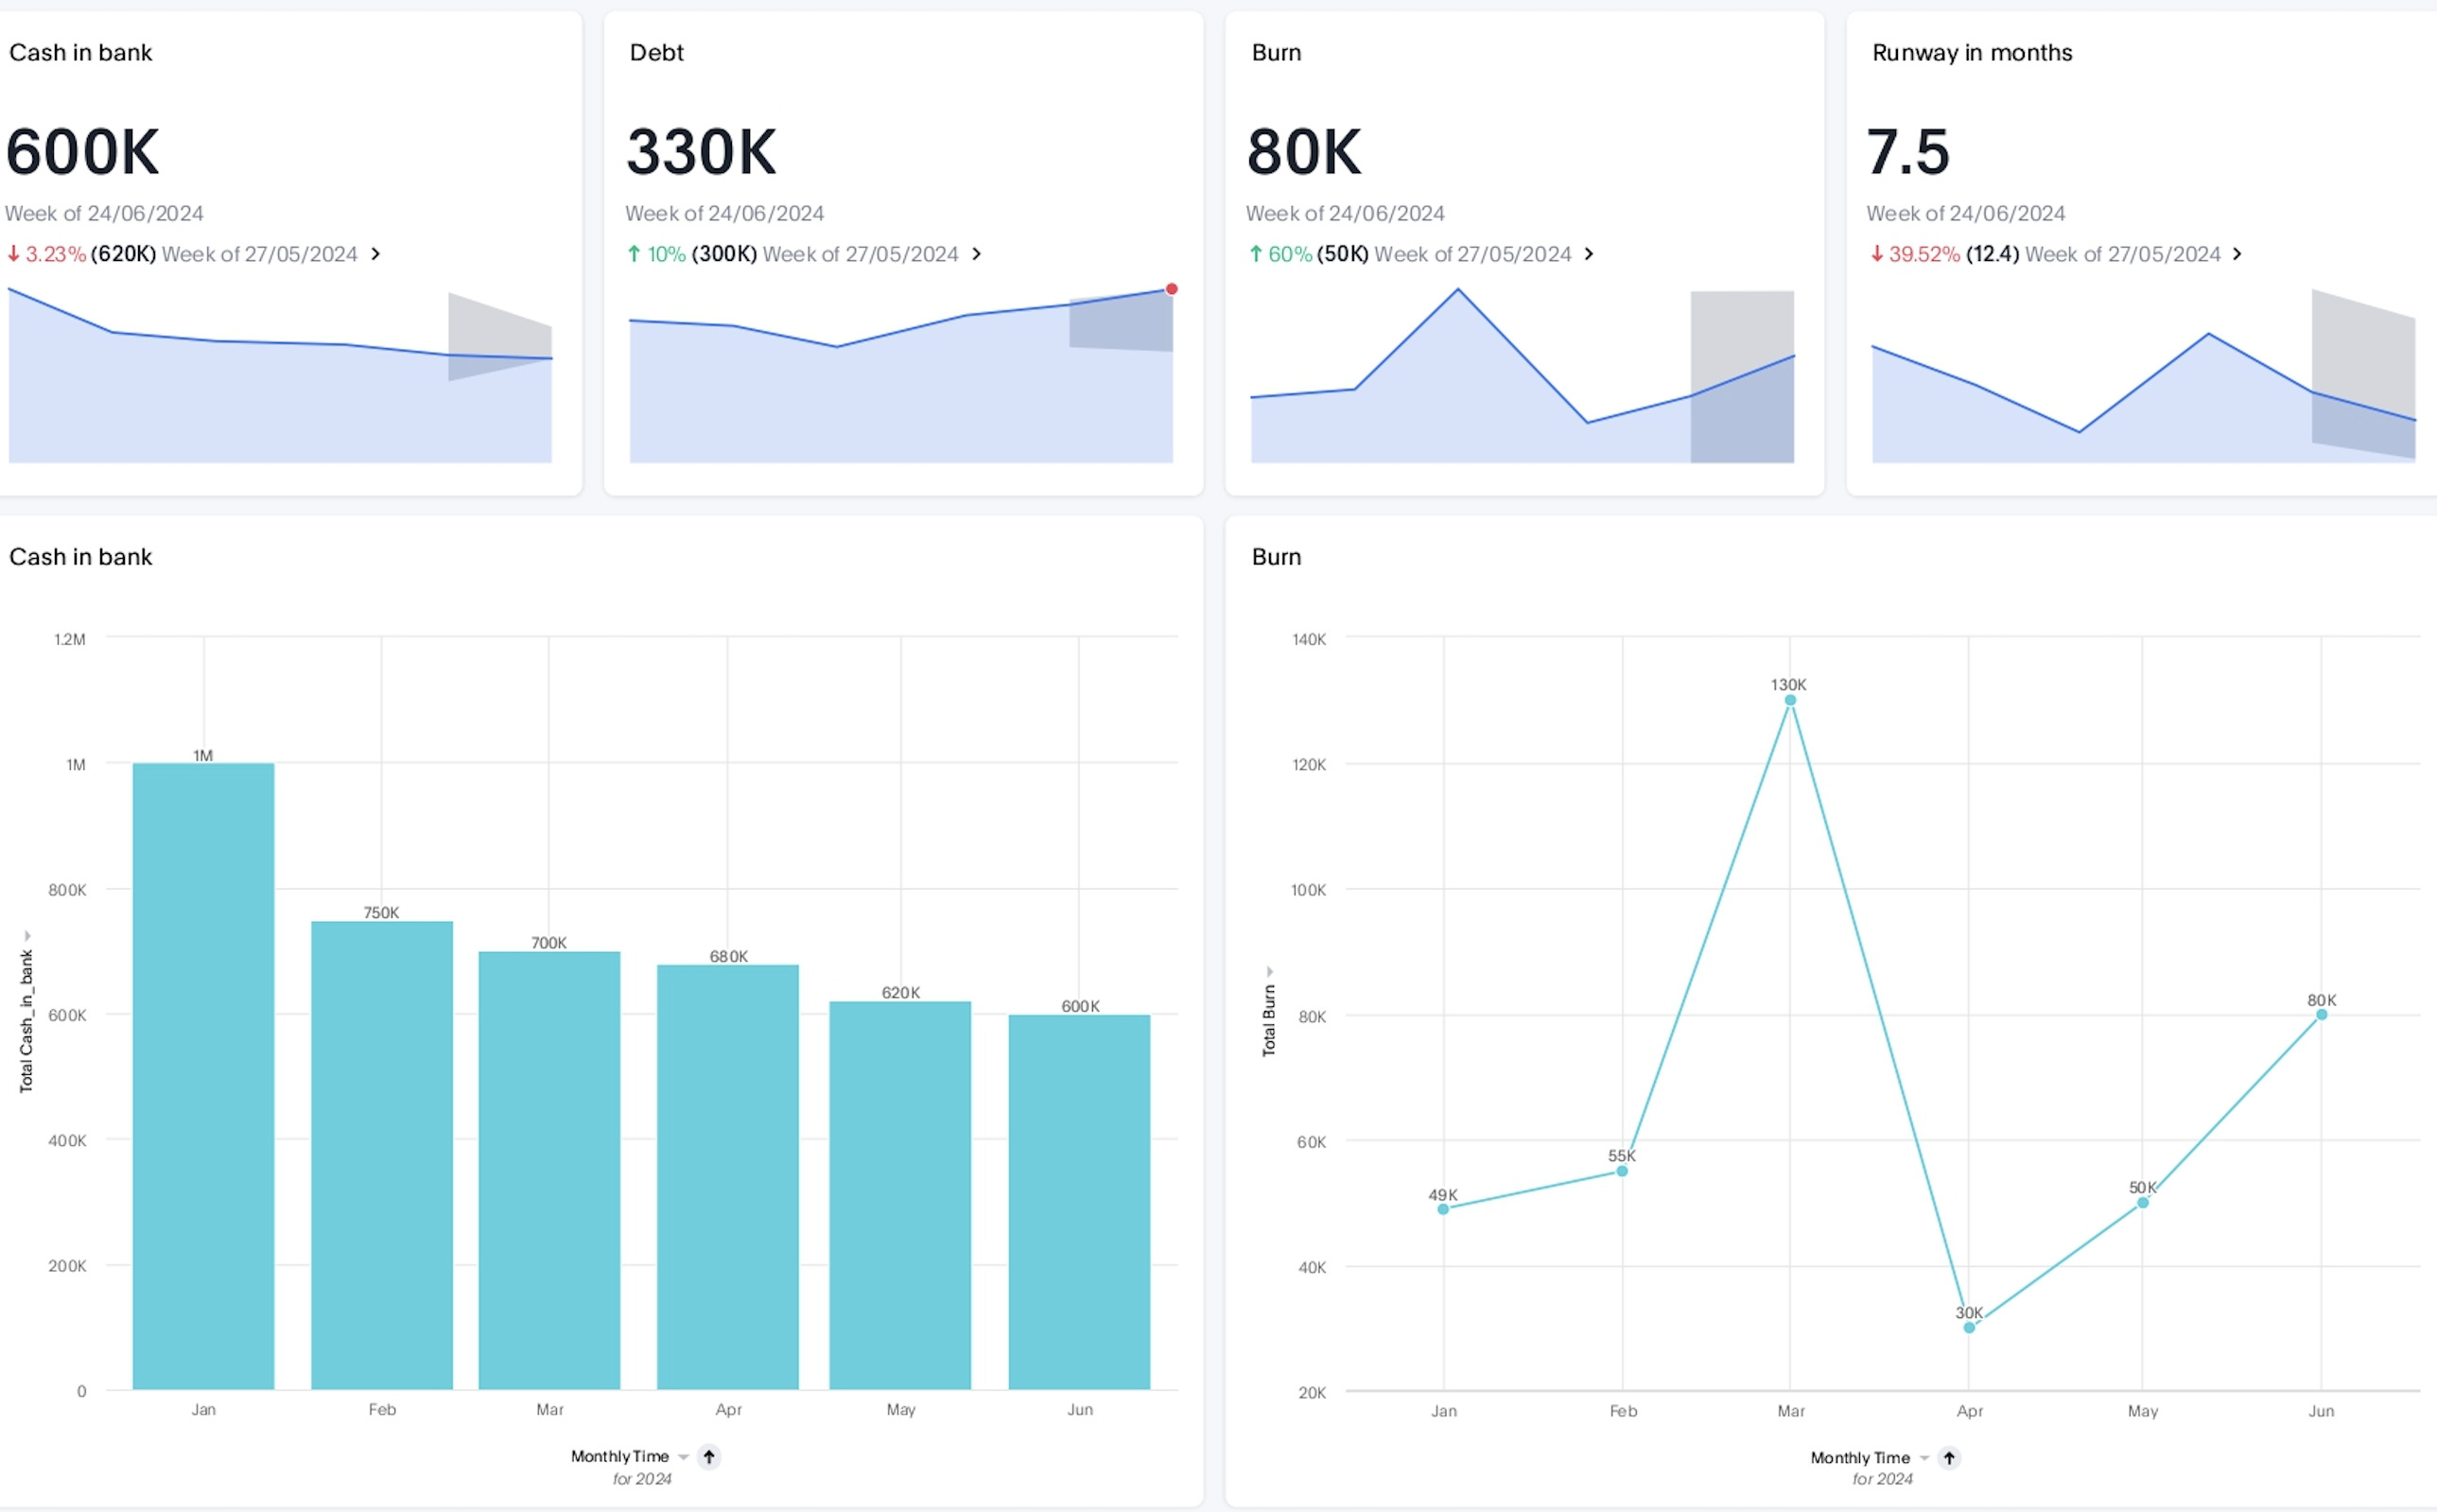
Track performance live with real-time metrics, so you can spot trends and respond to changes as they happen, not after the opportunity passes.
Drill into your dashboards to flag issues, compare segments, and discover what’s really moving the needle.
Understand your customers like never before—what they value, what they’re searching for, and how they interact with your product or service.
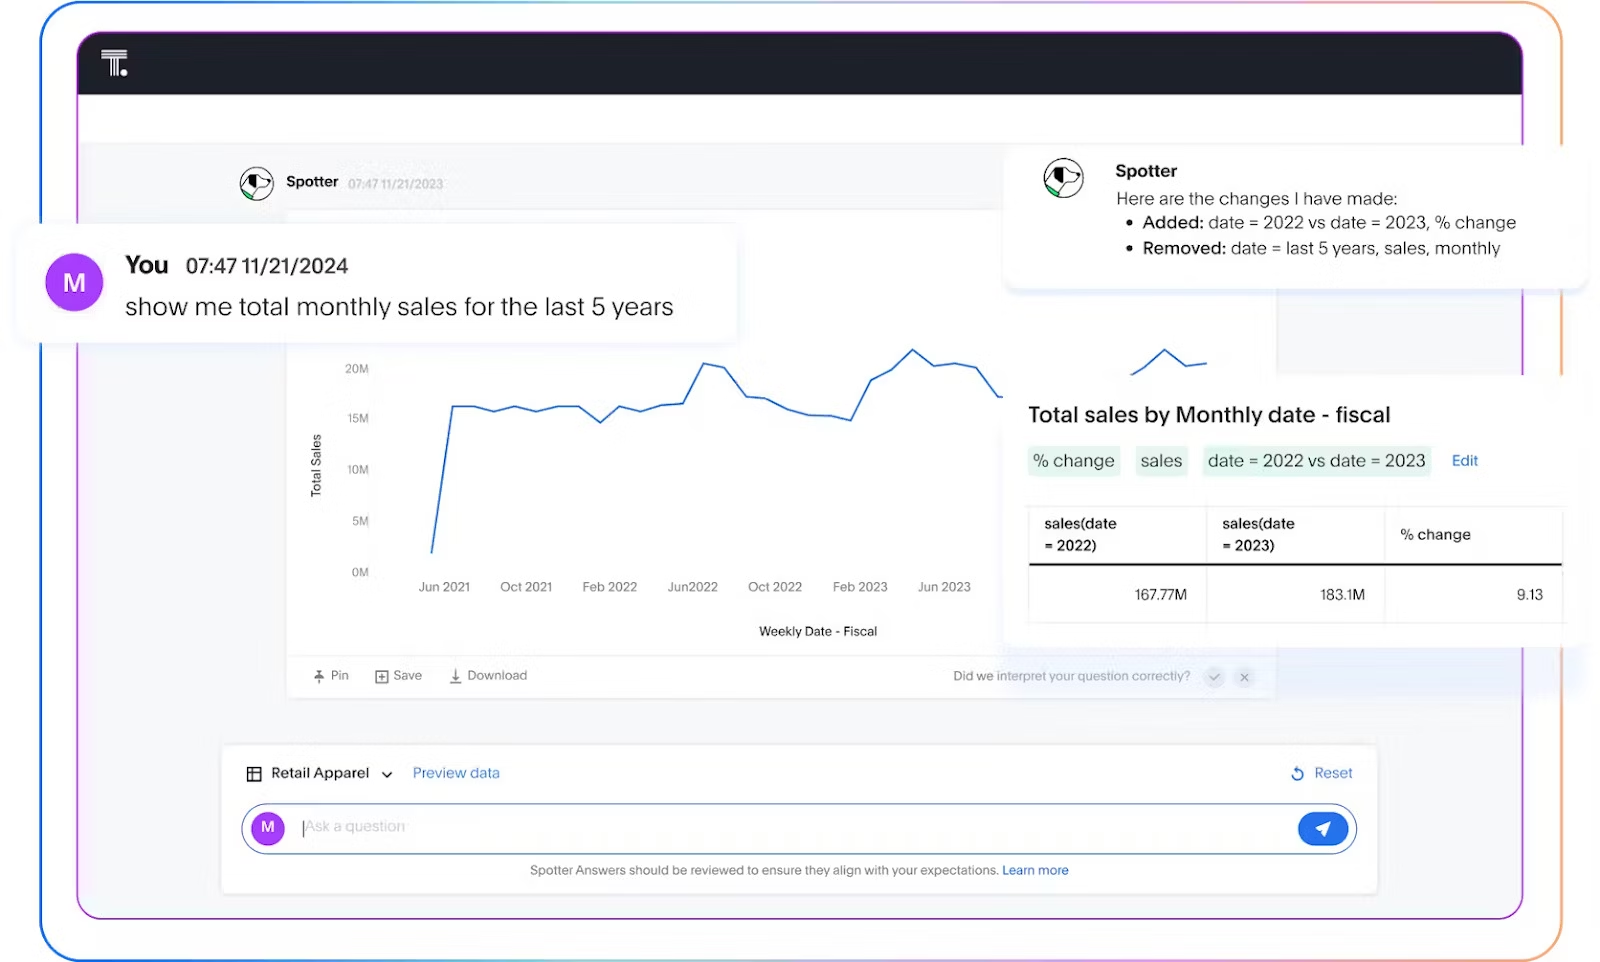
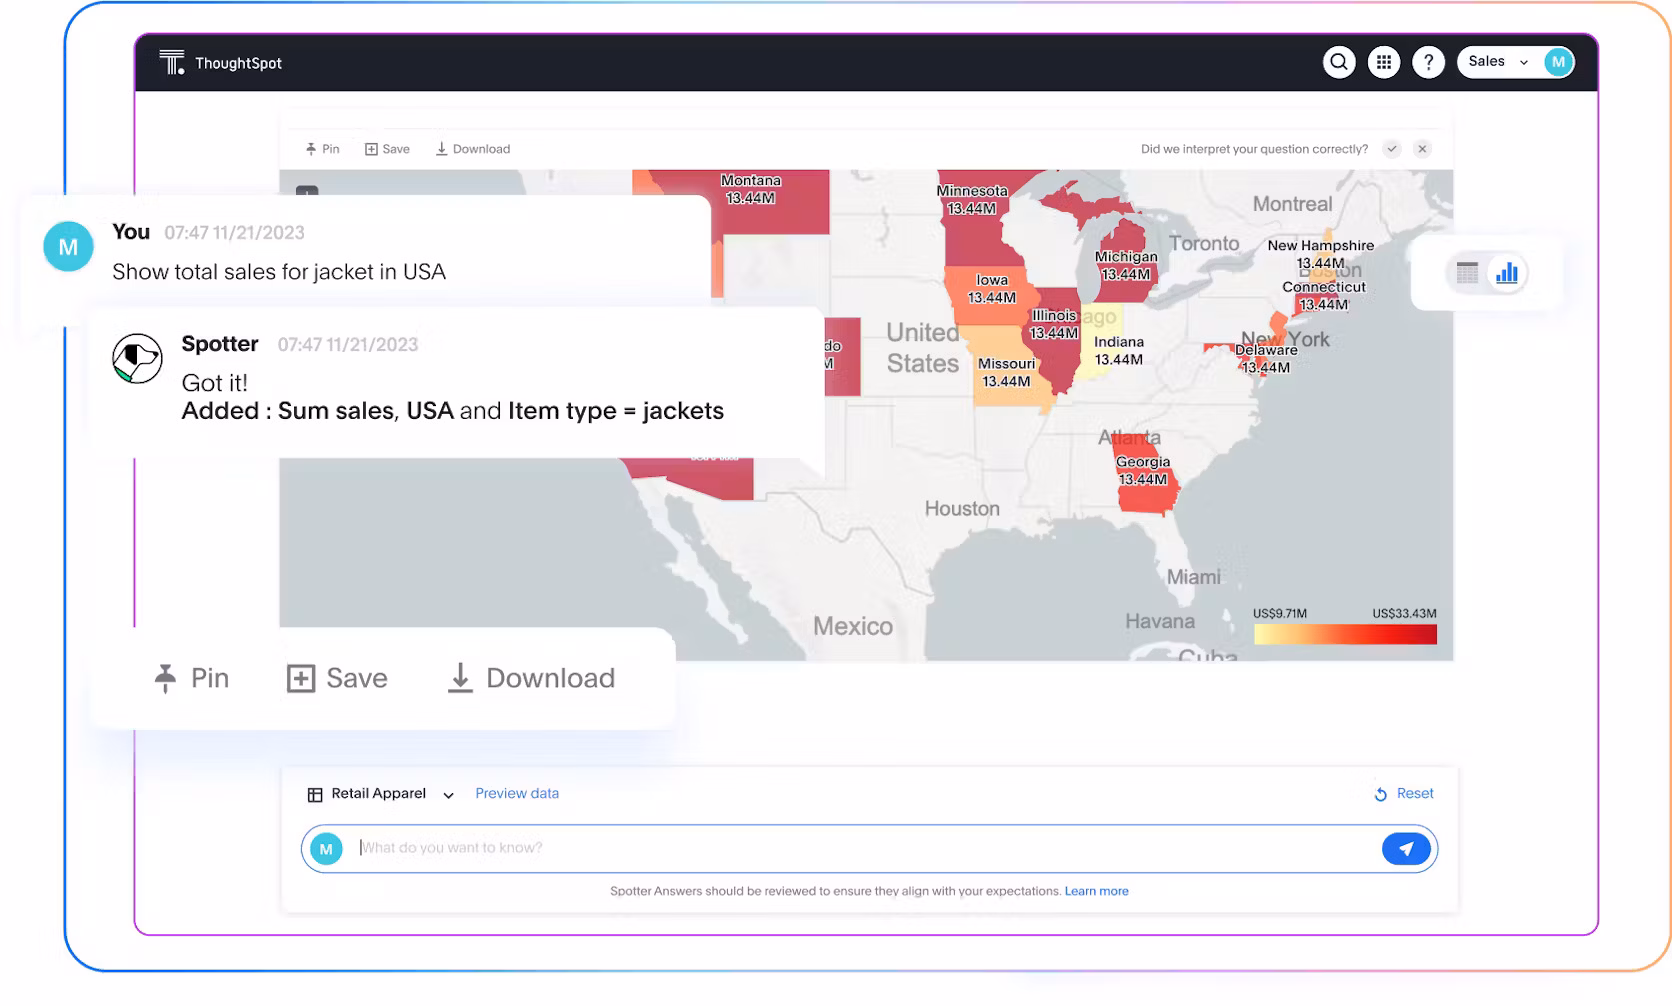
Whether you're investigating a regional dip in sales or preparing next quarter’s forecast, BI tools get you to answers fast. And with intuitive self-service platforms like ThoughtSpot, even non-technical users can ask simple, natural-language questions and get powerful insights in seconds.
2. Better data exploration
Great decisions start with better questions, but better answers come from deeper exploration. Modern BI reporting tools empower you to move beyond static charts and dig into the why behind your business performance:
Visualize trends over time to discover shifts in behavior, demand, or operations.
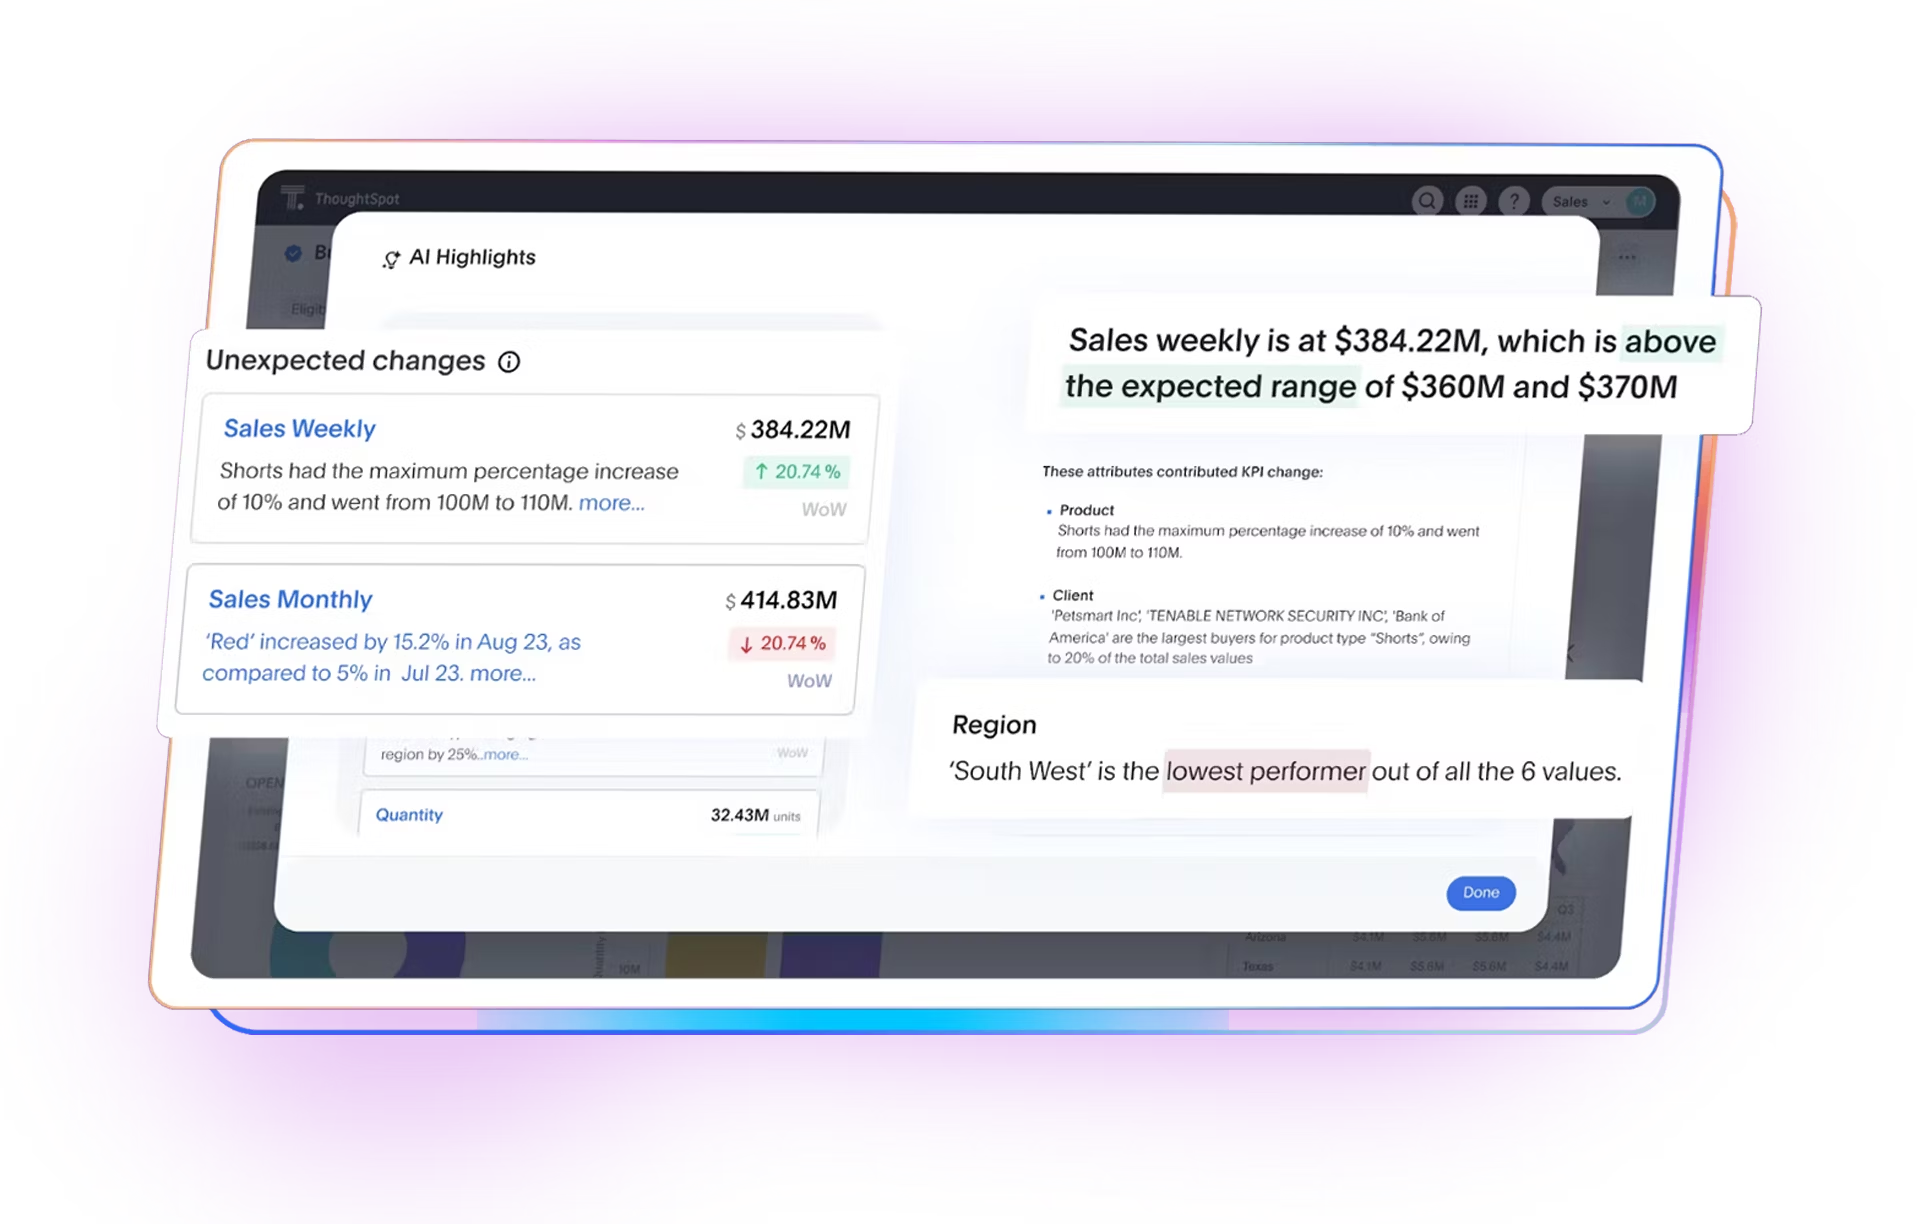
Explore data from multiple angles to spot anomalies and surface insights that might otherwise stay hidden.
Zoom out for the big picture or drill down into granular views—all without writing a single line of code.
The result? A clearer understanding of what’s driving growth, where risks are emerging, and how to stay ahead of both.
3. Improved communication
Data is only valuable when it’s understood and acted on. Today’s intelligence tools bridge the gap between data and decision-making:
Convert complex datasets into visual stories that everyone can understand.
Make it easy for teams to collaborate, share insights, and align around a single source of truth.
Allow you to comment, annotate, or highlight key metrics for a shared understanding across departments—from marketing to finance to operations.
When data becomes a shared language, your teams align faster, make smarter decisions, and move with confidence—together.
Business intelligence reporting can be divided into four main categories:
Descriptive reports
Descriptive analytics provide an overview of past performance and current trends, including data points like customer demographics, sales volume, cost analysis, and market share. They’re especially beneficial for tracking long-term performance or identifying changes in customer behavior over time.
Diagnostic reports
Diagnostic reports provide insight into why specific outcomes occurred, allowing users to pinpoint rifts in the customer journey, identify potential risk areas, or isolate root causes of issues. They also allow businesses to apply corrective measures and improve performance.
Predictive reports
Predictive reports provide an outlook on future performance, using historical data to make forecasts and predictions about products, services, and customer behaviors. They’re essential for planning and budgeting purposes.
Prescriptive reports
Prescriptive reports suggest a course of action for optimal results, providing deep insights into customer needs while offering recommendations on how to best meet those needs. With prescriptive reports, businesses can anticipate demands and adjust strategies proactively.
Let’s discover how BI reporting is driving data-driven decisions across different industries with real-world examples:
1. Financial industry
With the rise of digital banking, finance teams are drowning in data. BI reporting helps them cut through the noise—connecting insights from online transactions, payment history, and more to detect fraud, personalize offers, and deliver seamless customer experiences.
2. Healthcare industry
From patient trends to risk analysis, BI reporting empowers providers to act fast. By tracking real-time patient volumes, teams can spot bottlenecks, reduce inefficiencies, and make data-backed decisions that improve both care and operations.
3. Manufacturing industry
BI reporting brings visibility across the entire supply chain. Manufacturers can monitor sourcing, production, and shipping data in one place, so they can flag delays, manage costs, and keep operations running smoothly.
4. Retail industry
Retailers use BI to spot what’s selling—and what’s not. With real-time BI dashboards tracking sales by product, region, and channel, teams can double down on high performers, adjust campaigns, and forecast demand with confidence.
BI reporting follows four essential steps:
1. Gather and clean your data: Start by pulling data from your key sources—databases, spreadsheets, web services, third-party platforms, and more. Before analysis, it’s critical to clean and format the data for accuracy and consistency.
2. Analyze and interpret: Next, dig into the data to uncover trends, patterns, and anomalies. This is where insights take shape to help you understand what’s happening and why it matters.
3. Build your report: Combine your findings with the right visualizations like charts, graphs, or dashboards to tell a story that’s clear, compelling, and easy to explore.
4. Share and distribute: Finally, get the insights in front of the people who need them. Whether it’s via Slack, Teams, email, or embedded dashboards, make sure your report is easy to access, understand, and act on.
Business intelligence software
This is the engine behind your reports. BI dashboards pull data from various sources, then analyzes and organizes it into insights you can act on. Today’s tools are built for speed and scale, designed for the cloud, and ready to handle massive volumes of data in real time. While most modern data professionals prefer these cloud-native platforms, there are still users who rely on legacy, desktop-based BI tools.
Data visualization tools
Visualization makes the insights stick. These tools turn raw data into clear visuals—charts, graphs, dashboards—that help teams quickly spot trends and patterns. With the right tool, you can drill into your data and explore it from multiple angles, and no code is required.
Data stack
Underneath it all is your data stack: the storage, security, governance, and analytics infrastructure that powers your reporting. When your BI tool integrates with your modern data stack, you can run live queries on real-time data, so your insights are always fresh, accurate, and decision-ready.
For the most effective use of business intelligence reporting, here are some of the best practices you should follow when creating and using reports.
Setting clear KPIs and metrics: Define your business goals and key metrics before building your report. That way, every data point tells an intentional, cohesive story.
Using the right visualization techniques: The right visualization can turn complex data into an instant insight. Use charts, graphs, and dashboards that fit the data and make trends easy to spot.
Regularly reviewing and updating the report: Review and update your reports regularly to reflect fresh data, shifting priorities, or new business questions. This helps your reports stay relevant and actionable, not outdated or misleading.
Bring powerful BI reporting capabilities to your workflow
Today’s business environment can be easily characterized as fast-moving and customer-driven. To thrive in today’s competitive, customer-driven world, you need modern BI reporting capabilities that allow you to leverage the right data at the right time.
With ThoughtSpot’s Agentic Analytics Platform, you empower everyone—from your marketing to your customer support team—to discover decision-ready insights from their data. No matter where your business data lives or how specific your question is, ThoughtSpot delivers reliable answers in an intuitive, conversational experience, so you and your team can discover and decide without limits.
Ready to see it in action? Request a ThoughtSpot demo today to see how it can bring your data to life.


