With ever-increasing data volumes, companies’ data architectures are growing more and more complex. That, combined with traditional data warehouses and legacy business intelligence (BI), leads to high data costs, governance challenges, and increased time-to-insights. So, it makes sense that only 24% of surveyed organizations say they’ve succeeded at becoming truly data-driven.
But in those 24%, the world’s most innovative and modern companies are reshaping their data architecture to embrace the opportunities of the Data Renaissance—a time beyond manual number crunching, hard coding, and static insights that focus on data-driven, people-centered outcomes. By migrating your workloads to cloud-based data warehouses and utilizing cutting-edge BI solutions, your team can also take advantage of this AI-powered data revival and unlock the true value of your data.
Table of contents:
A data warehouse is a data management system that holds large volumes of structured and semi-structured data from different sources, including your CRM systems, point-of-sale transactions, and more. It acts as a single source of truth and facilitates efficient data analysis and reporting.
Business intelligence is the process of using technology to transform and analyze data for faster decision-making. BI enables businesses to visualize data, track KPIs, identify trends and opportunities, and take actionable steps to solve challenging business problems.
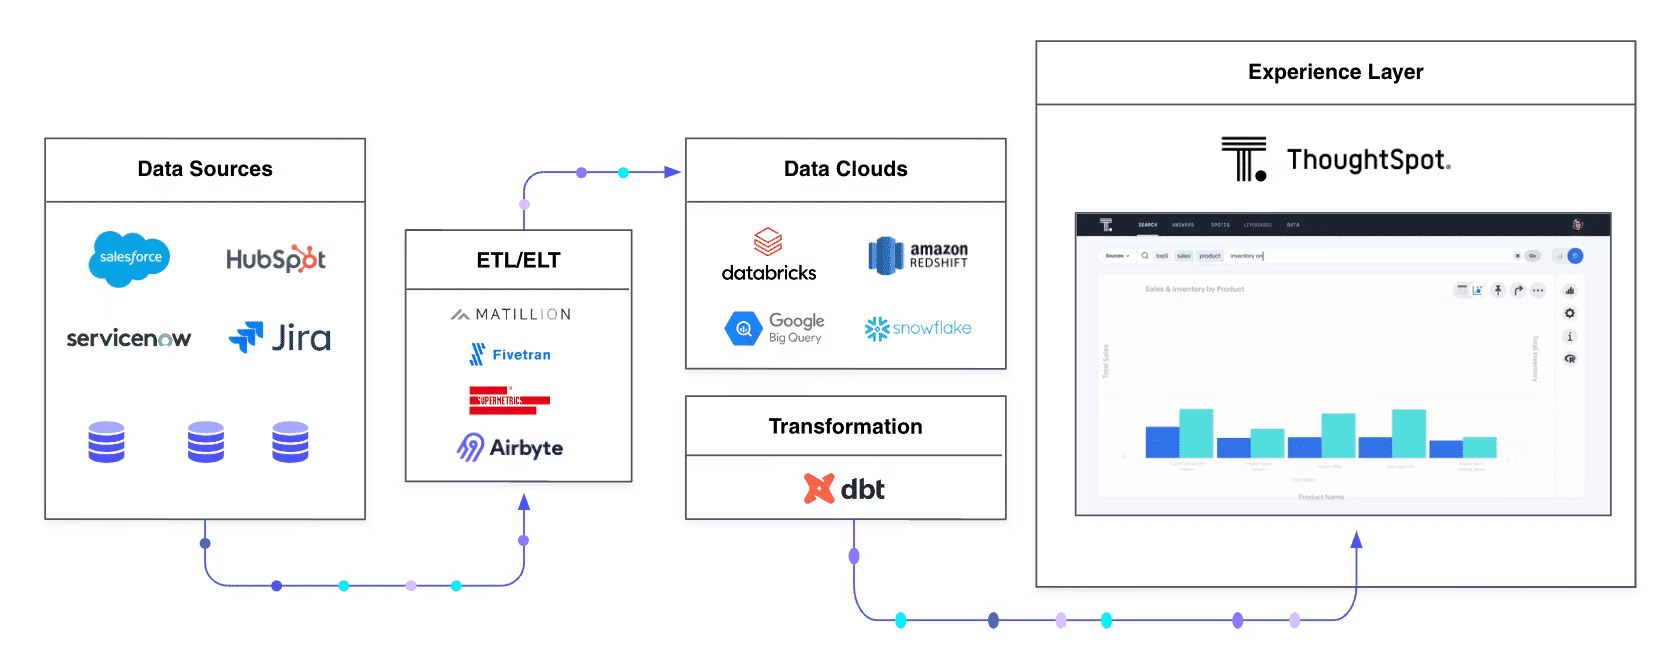
Data warehouse and BI solutions are part of the modern data stack, which helps businesses optimize the process of collecting, processing, storing, and analyzing data. Here’s how these components work together:

Data collection: Data must be extracted from its data sources. Tools like Matillion, Airbyte, Fivetran, and Supermetrics help data teams organize the data in preparation for the cloud data warehouse.
Storing: After extracting data using extract, transform, load (ETL) tools, the data will be stored securely in your data warehouse. Major players in this space include Databricks, Snowflake, Google Cloud Platform, and AWS.
Processing data: Using transformation tools like dbt or looker allows you to prepare your cloud data for analytics—these tools are often referred to as the semantic layer. Extract, load, transform (ELT) is an alternative data transformation method that occurs in the cloud data warehouse.
Applying analytics: Once your data is in your data warehouse, BI tools like ThoughtSpot can help you run real-time data analysis, create interactive visualizations, and gain AI-generated recommendations and insights to make informed decisions and solve complex business challenges. With quick and seamless connections with all major cloud data warehouse providers, you can easily deploy ThoughtSpot and start generating real-time insights within minutes, not weeks.
Data warehouse and BI are distinct yet related concepts. While a data warehouse offers a data storage solution, BI makes data accessible to users, enabling them to interact, explore, and make informed decisions at scale. Without the right BI tool, the data is lying dormant in the warehouse—you’re spending money on storage without deriving any value.
By combining modern data warehousing and BI solutions, you can make the most of your data, using insights to optimize business processes, reduce costs, enrich existing products, and create new business lines. This is how you use data to drive business outcomes and create a competitive advantage:
1. Data mining
Data mining, also known as knowledge discovery, helps uncover trends, spot anomalies, and identify relationships within a large dataset. Visualizing warehouse data in your BI tool helps you identify relevant patterns, establish relationships between elements, and even predict future outcomes based on your business objective.

2. Data storytelling
The more data you gather, the harder it becomes to understand. Thankfully, data visualizations help you create engaging data stories, making insights digestible and actionable. By fetching relevant datasets from your central repository, modern BI tools can quickly render interactive visualizations, giving you the power to uncover hidden patterns.
3. Ad-hoc queries
Ad-hoc queries allow users to ask and receive answers to questions in real-time. Since a data warehouse supports streaming data, you can deploy BI tools and create on-demand reports and dashboards in response to an immediate need or question.
Consider Cox 2M. The company was generating 13 billion-plus new rows of data per year and struggled to analyze data with legacy BI tools. Data costs to run ad-hoc analysis and reporting were also rising—reaching a staggering $90,000.
To tackle this challenge, Cox 2M adopted ThoughtSpot as it connects directly with Cox 2M’s existing modern data stack, including PubSub, Dataflow, Data Stream, Data Form, and Google BigQuery. With ThoughtSpot, the company reduced time-to-insight by 76% and saved up to $70,000 in data costs. This example proves that BI is the ultimate key to driving outcomes.
4. Deeper data exploration
Although you can store limitless data in a warehouse, deriving value from it is only possible when you dig deeper. Using a data warehouse, you can prepare data for analysis and utilize BI tools to slice and dice into data. Doing so helps you discover hidden insights and identify the root cause of inefficiencies, propelling you to take action.
This was the case with HP. Here’s how the tech giant leveraged Snowflake and ThoughSpot to explore data and generate real-time insights:
HP managed data exchanges with thousands of partners for product tracking, sell-through inventory, and more. As the company grew, HP struggled to manage diverse data sources and their data team spent more time on data analysis requests rather than focusing on more strategic initiatives.
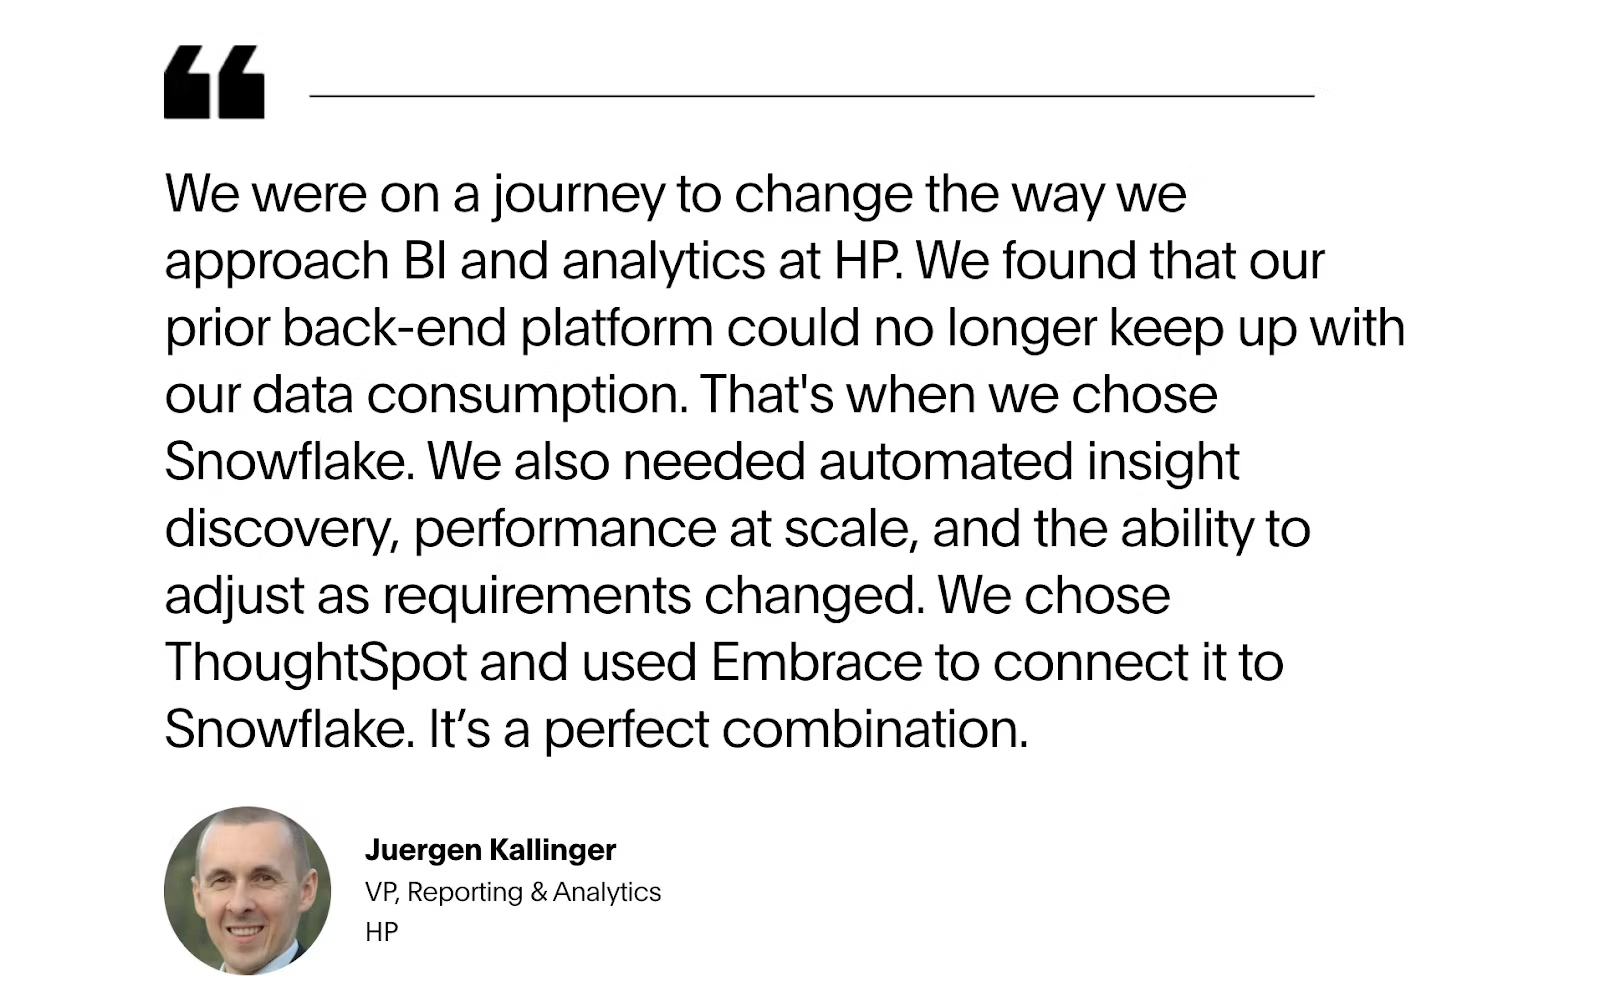
The tight partnership between Snowflake and ThoughtSpot helped HP generate over 155,000 queries in six months, and the company reduced time-to-insight by almost 50%. This quote by Juergen Kallinger, VP of Reporting & Analytics at HP, highlights the same:

5. Monitoring critical KPIs
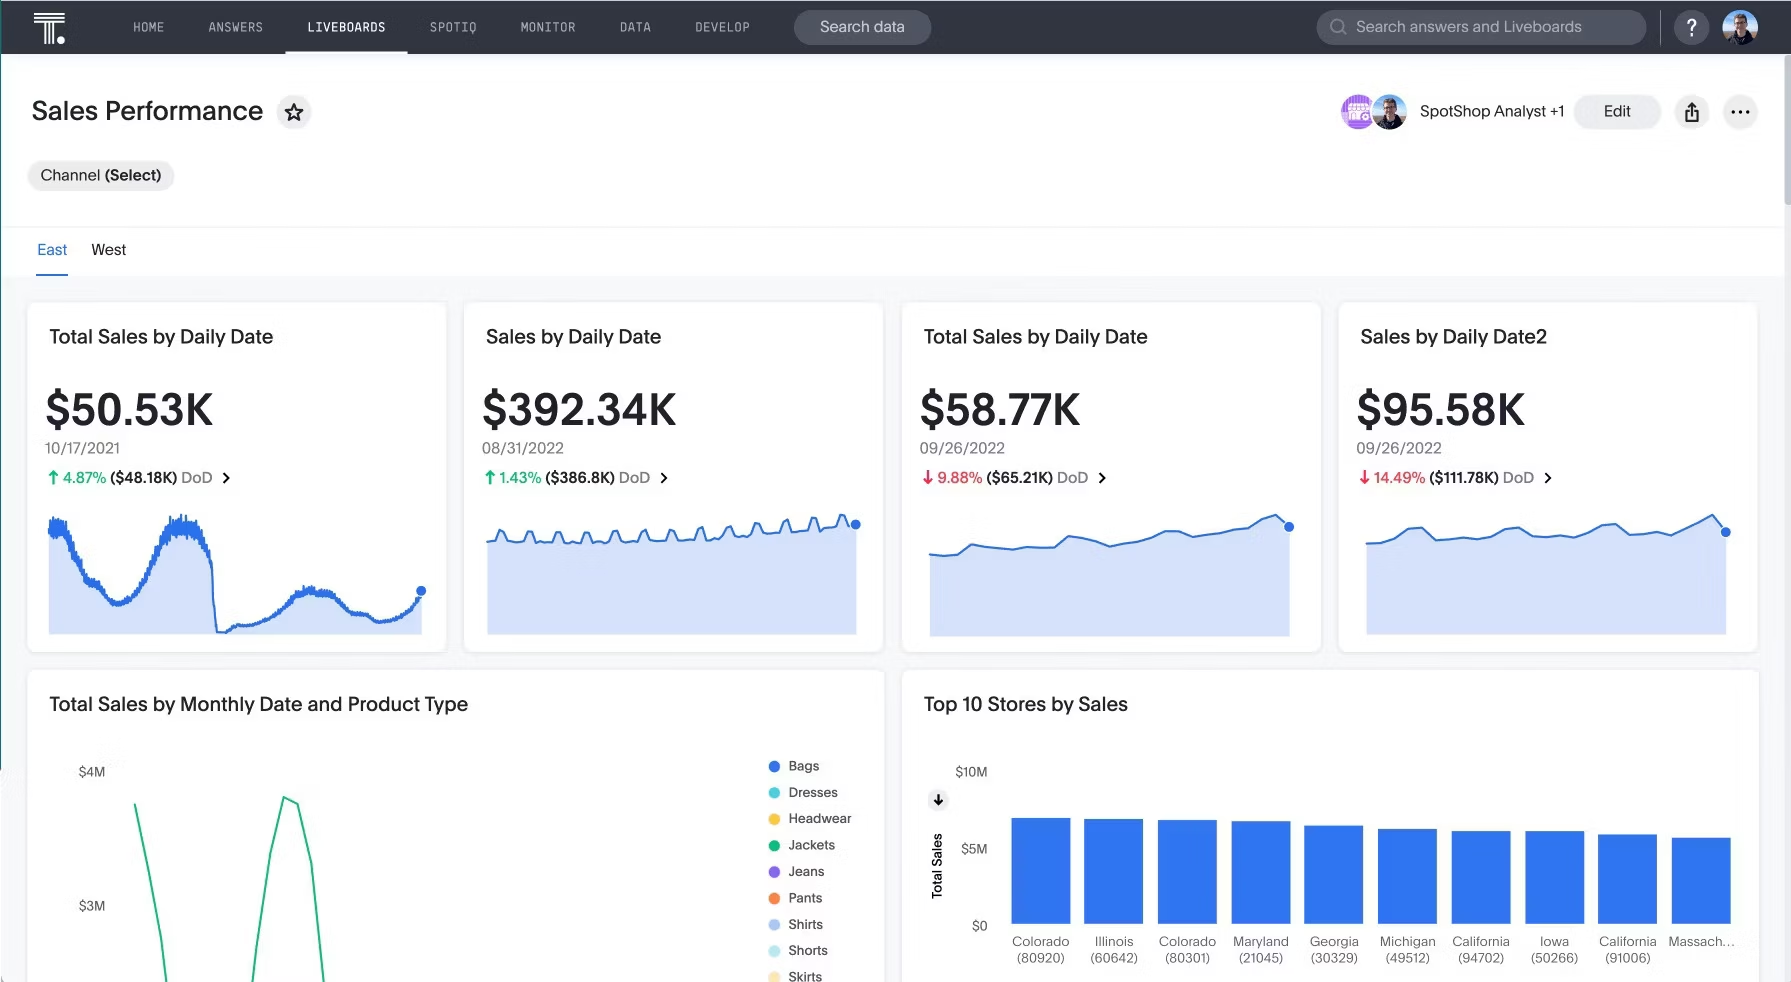
Tracking and analyzing quantifiable indicators can help you improve project or team performance, create actionable strategies, and find growth opportunities. By leveraging data warehousing and BI, you can remove the need to go back and forth between multiple data sources. Instead, you’ll get all the answers you need in a governed, interactive dashboard, enabling faster problem-solving and real-time collaboration.

Businesses are more talk than action when it comes to deriving value from data. If you want to create a real impact, having a solid data foundation and an intuitive BI solution is non-negotiable.
Leverage ThoughtSpot’s AI-Powered Analytics to derive maximum value from your data. Sign up for a ThoughtSpot demo today.


