


Your team has more dashboards than ever. Sales down in Q3? There’s a chart for that. Customer engagement flatlining? You’ve got graphs on graphs.
Dashboards are great at telling you what’s happening, but the moment you ask why, you’re chasing numbers across tools, digging through reports, and coming up short. Problems repeat, stakeholder questions resurface, and every fix creates a new fire.
Here’s the truth: you don’t need more dashboards, you need better answers.
Root cause analysis gives you just that. It cuts through the noise, connects the dots across data points, and pinpoints the exact cause behind performance shifts.
Let’s see how it all comes together.
Table of contents:
Think of root cause analysis as your business’s problem-solving engine. It’s a structured way to investigate the root causes behind problems so you can identify the right solutions.
It works by breaking your data down into smaller segments and looking for relationships between different data points. This helps you identify correlations, patterns, and anomalies across your data, revealing the true source of the issue.
Say your dashboard shows churn is rising. That’s a signal, but what’s the story behind it?
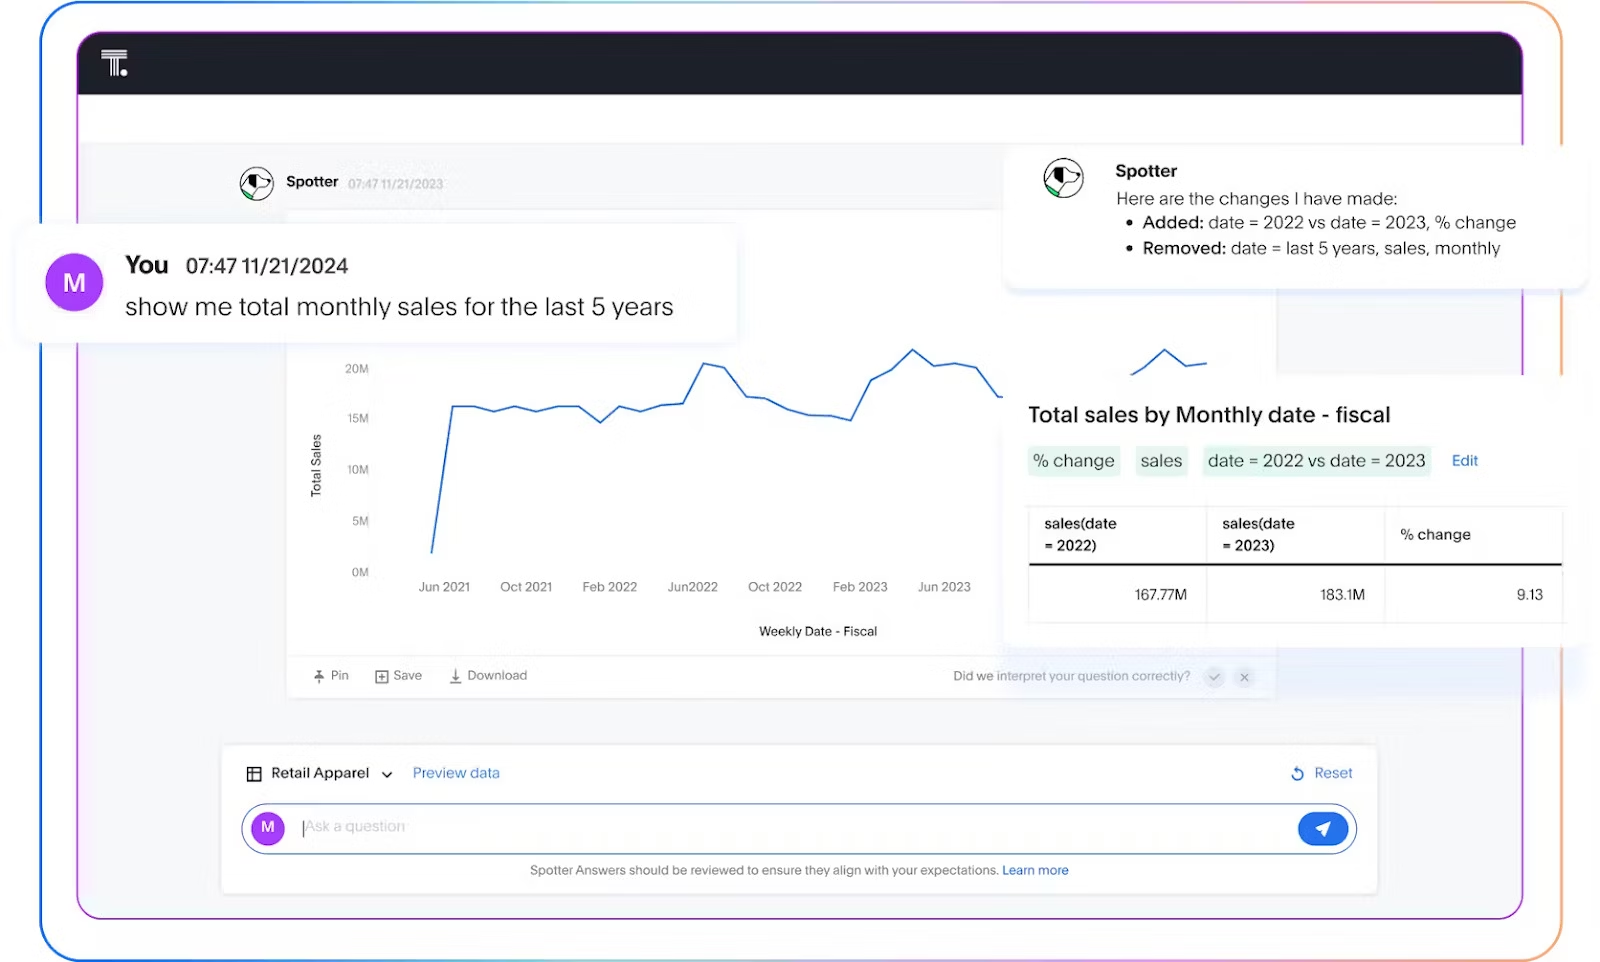
Root cause analysis helps you map the customer journey, dig into behavior patterns, and trace the issue back to its origin. And when paired with a modern BI solution like ThoughtSpot, data analysis becomes even more powerful. With Spotter as your AI Analyst, you can ask questions in natural language, drill into live data, and get automated insights to move from ‘what happened’ to ‘why it happened’.
With that level of clarity, you're not fixing symptoms: you’re resolving the real issue.
Better visibility into what’s really going on
It’s easy to get stuck in reporting mode. When metrics fall and charts become confusing, you can end up spending hours trying to figure out what went wrong.
Root cause analysis brings order to the chaos. It pulls together data from different systems, helping you truly understand the problem:
Deeper pattern recognition: By applying correlation techniques, you can discover meaningful patterns in your data and hidden cause-and-effect relationships behind performance shifts.
End-to-end traceability: Mapping the full chain of events—from the first anomaly to its ripple effects—shows where the issue started, how it spread, and where to intervene.
Once you have the full picture, you can act with confidence and context.
Faster execution, smarter decisions
Understanding the problem is only half the battle. The real challenge is deciding what to do next and moving fast.
Root cause analysis gives you an edge here by eliminating the guesswork and turning unconnected insights into focused action.
Prioritize what matters most: Root cause analysis helps you separate high-impact issues from background noise. With a clear view of what’s costing you performance drops, you can channel time, budget, and effort to where it truly counts.
Move as one team: When product, marketing, and CX are working from the same source of truth, there’s no room for misalignment. Everyone’s working toward the same goal, leading to faster decisions and smoother execution.
With this kind of approach, insights don’t just sit on a dashboard; they guide decisions, align teams, and accelerate impact.
Reduces risk before it escalates
Small problems rarely stay small. A delay here, a misstep there, and suddenly you’re looking at missed targets, customer churn, and operational friction across all systems.
Root cause analysis helps you catch these problems early on before they start eating into your bottom line.
Spot early signals: With agentic analytics, anomalies, outliers, and subtle performance shifts are flagged automatically, giving you a critical head start before traditional dashboards even notice.This gives you a critical head start to intervene before damage is done.
Prevent repeat problems: Once you know what triggered the breakdown, you can fix it at the source. That means fewer quick patches, tighter processes, and fewer repeat disruptions.
This isn’t just about reducing reaction times, it’s about building a more resilient, scalable system that’s ready for the unexpected.
Events and causal factor analysis
When something serious happens, like a major system failure or operational breakdown, you need a clear way to understand what went wrong. This method guides you step by step, building a timeline of events—what happened, when it happened, and which factors triggered it.
For example, time series analysis can help reveal patterns or anomalies over time, while events and causal factor analysis can then pinpoint the root causes and prevent the issue from recurring. Together, these approaches give you a clear understanding of complex incidents and help ensure they don’t happen again.
Change analysis
Sometimes, all it takes is one small change to throw everything off. Change analysis helps you pinpoint exactly what shifted by comparing how things worked before and what’s different now. It’s a powerful way to trace those ripple effects when processes suddenly stop running smoothly.
Fishbone diagram
Also known as the cause-and-effect diagram, this tool helps you organize all possible causes of a problem into clear categories, like people, processes, tools, and environment. With this method, you can align events and surface causes you might not have thought about otherwise.
Pareto analysis
Pareto analysis helps you focus on the issues that matter most. It’s based on the idea that roughly 20% of causes are responsible for 80% of your problems. Instead of trying to fix everything at once, this method helps you prioritize the few things causing the biggest impact, so you can redirect your time, budget, and energy to where it actually counts.
Scatter Diagrams
This is the perfect visual tool for testing cause-and-effect assumptions. Say you're seeing more late deliveries. Is that tied to shipping distance or warehouse load? Scatter plots help you visualize and validate these relationships with real datasets. If the pattern is clear, you’ve found a lead worth chasing. If not, you avoid wasting time on a false cause.
Five ‘whys’
This is one of the simplest diagnostic tools. You start with a problem and keep asking ‘why?’ around five times until you reach a conclusion. It’s an easy way to go beyond symptoms and get to the heart of an issue, especially during quick team reviews.
Step 1: Clearly define the problem
Start with a specific and measurable problem statement. Define what went wrong, where and when it occurred, and who was impacted. The more specific you are, the easier it is to investigate.
Step 2: Gather contextual data
Pull relevant info from all sources, including system logs, BI dashboards, CRM records, and user feedback. The goal is to see the bigger picture and spot patterns you might miss otherwise.
Step 3: Identify contributing factors
List all potential factors that could have contributed to the issue. This is the stage where you use structured methods, like fishbone diagrams or the 5 Whys, to explore your data from every angle.
Step 4: Validate and isolate the root cause
Now it’s time to dig into the data. Look for strong correlations between data points and find recurring patterns. Keep asking “why” until you reach a conclusion.
Step 5: Take corrective actions
Once the root cause is identified, address it directly. Whether it’s a process change, a technical fix, or team training, make sure you also focus on any upstream or downstream impacts to avoid repeating mistakes.
Step 6: Track outcomes and iterate
Monitor the impact of your fix over time. Once the issue is resolved, find out if it has triggered any unintended consequences. Leverage what you’ve learned to prevent further mishaps in the future.
1. Product teams: Solving shipping problems
For product teams, speed is a competitive edge—but it comes with risk.
Say you launch a new feature, and suddenly, engagement drops.
Now you're left asking: what changed? Why aren’t users interacting the way you expected?
With root cause analysis, you can dig into the user journey to see if the issue is tied to UX friction or something deeper like backend data inconsistencies. Instead of relying on guesswork, you get clarity to make focused fixes.
The result? Product adoption bounces back, users stay engaged, and you avoid spending the next sprint fixing the wrong thing.
2. Marketing teams: Saving budget
Marketing teams never stop. They’re constantly launching new campaigns, testing creatives, and fine-tuning performance. But even when clicks are up and traffic is flowing, conversions can stay flat.
Before you pour more budget into the campaign or scrap it entirely, take a step back.
Root cause analysis helps you drill into your campaign performance, device by device, click by click, to help you understand what’s really holding you back. Because even one small issue can derail the entire journey.
Armed with that insight, you can make quick fixes. And instead of burning your budget, you start building campaigns that actually convert.
3. Finance teams: Finding revenue triggers
Finance teams do more than close your books—they chart the course of the business. But when revenue trends shift and dashboards only scratch the surface, it’s tough to take decisive action.
Whether it’s churn driven by a pricing change or a revenue drop linked to inventory stockouts, root cause analysis helps you connect cause and effect.
This kind of proactive approach allows your team to step in early, protect revenue, and shift from reactive to strategic, backed by answers instead of assumptions.
Enter the era of Agentic Analytics
Most teams today don’t have just a data problem. They have a clarity problem.
Let’s be real: your data is scattered across tools, buried in dashboards, and locked behind manual reports. That makes it hard to get real answers, and even harder to act on them.
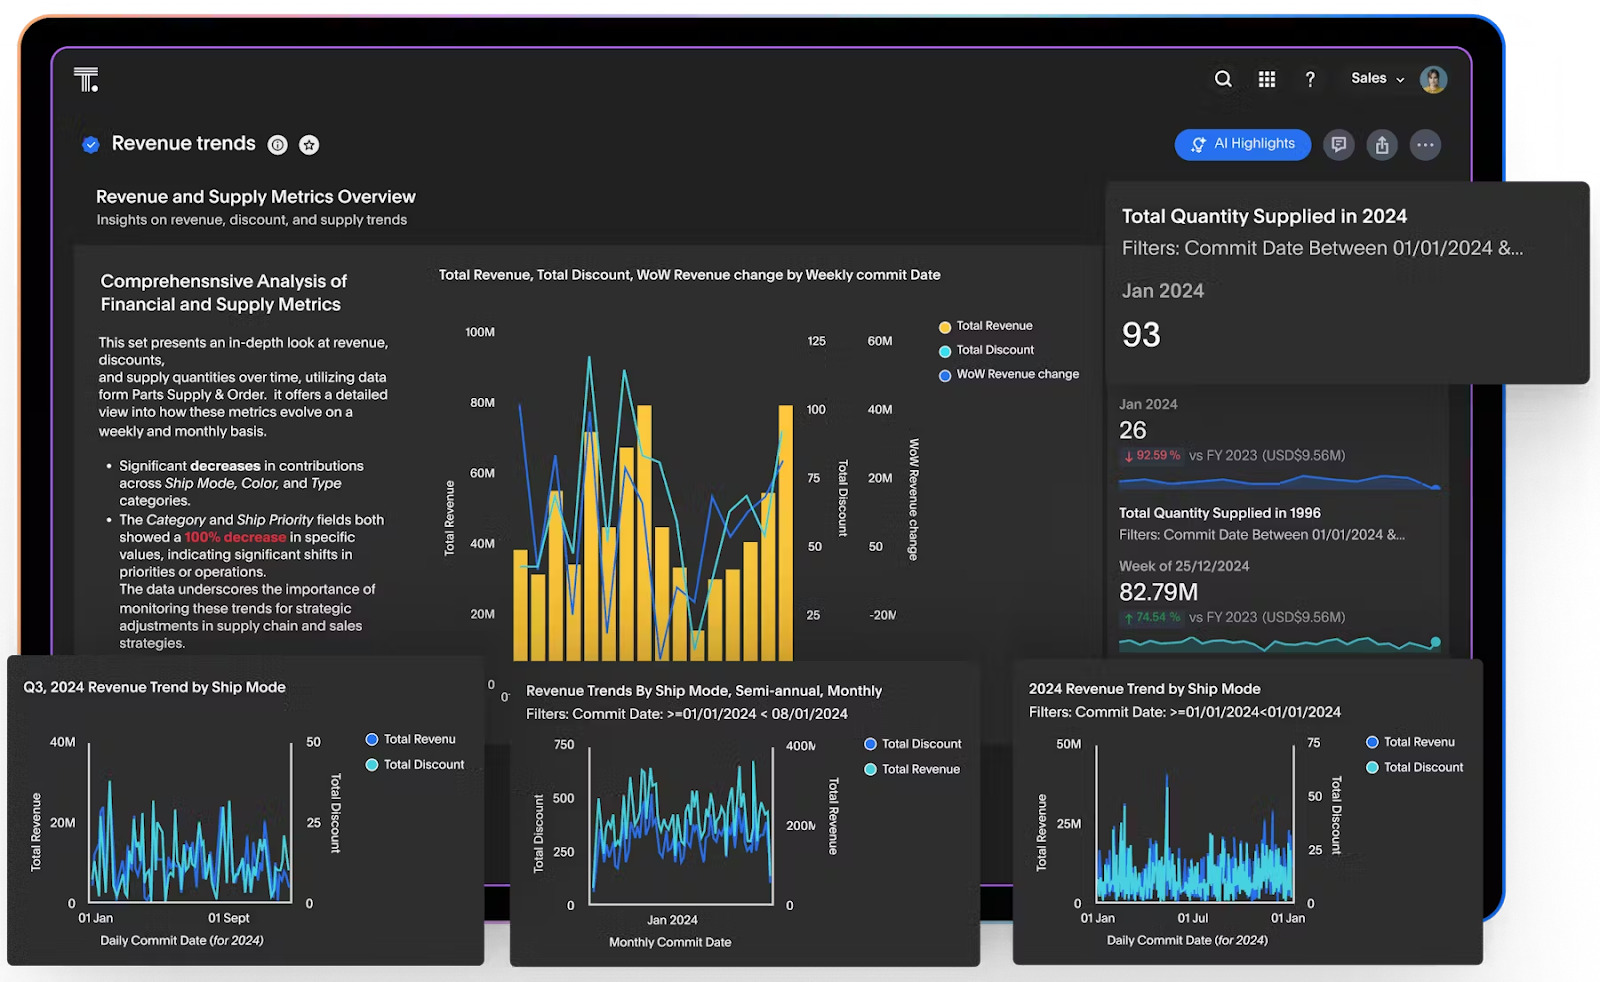
With ThoughtSpot’s Agentic Analytics Platform, you don’t just fix these problems, you rewire your entire analytics experience. With AI-powered capabilities like natural language search, change analysis, and conversational AI, your team can go from insight to action in seconds.
Ready to do more with your data? Start your free demo today.


