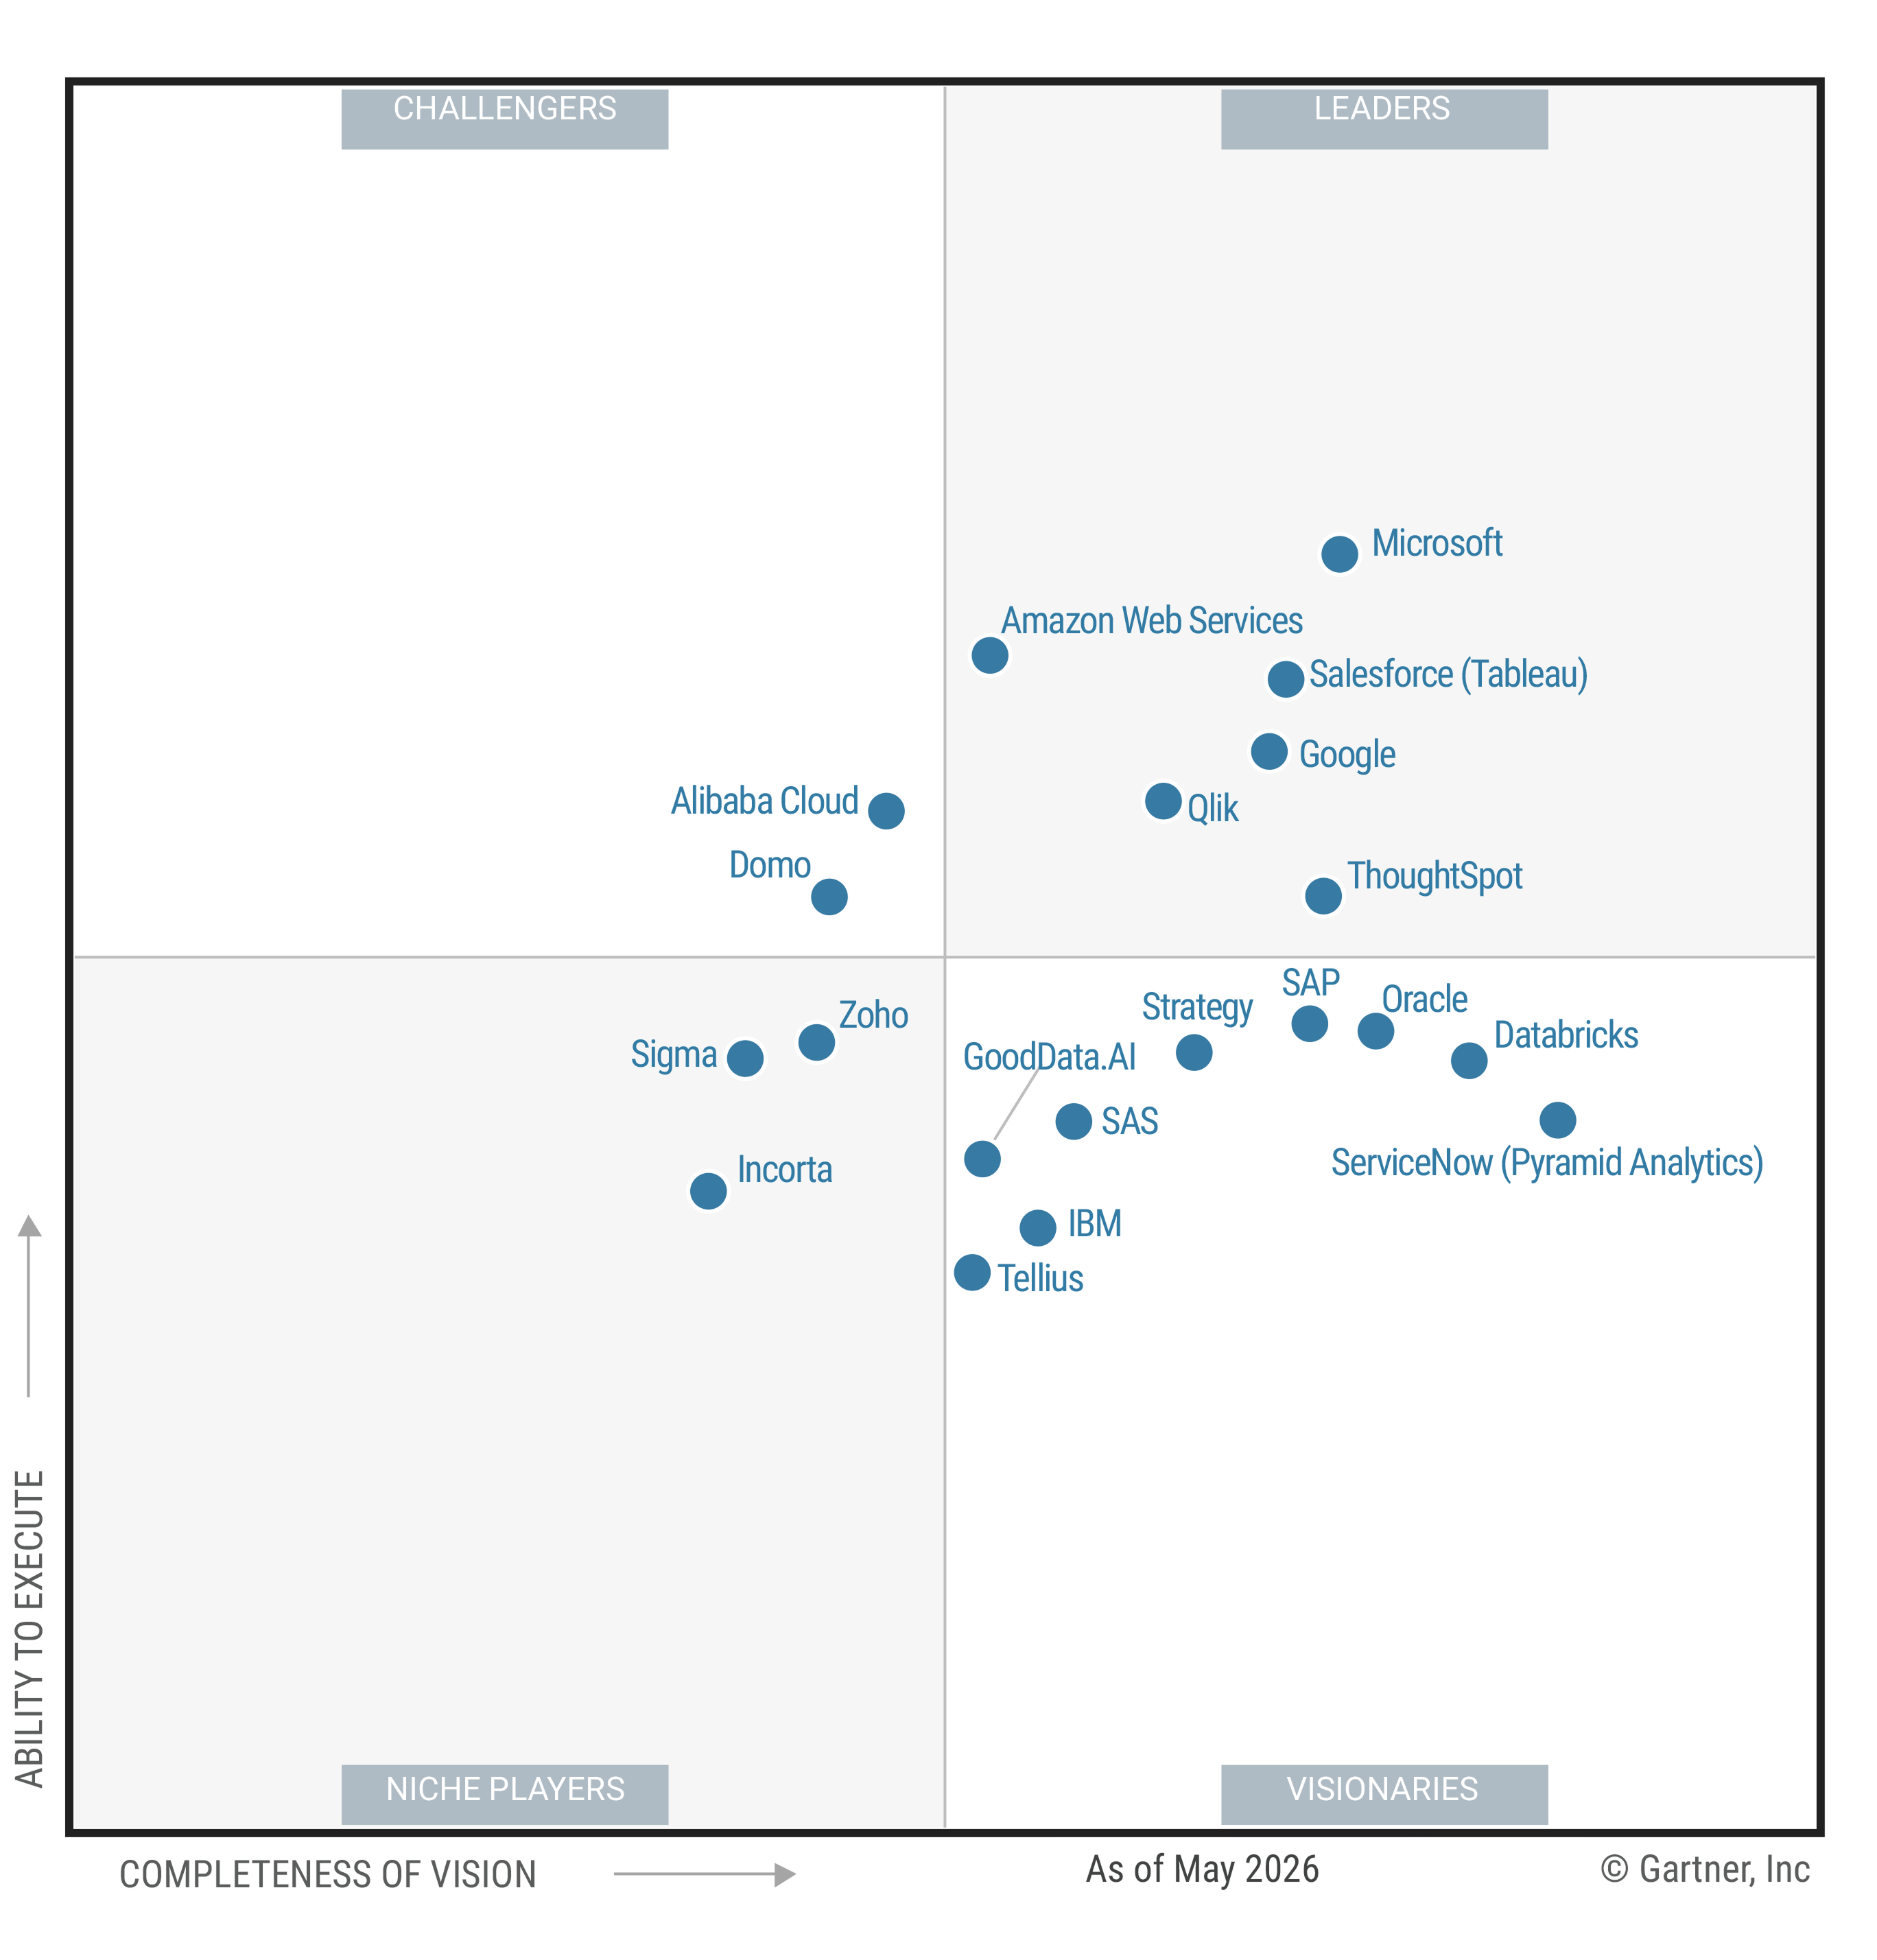
- Data visualization helps you interpret BI metrics, patterns, and changes. Review data visualization fundamentals and business intelligence foundations.
- A polished dashboard cannot fix disputed KPI definitions. Start with governed metrics, named owners, documented logic, and quality review.
- Match each visual to a business question. Then give people a path to filter, drill down, and ask what changed.
- AI can make follow-up analysis easier, but people still need transparent logic, governed data, and responsibility for the final decision.
When your dashboard shows three versions of the same KPI, the chart is rarely the real problem. Useful data visualization in business intelligence starts with trusted definitions, then presents the result in a form you can interpret and investigate.
How do the two concepts fit together? BI covers the wider analytical workflow, while visualization is the part you see through charts, maps, tables, and dashboards. The U.S. General Services Administration's Digital.gov visualization guidance describes visuals as supporting rapid interpretation and revealing patterns, trends, and relationships. Read that as guidance, not a promise of faster or better business outcomes.
What Data Visualization Adds to Business Intelligence
A single visualization answers one focused question, such as how monthly revenue changed; a dashboard brings several related measures into one view. ThoughtSpot offers one product-specific example, not a universal BI definition or outcome claim. ThoughtSpot describes a workflow that can connect cloud data and support analysis. Its semantic model documentation says raw data maps to approved business definitions, logic, and rules.
Why does that distinction matter? You might begin with source data, apply a governed definition, calculate a metric, and present the result. From there, you need enough context to interpret the change and decide whether to investigate further.
For example, a line chart might show that pipeline conversion fell in the West. The chart helps you spot the change, but it does not explain the driver. Your next questions may involve channel mix, segment, product, sales stage, or time period.
If you are planning the wider system, ThoughtSpot's guide to BI architecture options explains how different components fit together. A separate overview of modern BI tools can help you assess capabilities across the analytical workflow.
Good business data visualization should help you do at least one of four jobs:
Compare values across categories.
Spot a change over time.
Examine relationships or geographic patterns.
Communicate evidence behind a decision.
When a visual cannot support a clear task, adding more panels will not rescue it. Start with the decision your reader faces, and work backward to the metric and display.
Start with Trusted Metrics, Not Dashboard Layouts
Dashboard design often gets attention first because it is visible. Yet conflicting metric definitions create a deeper problem: two polished charts can tell different stories about the same business question.
Before you choose colors or arrange tiles, define the metric's calculation logic and business context. Who owns the definition? Which source supplies the data? When was it reviewed, and which decision is it meant to support?
A practical governance model can include four controls:
Document the metric. Record the formula, filters, time basis, exclusions, and intended use.
Name accountable people. Assign a product owner for the published experience and a steward for the underlying data.
Review quality before publication. Check freshness, completeness, calculation behavior, and access controls.
Test business fit. Confirm that the metric answers the stated question for the intended audience.
Indiana's Office of the Chief Data Officer offers one public-sector example. Its 2025 dashboard governance controls call for a defined, documented product owner for published visualizations. The standard also covers stewardship, quality review, and fitness for business use. It illustrates a practical model, not a private-sector mandate.
A governed semantic layer can give people a consistent starting point for exploration. For product context, review ThoughtSpot's governed data models. The practical goal is consistency: the same KPI should carry the same meaning across charts and follow-up questions.
Governance does not prove that every number is correct. Instead, it establishes ownership, review points, and a shared definition that people can inspect when a result looks surprising.
Choose the Chart That Matches the Business Question
Your chart choice should follow the question, not the dashboard template. If the reader wants a trend, show time clearly. If the reader needs an exact value, a table may work better than a decorative chart.
The Texas Department of Insurance visual selection guide recommends maps for geographic patterns, tables for exact values, bars for comparison, and lines for trends. Treat those patterns as a starting point because the data, audience, and decision still shape the right choice.
| Business question | Good starting point | Why it fits |
|---|---|---|
| How did a measure change over time? | Line chart | Shows direction, pace, and turning points. |
| How do categories compare? | Bar chart | Makes differences and rankings easy to scan. |
| What are the exact values? | Table | Preserves detail for lookup and verification. |
| Where is the pattern occurring? | Map | Connects the measure to meaningful geography. |
| Is this a simple part-to-whole message? | Pie or donut chart | Use only a few clearly distinct categories; do not use it for ranking. |
Reserve pie or donut charts for a simple part-to-whole message with a meaningful total. The Texas guide suggests two to five clearly distinct categories and advises against using the format for ranking.
Once you have the basic form, remove anything that competes with the question. Use honest scales, direct labels, restrained color, and clear titles. When practical, provide alt text, keyboard access, sufficient contrast, and a text or table alternative.
Accessibility practices can remove common barriers to reading a dashboard, but they do not guarantee adoption or legal compliance. Check your implementation with accessibility and legal specialists who understand your setting.
Make a Visualization an Investigation, Not a Dead End
A visual earns attention when it reveals a change. It earns repeated use when you can investigate that change without waiting for a new report.
Suppose a line chart shows that pipeline conversion dropped last month. A useful next step lets you filter by region, channel, customer segment, and sales stage. You can then compare periods, inspect outliers, and narrow the question before involving an analyst.
Controls should serve real follow-up questions. Filters, drill paths, and chart switches add value when they clarify a driver; they add clutter when nobody knows why they are there.
Chart selection and exploration also work together. Changing the view should move the analysis forward, not simply redraw the same metric.
ThoughtSpot’s documentation describes interactive Liveboards as interactive dashboards. It also documents a drill anywhere concept for answering follow-up questions.
A Customer Example of Self-Directed Exploration
Customer results can show what to measure without setting a universal expectation. In the Midas Pharma analytics case study, Midas Pharma reports 72% adoption among its initial user base within four months. The company also reports more than 10,000 visualizations each month and 99% of queries returning in under one second.
Those figures belong to one customer's rollout. They should not be treated as a benchmark for your program. Instead, use the example to identify useful measures: initial-user adoption, analysis volume, response time, repeat use, and the decisions supported.
Use AI to Extend Exploration, While Keeping People in Control
AI can help people ask a follow-up question after they spot a change. After you spot a change, you might request a regional breakdown, another chart, a plain-language summary, or suggested next questions.
The value comes from keeping the thread of analysis moving. You can ask, “Which segments drove the decline?” and then inspect the logic behind the response. If the answer looks odd, you need a way to check definitions, filters, and query steps.
ThoughtSpot product sources describe AI-assisted analytics. They also describe automated insights.
Keep three guardrails in place:
Ground AI in governed definitions. The model should use the same approved metrics as the rest of your BI experience.
Make reasoning inspectable. Make reasoning inspectable wherever your BI implementation makes that possible.
Keep decision responsibility human. AI can suggest a direction, while you judge the context and choose the action.
AI assistance does not remove the need for data literacy. In practice, it makes clear definitions and transparent logic even more important because more people can ask more questions.
Build a Repeatable Visualization Practice
A strong data visualization practice is a repeatable operating habit, not a one-time dashboard redesign. Use a simple five-step loop:
Define and govern the metric. Document the calculation, context, owner, steward, source, and review process.
Match the visual to the question. Choose a chart based on the comparison, trend, value, relationship, or location you need to show.
Clarify context and access. Add direct labels, time frames, definitions, accessible alternatives, and enough explanation to prevent guesswork.
Support follow-up exploration. Give people relevant filters, drill paths, and questions that help them investigate possible drivers.
Review usage and refine. Track which views people use, where they stop, and which decisions the experience actually supports.
Reviewing usage matters because more charts do not automatically create more value. Look for repeated questions, abandoned paths, conflicting interpretations, and slow handoffs. Those signals can guide your next metric review or design change.
If you want to put that operating model into practice, explore ThoughtSpot's interactive business visualizations for drill-anywhere analysis and follow-up exploration.