ThoughtSpot for Google Slides
Bring live business visuals into every presentation
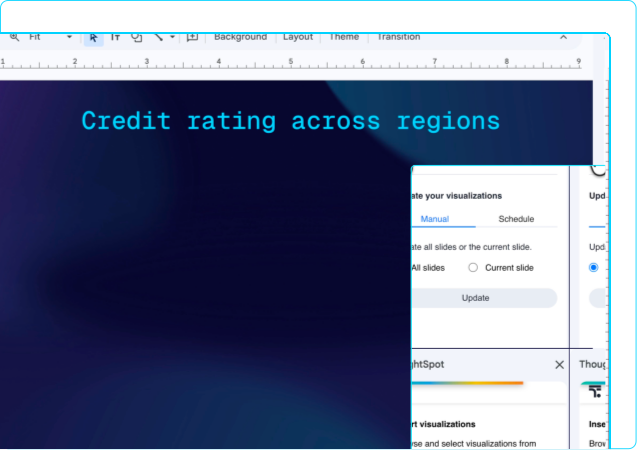
Insert charts and live data visualizations directly into Google Slides so teams can build presentations on top of trusted analytics. ThoughtSpot Connected Slides keeps every visualization linked to one governed source, so no matter who's presenting, the numbers are current and consistent.
Why Teams Love It

Build slides on trusted data
Insert live business visuals directly into the deck.

Cut the export-and-paste routine
Spend less time wrangling screenshots.

Keep presentations aligned on the same numbers
Use one governed analytics source across every story.
What You Can Do
Real workflows, powered by the ThoughtSpot + Google Slides integration.

Insert charts and live visualizations directly into Slides

Keep teams working from the same source of truth

Tell a stronger story with less grunt work
Bring Governed Analytics
to Every Conversation
Start making data-driven decisions
where work already happens.


Ask AI for a summary about
ThoughtSpot


Follow us


