


Data modeling is a hot topic among data professionals, but the term is often overused or too ambiguous. Data modeling is more than just building a single view for each dashboard—it’s building a model of a business process.
Depending on your role, you may use various data modeling languages, including SQL, dbt, LookML, and ThoughtSpot Modeling Language (TML). In this article, we’ll review three different use cases along the spectrum of data modeling, which tools to use, and when.
I’ll focus on building analytical models; you know, those models that analytics engineers are creating for consumption by business analysts or business users. I’ll share when you should use TML, dbt, SQL, and LookML.
Overview of data modeling languages
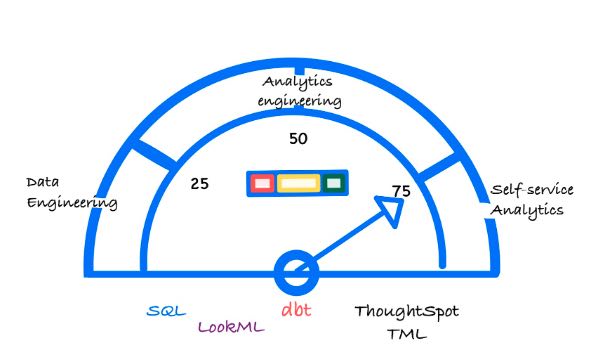
Let’s start by considering the spectrum of modeling languages and associated tasks—from most developer focused to most self-service analytics focused.
SQL
While understanding SQL analytics functions clearly provides the user with fine-grained data manipulation capabilities, it also requires the highest level of technical skill and training. SQL usually requires external tools or pipelines for control flow and data integration.
💡 Relevant read: 12 SQL query optimization techniques to follow
LookML
Google Cloud’s modeling language, LookML, is written as code. As such, it is designed to be used by technical users and developers with a strong understanding of SQL and database design principles. With LookML, developers create what Looker calls an ‘explore.’ An ‘explore’ is a projection of data from existing views and joins—analogous to a dbt model or ThoughtSpot worksheet.
dbt
This language also requires written code, but that is where the similarity with LookML ends. dbt data modeling focuses on a transformation-first approach, providing a templating language called Jinja—straightforward SQL statements, data testing, and DAGs for building pipelines and models. dbt is also developing an open semantic layer which is actively being integrated into multiple tools in the modern data stack including analytics, catalogs, and observability tools.
TML
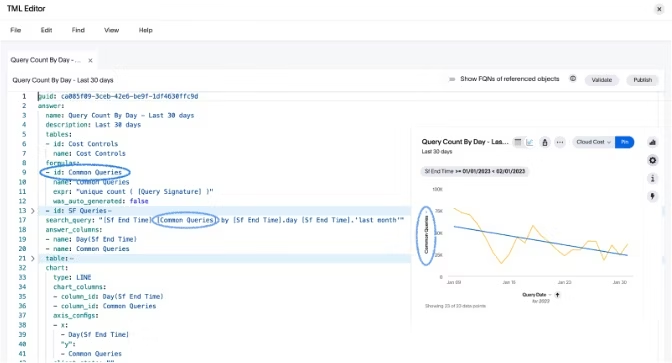
ThoughtSpot Modeling Language is a YAML base representation of all assets with ThoughtSpot including worksheets, views, SQL views, tables, answers, and Liveboards. TML approaches data modeling from a low-code and visual perspective. Designed to make data modeling and data visualization much more accessible for non-technical users, TML is created and edited with a low-code, AI-assisted web interface—reducing the technical demand on users and enabling self-service analytics.
Common data roles and how they interact with data
It's also worth taking a moment to review the data roles and each of their perspectives on data modeling1. While this list is not exhaustive, it does give a good cross-section of data modelers.
Data modelers and architects are often associated with data warehousing and data mart modeling to capture and store all the data while modeling the data relationships for downstream consumption. They typically utilize a data warehouse methodology, such as those created by Bill Inmon, Corporate Information Factory; Ralph Kimball, Dimensional Model; and Dan Linstedt, Data Vault.
Data engineers typically see modeling from a data warehousing perspective. They ingest, clean, store, and transform data to meet warehouse requirements. This role may even create data marts for data consumption by the aforementioned data analysts, business analysts, and analytics engineers. Joe Reis and Matt Housley have a great chapter describing the data engineering life cycle in their book "Fundamentals of Data Engineering."
Analytics engineers often say that they are using dbt, jinja, and SQL to build a ‘dbt model.’2 From a practical point of view, they are modeling data and implementing data sets that support efficient data processing and analysis. I would call this analytics modeling or consumption models. Due to the hybrid nature of the analytics engineer role, sometimes they ingest raw data, transform data, model the data, and present analytic models to business analysts or users. Madison Schott describes the role of an analytics engineer quite well in her article, Data Engineer vs Analytics Engineer: How to choose the career that’s right for you.
Data analyst and business analyst are separate roles, however their perspectives are similar. They often create visualizations and dashboards that summarize data, making it easier for decision-makers to understand trends and patterns, identify key performance indicators, and provide insights into how the business is performing. These roles often use data that is already ingested, cleansed, transformed, warehoused, or modeled.
Application architects and developers view the data model from the perspective of the required data structures and access patterns needed to meet their application requirements. They may rely on transactional RDBMS, NoSQL databases, or document databases with structures defined as XML or JSON documents. For these roles, their applications will often collect and generate data that gets warehoused and analyzed.
Start Getting Better Insights
3 data use cases with corresponding modeling languages
Data models for self-service analytics
Use TML when creating data models designed for self-service analytics and search. To truly realize the benefits of self-service analytics, data needs to be appropriately modeled in a way that ensures business users’ ability to ask ad-hoc questions and drill anywhere without adding to their cognitive load or placing a tax on their data curiosity.
In data modeling, like most software development efforts, common problems arise, and there are reusable solutions. We have identified the most common patterns of complex analytics and generalized them into easy-to-query constructs. Some of these common patterns that would otherwise require a data team to implement are
Star Schemas with FK/PK relationships
Dynamic cohort definitions
Aggregations across multiple facts (chasm traps and fan traps)
Mixed grain facts
TML improves your self-service analytics capabilities by enabling multiple data roles, including non-technical users. These costumes can create and modify the analytics experience layer, including Answers, Spot IQ results, and Liveboards using a low-code intuitive IDE. Additionally, TML's data modeling features, when combined with worksheets, also allow for the abstraction of complex problems, meaning fewer models need to be sent to a data engineering team for development.
Reusable and scriptable templates in embedded analytics
Every data team wants to reduce cost and improve operational efficiency. Forward-thinking data teams that aspire to be fact-driven and data-driven embrace DataOps and CI/CD. They focus on:
Creating a collaborative environment for data engineers, analytics engineers, and business users
Developing automated processes for continuously integrating data and new data sources
Emphasizing the development of embedded or tightly integrated systems that maximize customer value
Utilizing the entire modern data stack, including governance, security, data operations, testing, and analytics
Using TML for embedding analytics into your product is one of the best ways to increase stickiness, drive adoption, and deliver more value to your customers. But that also means that analytics must be treated like a software asset and deployed in an automated fashion using DataOps, CI/CD, and scripts.
A typical embedded analytics use case is having business users develop Liveboards and answers, integrating those dashboards into a git repository, and then deploying them to downstream environments like dev, test, and production. Here are a few tools to help:
Our python library for working with the Thoughtspot API and TML programmatically on GitHub
CodeSpot helps jumpstart your embedded analytics journey
Access CS Tools, a command-line utility written by the ThoughtSpot Professional Services team for customer success teams
Another common use case is building reusable and scriptable templates and assets for customers. Data and analytics providers often create separate isolated environments or clean rooms for their own customers. They build reusable analytics templates that leverage their own data and intellectual property to provide a competitive advantage. Some standardized analytics solutions include customer 360, behavioral, supply chain, and people analytics.
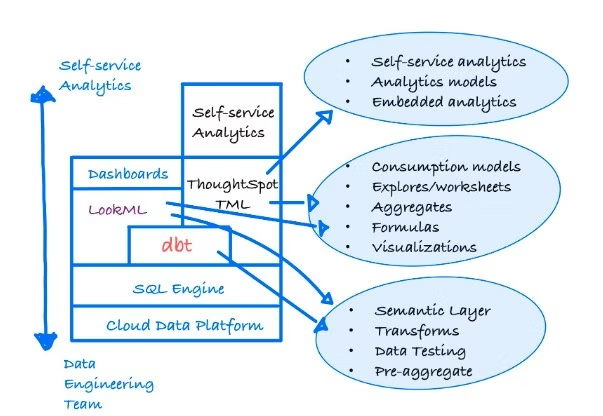
Semantic Layers & Data transformations
A semantic layer is a model that abstracts and simplifies data, hierarchies, metrics, formulas, and transformations, all with the primary objective of freeing business users from the technical complexities of the underlying data while continuing to model the business process. A well-constructed semantic layer uses business terms, hierarchies, and logic to make it easier for business users to understand and interact with the underlying data.
Some of the key benefits are:
Shared understanding of business metrics
Reusable and shared business logic
Unified governance and security model
Agnostic of the analytics tools
This layer uniformly maintains business logic, hierarchies, calculations, and other essential aspects—making it easier for business users to interact with the data source.
So which should you use? Semantic layer tools are still maturing, so the answer is “it depends.” The selection process requires you to be more forward-looking. I recommend starting with a few other questions.
Does the tool support an ecosystem of tools in the modern data stack, or is it vendor specific?
Is there an open and documented API? Are other vendors integrating with it?
Do you need support for multiple language support like SQL, Python, etc.?
Which data platform are you utilizing? On-premise or in the cloud?
How will the solution or tool scale? Will it grow with our business and usage?
Will it support self-service analytics?
LookML provides a mature and rich modeling language geared heavily toward data engineers and developers and a long history of a platform-first approach. dbt has captured the hearts and minds of many analytics engineers with its open-source approach to SQL, jinja, and its upcoming support for Python. Additionally, dbt has recently announced a metrics layer and semantic layer.
Both are investing in their respective semantic layers. While Looker has integrated vertically with the Google suite of tools, the market is expecting additional integrations. dbt has already announced integrations with multiple partners like ThoughtSpot, Atlan, Alation, and Fivetran. Support for multiple vendors and multiple categories across the modern data stack will be crucial for all semantic layer vendors, so keep a close eye on their integration capabilities.
In a recent Tech Target article, Tristan Handy, CEO of dbt Labs, said the “Semantic Layer is still a work in progress. We consider it one of the most important things we'll work on over the next five years. As semantic layers are in their infancy, they may not be on every organization's roadmap right now, but they should be. Demands for data and insights are only increasing, teams must continue to scale efficiently, and distributed data products are on the horizon. So, having a semantic layer will provide organizations with several significant benefits, including:
Smaller backlogs and a reduced number of ad-hoc query requests.
Composable data analytics and applications
Consistency of business-critical metrics across the Data Mesh and the organization.
Better self-service analytics and user experiences for business users.
Flexible and adaptable metrics definitions, making it possible to change metric definitions centrally and be propagated downstream to analytic tools, catalogs, data apps, knowledge bases, notebooks, etc.
Enabling organizations to use the best of breed tools in the modern data stack.
So choosing a semantic layer will depend on your organization’s level of maturity and roadmap, vendors' capabilities, and the stakeholders' need for self-service analytics.
Find the right modeling language for your use case
Self-service analytics, embedded analytics, and semantics are arguably three of the most important topics in data and analytics leaders look to as organizations lower costs and improve operational efficiency. While data modeling is not a one-size-fits-all approach, especially given all the different roles that need to perform data modeling, I shared common use cases for self-service analytics, embedded analytics, and semantic layers and when to use TML, dbt, and LookML to gain a competitive advantage.
To get started with TML, start a ThoughtSpot free trial—build your self-service analytics models, customize your own TML, and see how easy self-service analytics can be. For more information, check out the complete TML documentation.
1I have named but a few of the possible roles, and while the descriptions may not match your experience, nonetheless, they are quite common in the industry. Your mileage may vary.
2As you may have guessed, I’m not a fan of how dbt uses the word ‘model’ to basically mean a projection of data into a tabular format, such as a table or view. While the term is helpful to analytics engineers, it’s added to the confusion of data modeling.


