

It’s that time of the year again! I’m still buzzing about this year’s Showfloor Showdown at Gartner Data & Analytics Summit in London, where I had the opportunity to showcase ThoughtSpot's AI-Powered Analytics.
In the spirit of facilitating a side-by-side comparison, we were all invited to look at global flooding and weather station data, analyze the variables affecting these natural disasters, and present key findings to the crowd.
Answer your own data questions instantly
Unlike other vendors who started their analysis by manually building charts and dashboards, I started with something that any non-technical person in that room could do. I asked ThoughtSpot Sage a data question in full natural language—and I instantly received the answer.
“Which countries have the highest population exposed to flooding in 2020?”
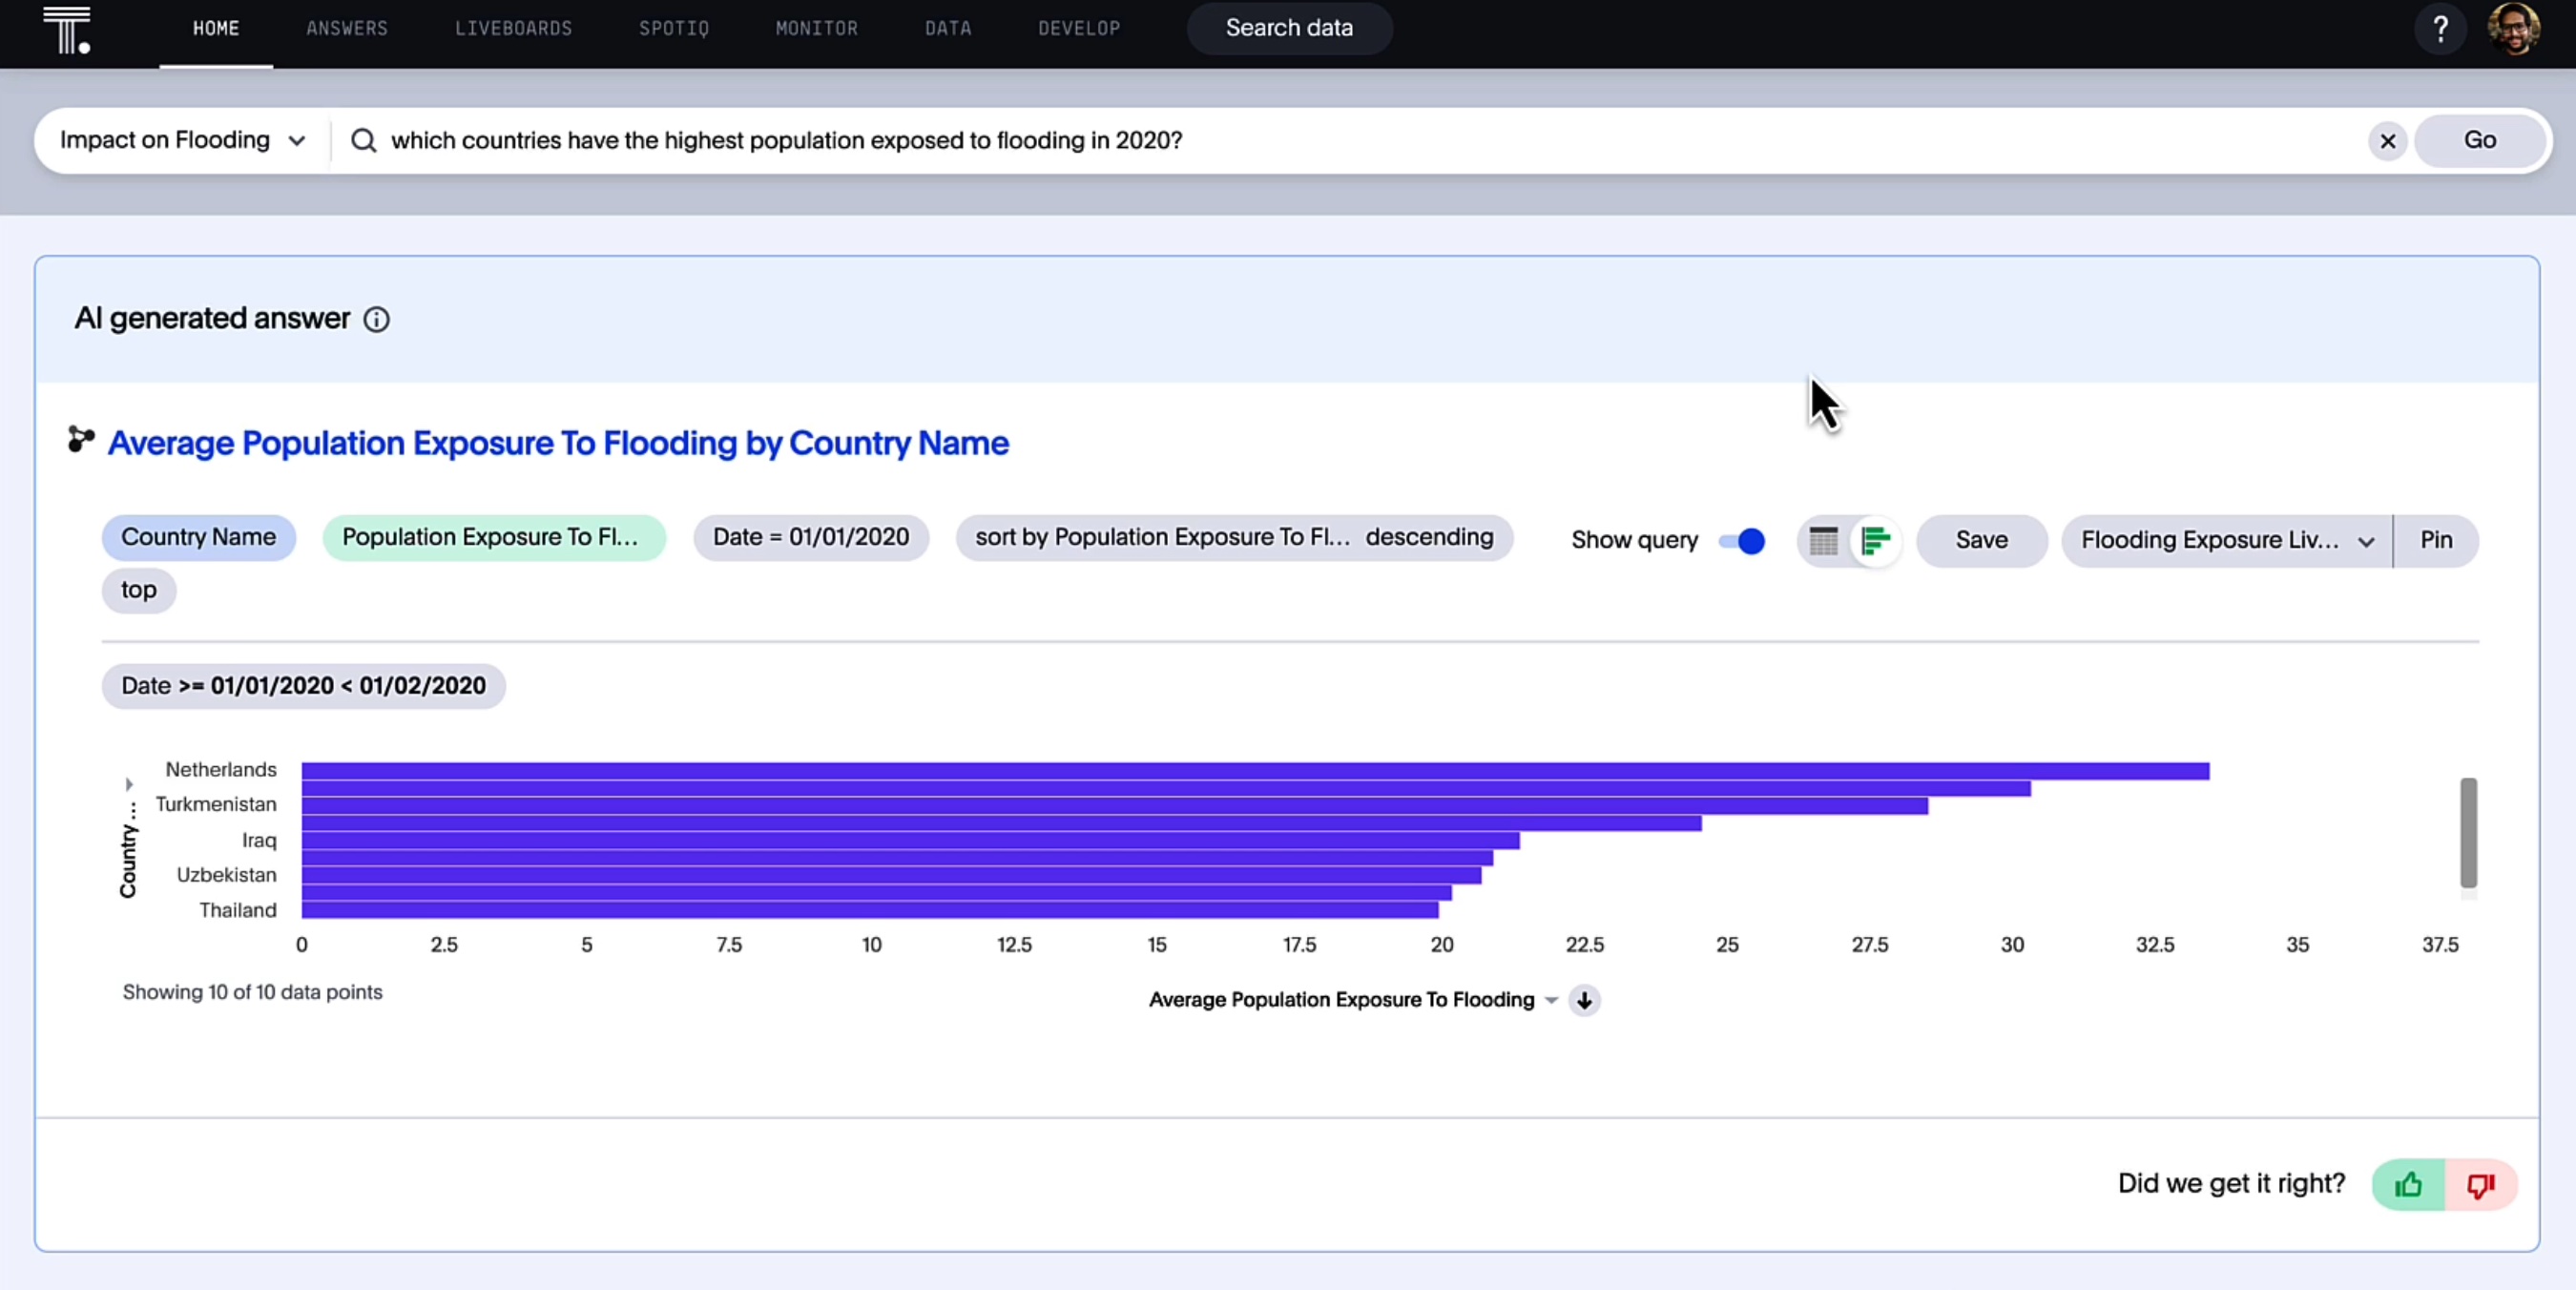
Combining the capabilities of powerful large language models, our dynamic search architecture immediately translated the question into relational search at the backend, provided keyword search tokens for transparency, and automatically generated an interactive data visualization answering the question.
All in a matter of seconds.
Create and share compelling data stories
I then took the answer into ThoughtSpot’s Query Editor for further exploration and analysis.
I thought it’d be interesting to dive deeper into global rainfall statistics, so I asked a new question: What was the total rainfall in India over the last 5 years vs. the year 2022.
Using search, I asked the next question, and the next, and the next. ThoughtSpot kept up with my curiosity every step of the way, allowing me to freely explore the data in any direction with our Drill Anywhere capability. With no pre-defined drill paths, I was able to drill right down to live granular data (totalling over 1 billion rows).
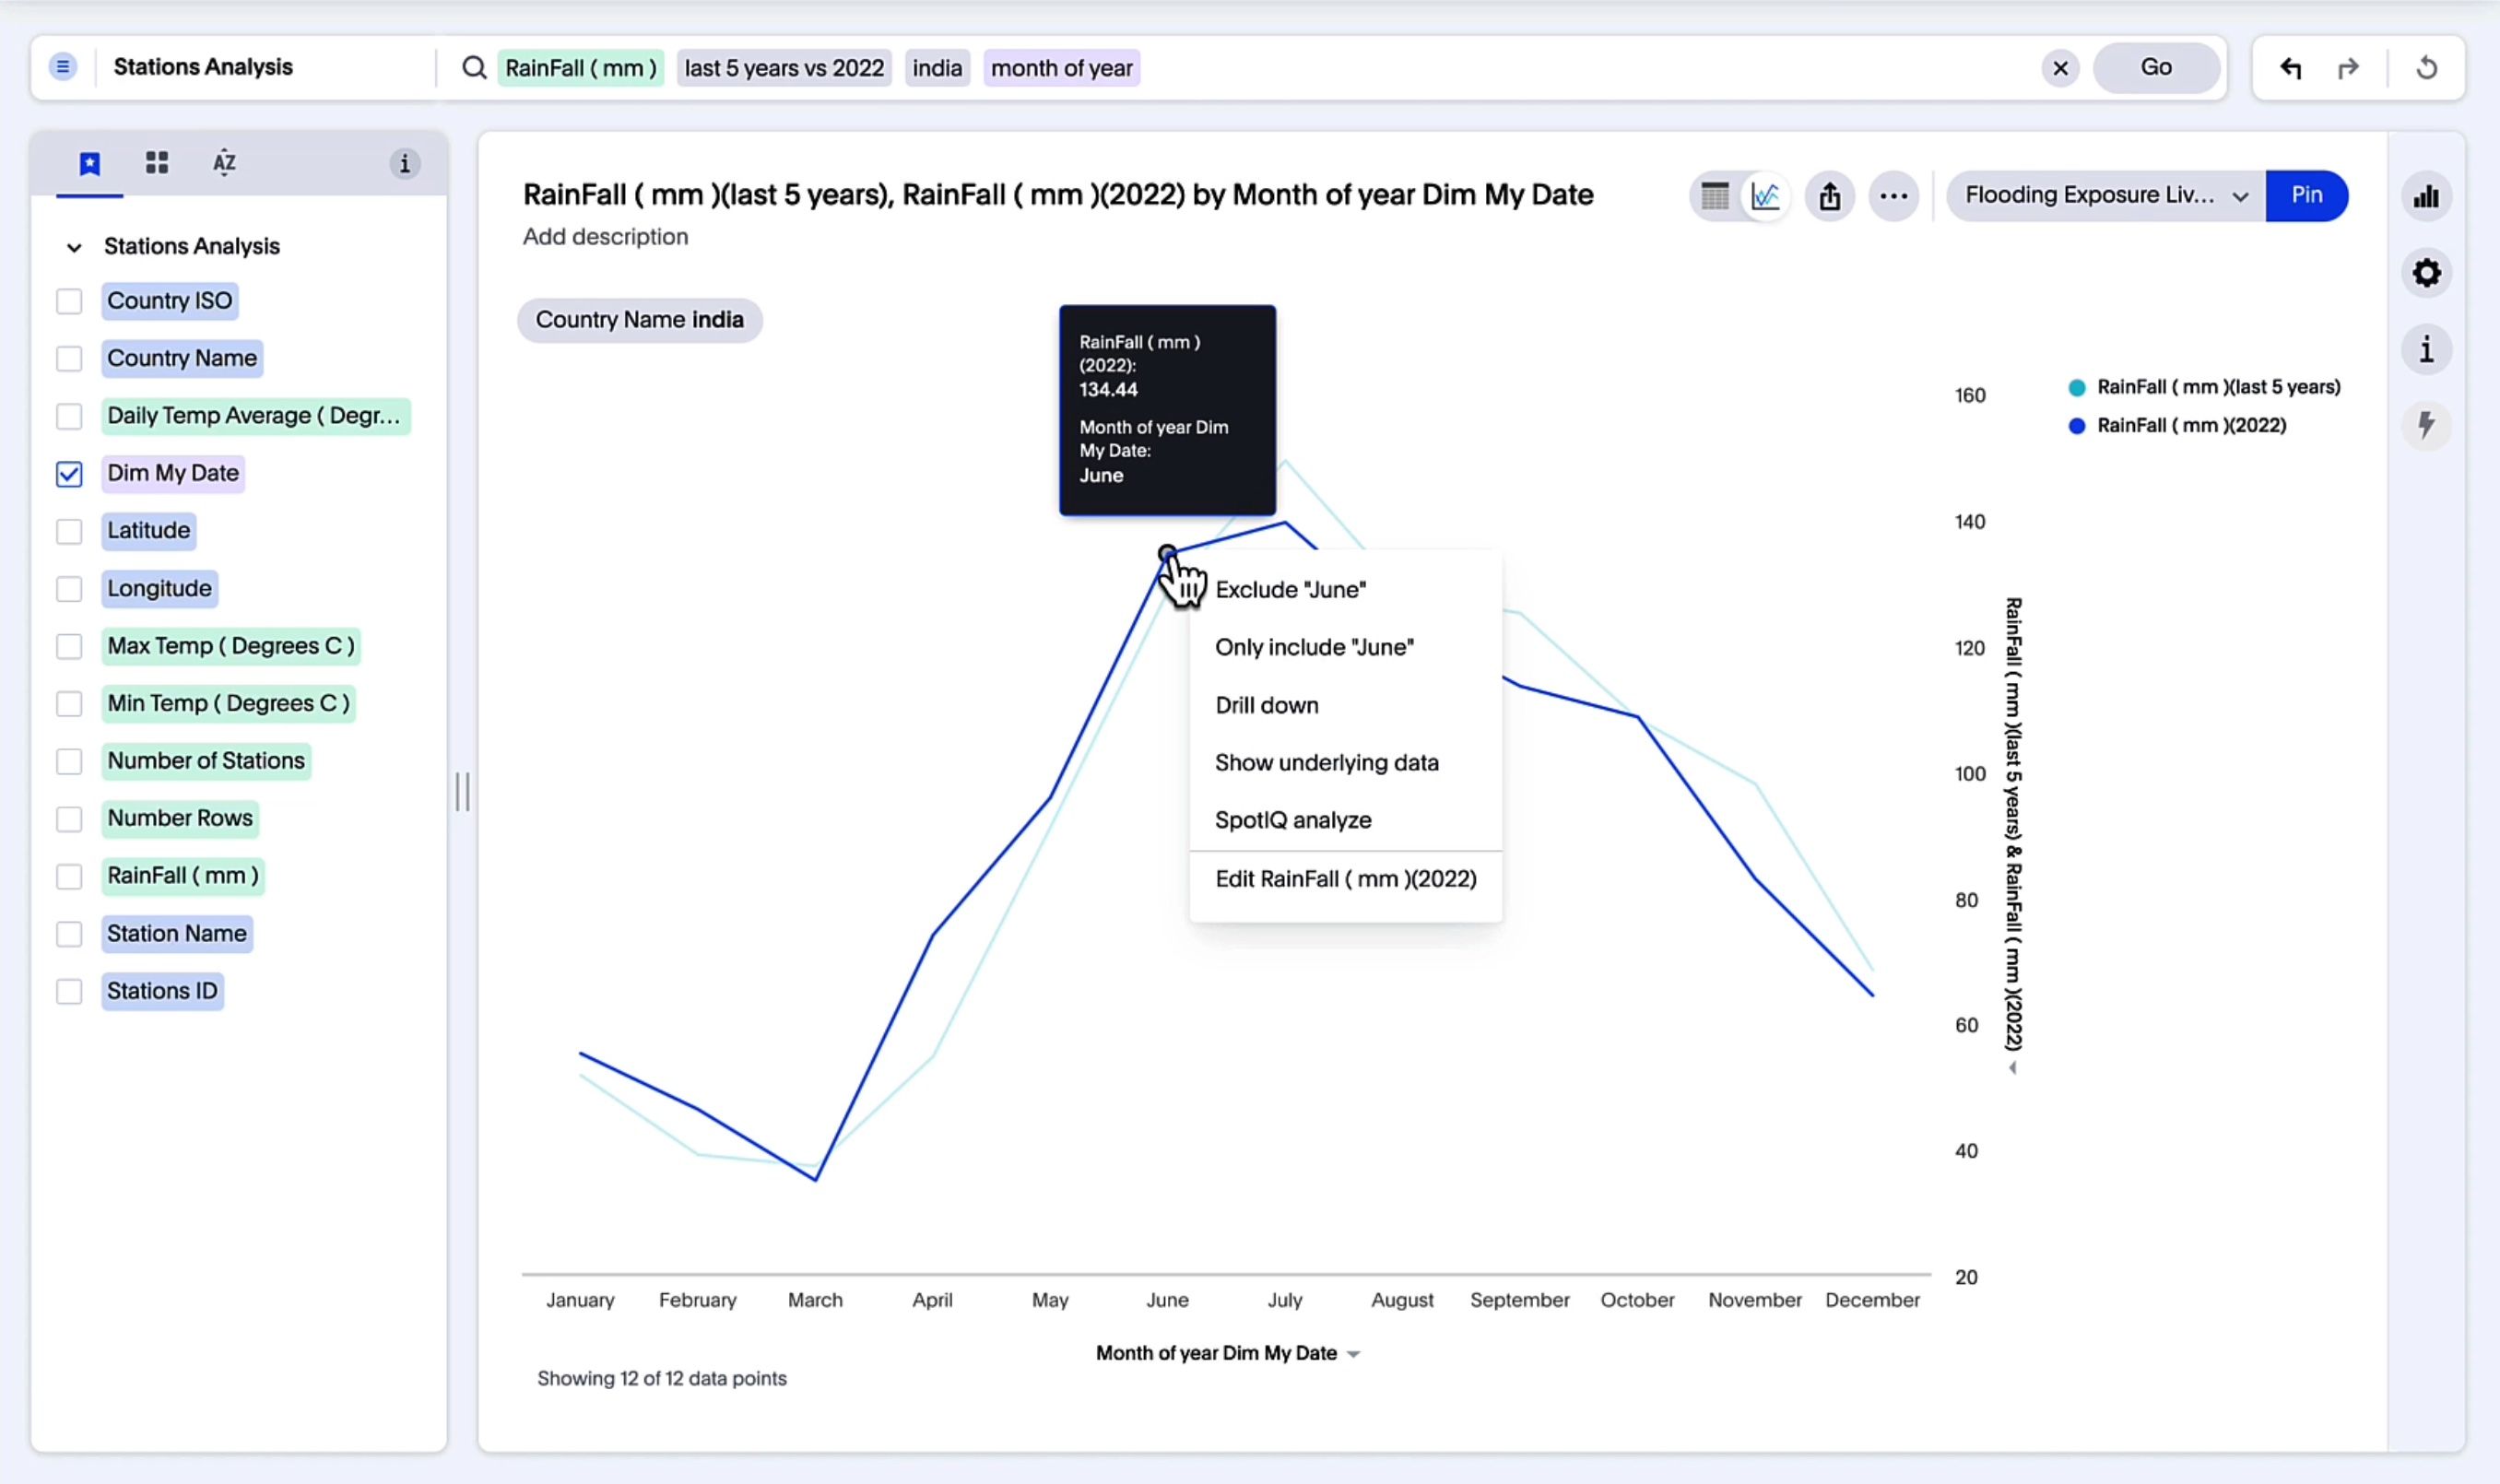
While South Asian countries are no strangers to heavy rains and flooding, I used this free-form exploration and Spot IQ’s AI-generated insights to discover that earlier seasonal rains and more rainfall in shorter periods are becoming more prevalent across the country—particularly in the Northeast. For example, the Meghalaya region saw three times its average rainfall in just the first three weeks of June 2022.
Drive everyone’s productivity through the roof with AI
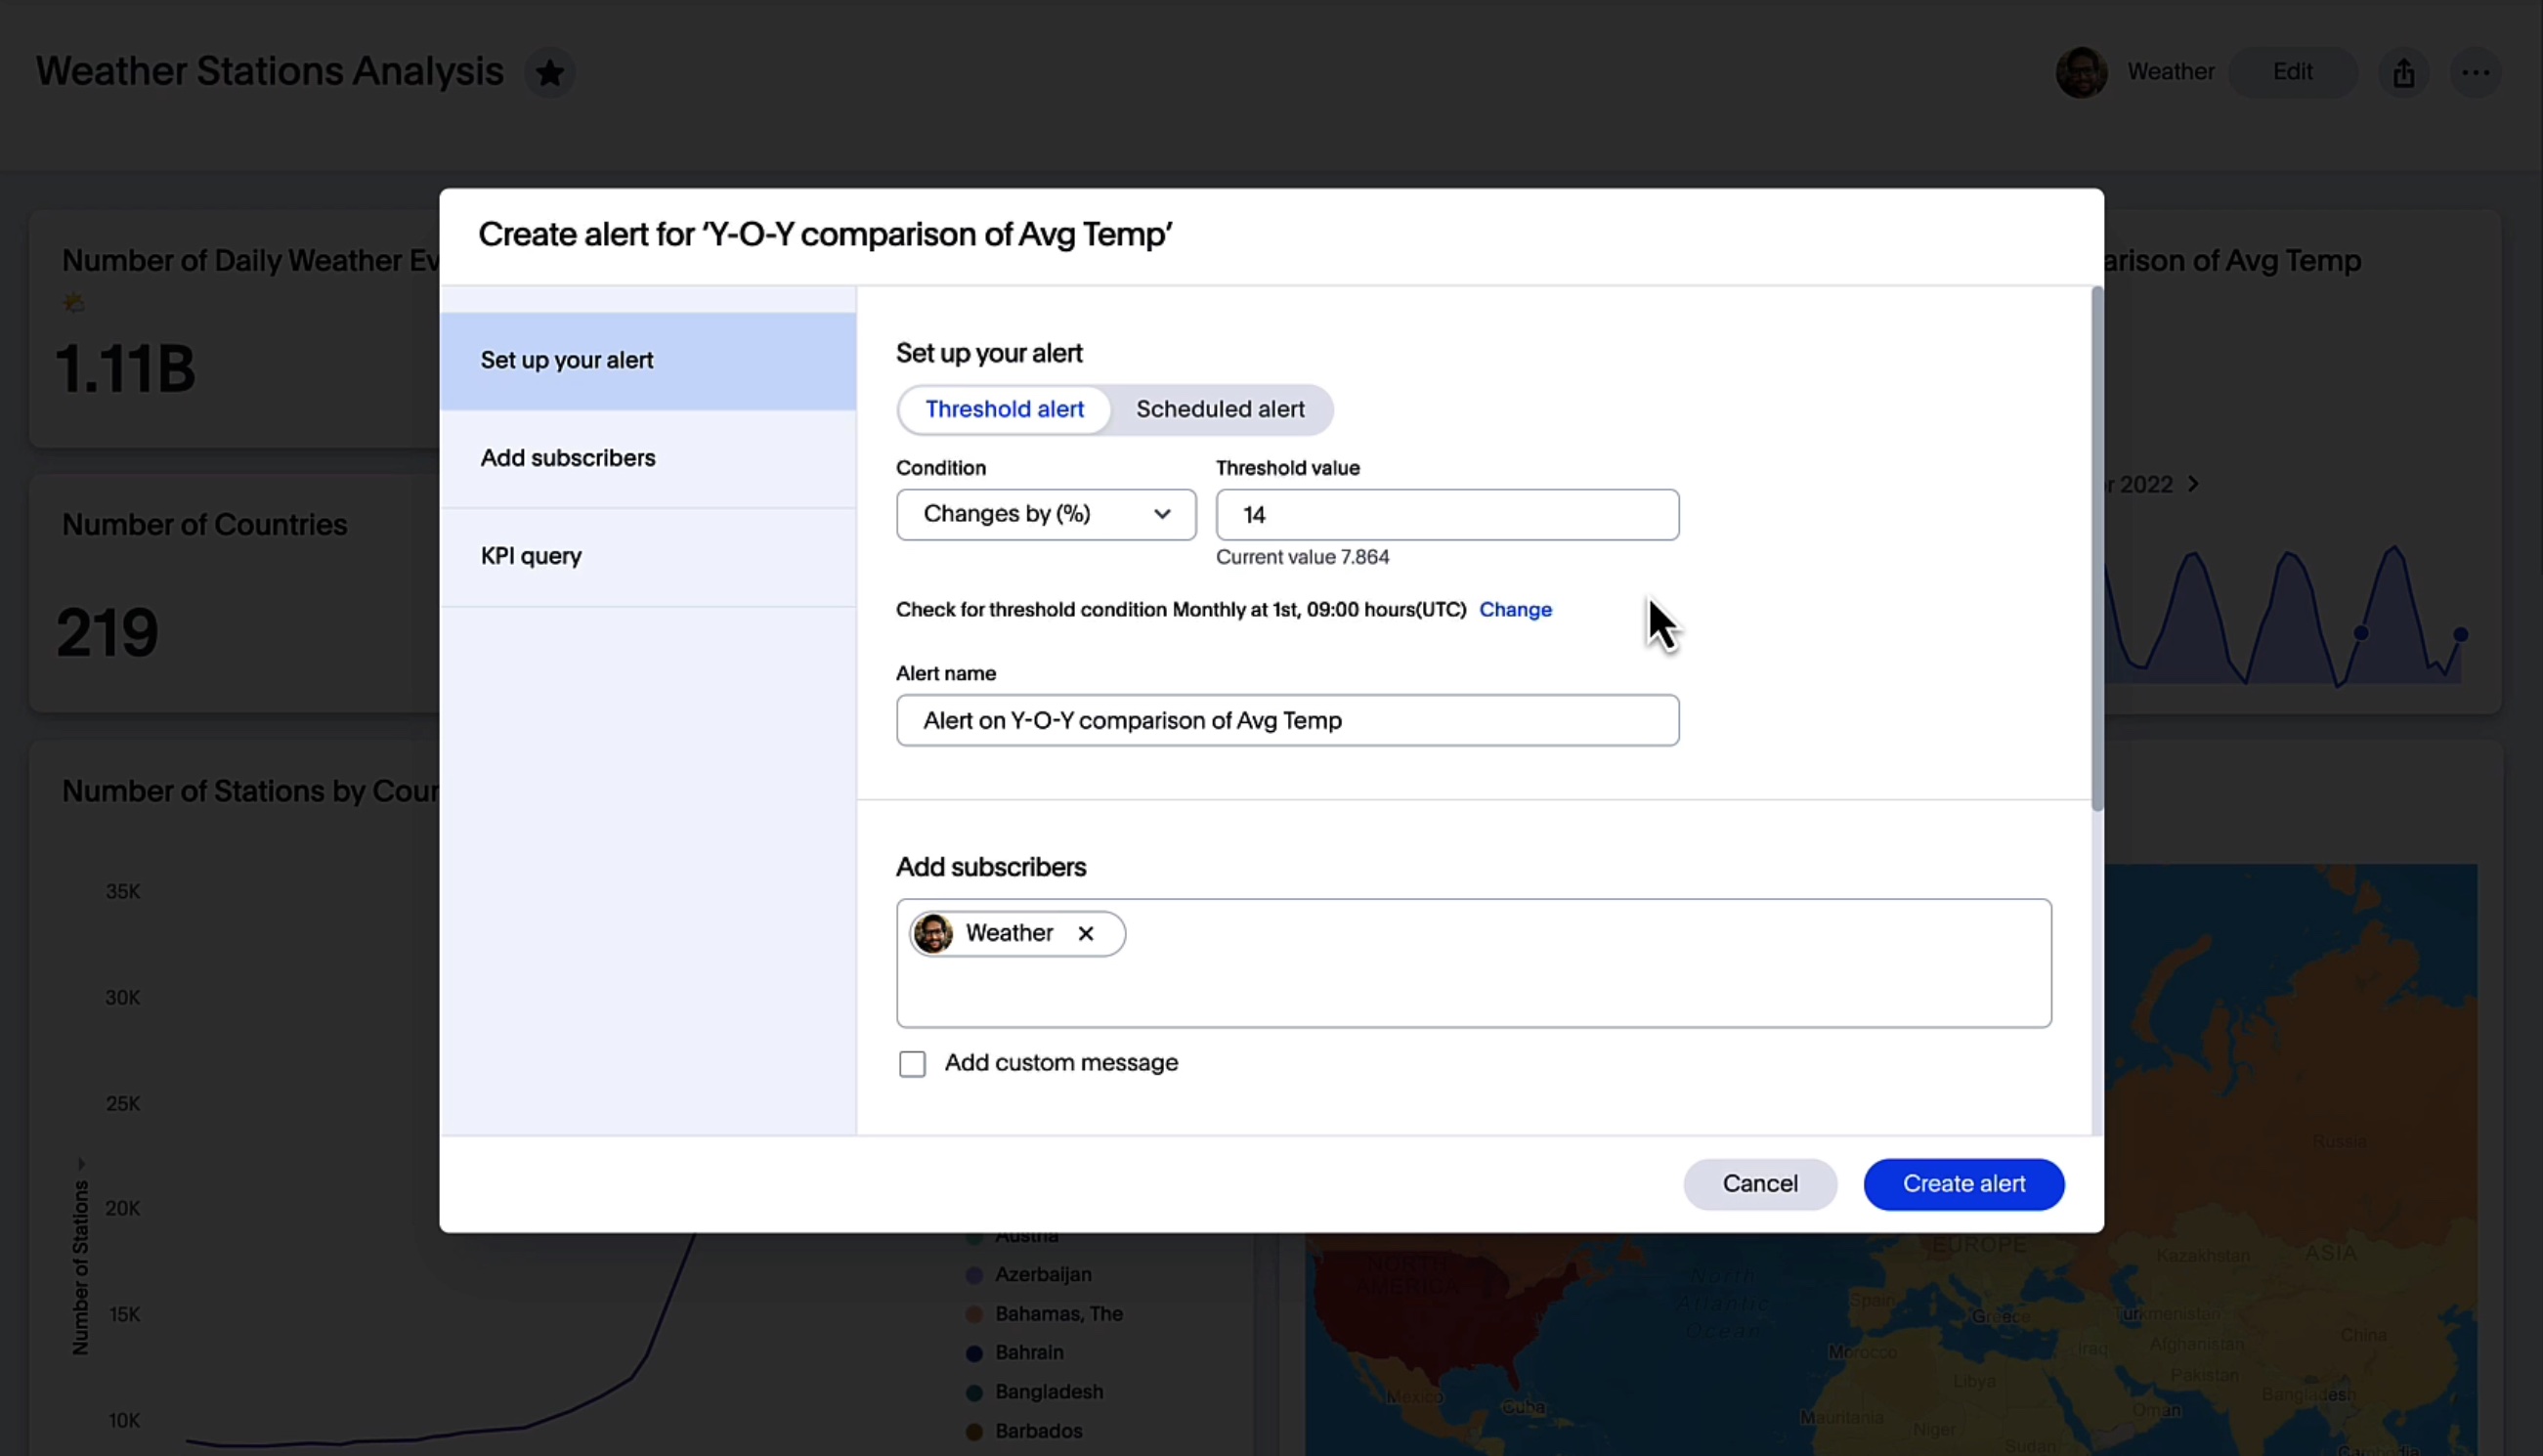
With three minutes left in the session, it was time to serve the finale.
Perhaps yearly flooding and temperature data might not have been the perfect use case for Monitor, ThoughtSpot’s automated business monitoring and alert system. Nonetheless, it was great to see the audience realize how easy it is to stay on top of their key metrics and learn why changes happen in real time. ThoughtSpot’s Monitor for Mobile also allows you to set up push alerts for need-to-know metrics across your devices and most-used business applications.
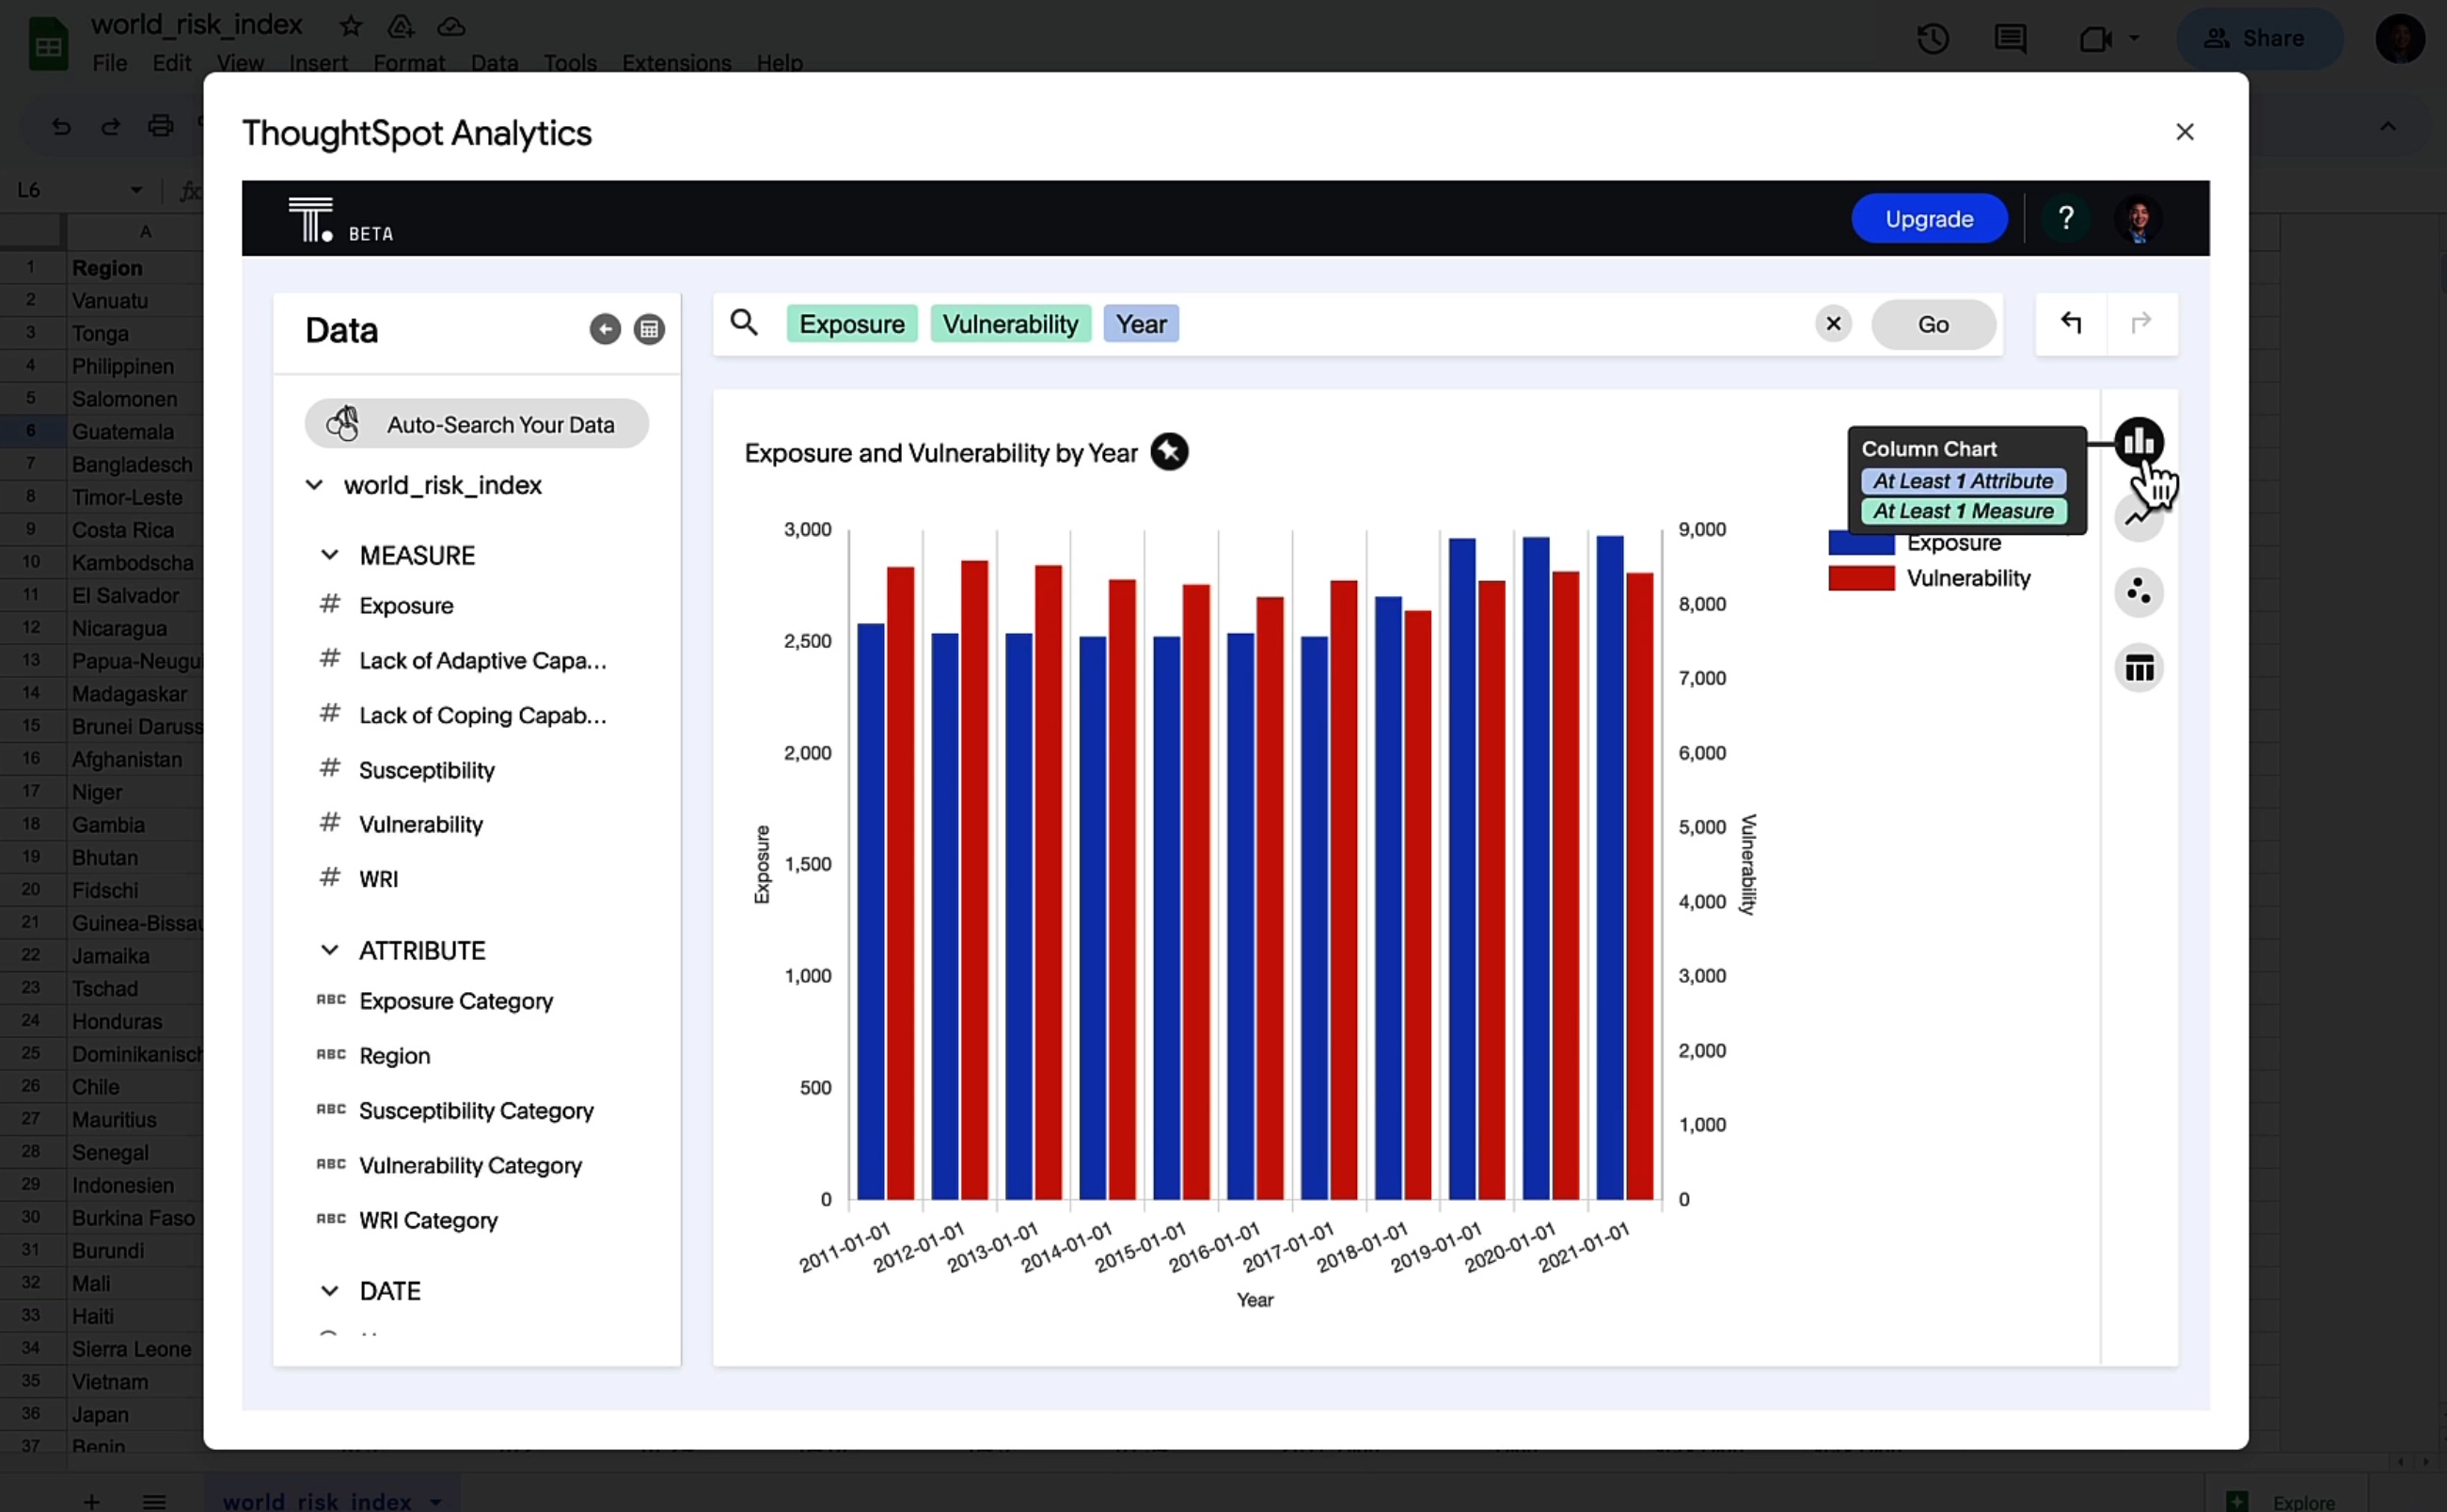
Of course, we didn’t forget about the teams who spend their days swimming in the data depths of spreadsheets. Our new integrations are designed to push your governed data into digital productivity tools like Google Sheets and Microsoft Excel.
And, you can employ free plugins to run lightweight ThoughtSpot searches with AI-Powered Insights—all without ever leaving your favorite spreadsheet application. This is what we’re calling invisible BI, and it’s just one way the ThoughtSpot team is working to democratize data for everyone.
Try it out for yourself:
And of course, I can’t forget about our AI assistant from the product roadmap who also made an appearance. But I’ll let you see for yourself at the end of the video above.
The future is bright with AI-Powered Analytics
It’s always a challenge to show all the major product advancements of a year in under ten minutes—especially in a watershed year like this one has been. But I was glad to present what a modern data experience looks and feels like, and how it can truly deliver value for everyone in the business.
I’d like to thank our customers and partners who joined us at this year’s Showfloor Showdown, and extend a special thanks to everyone who came to say hello at the booth. Meeting you, hearing about your journey in business analytics, and seeing leaders from Generali Investments, NatWest, and TP ICAP share their success in building a data-fluent culture with ThoughtSpot were the highlights of my Gartner London Summit experience.
I can’t wait to see you all again next year. And if you haven’t checked out ThoughtSpot, request your 1:1 demo today!


