


Traditional BI has always been wrought with login friction. It’s very much a “pull” motion. In order to get the answers you need, you have to stop what you are doing “over there” and access the data you need “over here.”
To disrupt this old way of thinking we launched ThoughtSpot for Sheets back in October 2022, which is considerably proven as one of the most productive Google Sheets add-ons for generative AI and data analytics. And of course, the first thing a lot of customers asked was – "this is great, do you have something for Excel?"
🤦
So what's up with Excel?
For years folks have been proclaiming and predicting the death of Excel as other data platforms and tools have become increasingly accessible to users of every technical skill level. However, with over 750 million users and counting, Excel is still an integral part of the data workflow.
Given the growing concerns about the costs of data consumption, it’s hard to blame anyone for wanting to look at their data without a tax on every single question.
However, not everyone is an Excel expert. So we started thinking:
How can we make it possible for anyone to visualize their data regardless of skill level?
How can we make this available to as many people as possible – not everyone has ELT or access to a data warehouse
How can we make cost a non-factor?
Introducing ThoughtSpot for Excel: AI-Powered Analytics for your spreadsheet data
Let’s get started with ThoughtSpot for Excel.
Any Excel user—desktop or web—can install the app by going to the Microsoft AppSource marketplace and searching for ThoughtSpot. Once there, simply select the app and follow the install wizard instructions. Your IT team can also easily deploy the app to all Excel users over the air through Office365.
No technical setup or data modeling required
One of the most convenient aspects of ThoughtSpot for Excel is there is absolutely no data modeling required to use it. The app automatically organizes all Excel data into its respective data types for easy access. It’s "one-click" BI made real. The Excel app framework follows that same philosophy, allowing us to provide even more user freedom. So even with data volumes over 160k rows, the application only takes a few seconds to launch—and you're off. 🚀
DuckDB and other data communities often talk about the rise of "small data" and the idea of bringing all your data workloads to the browser. This is the core principle behind our App plugins. Because all of the caching happens in the browser, and the compute leverages all the power of your personal laptop, data analysis is no longer limited to users with access to ELT, a cloud data platform, and yes—even ThoughtSpot.
Also, with ThoughtSpot for Excel, all queries are on your local Excel data. This structure empowers all users to freely explore your data as a natural part of your workflow—without fear of cost concerns. In fact, ThoughtSpot for Excel is a great bridge to your cloud data platform; once users can freely explore their data with our lightweight feature set on Excel, they can grow into more seasoned functionality and expand their data views in the cloud.
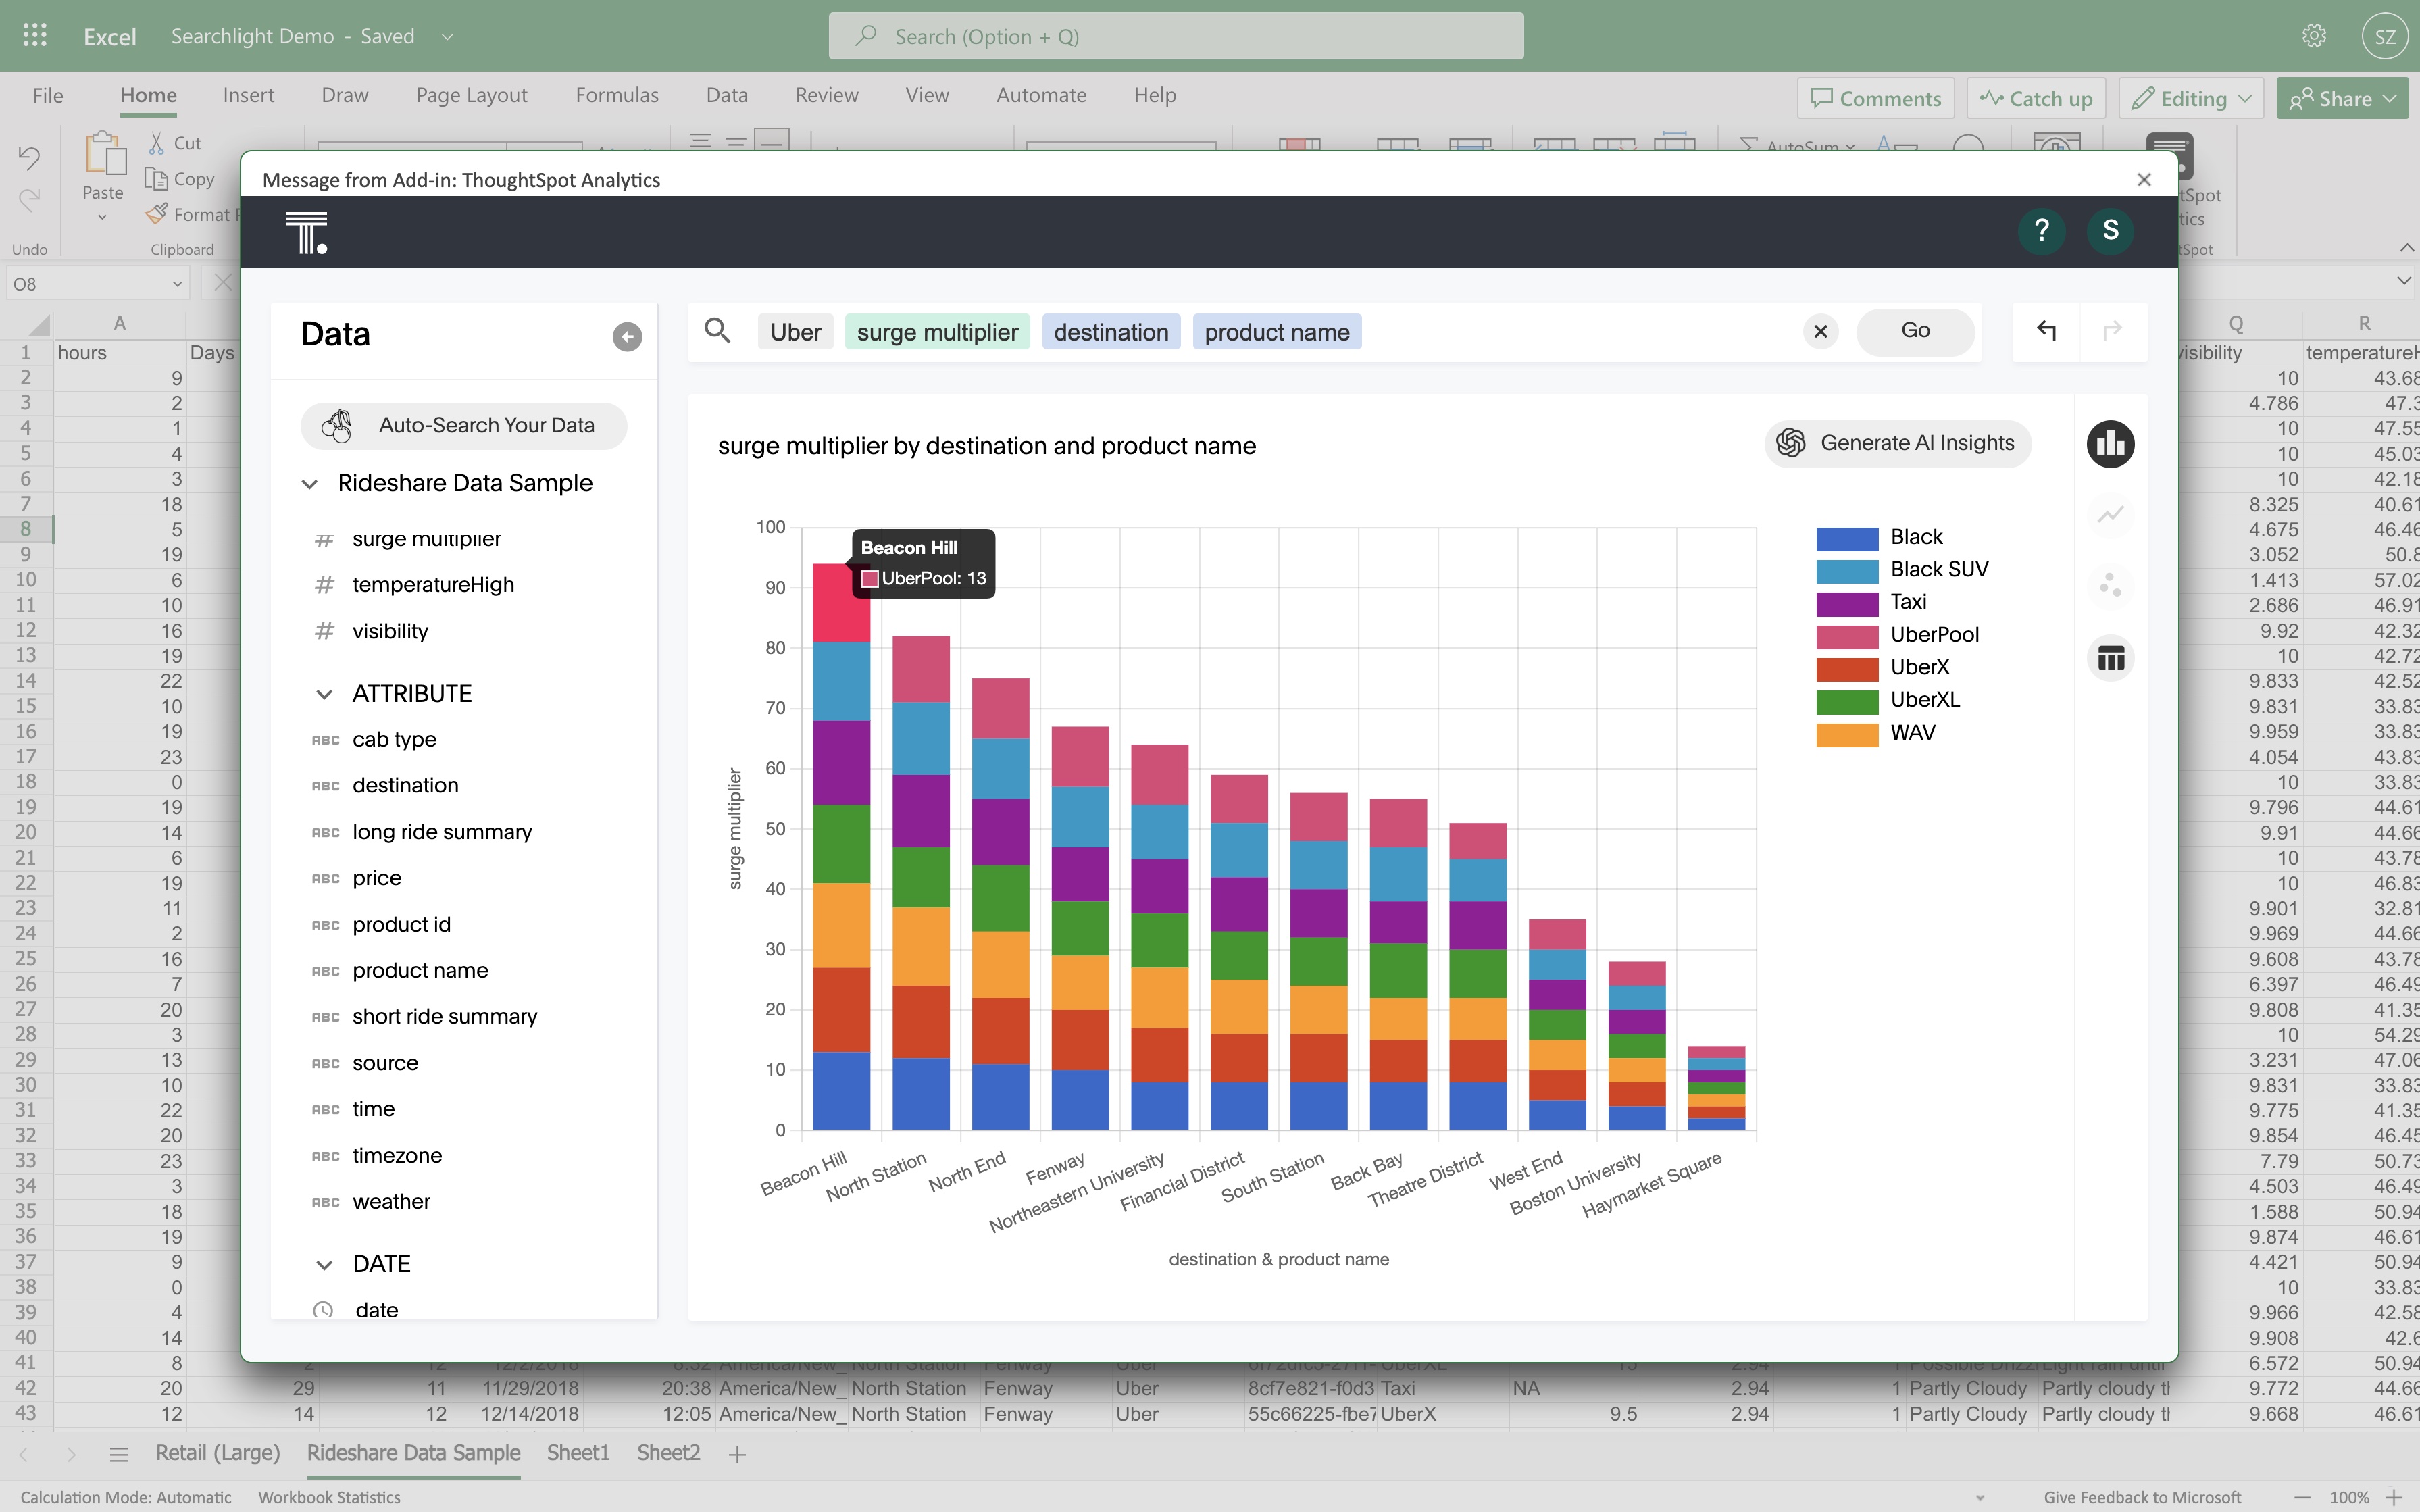
Search your Excel data in natural language
Once you have loaded the app, you're ready to start searching. You can start by typing in the search bar or selecting keywords to query from the side panel. ThoughtSpot for Excel comes equipped with powerful out-of-the-box keywords. For instance, our date aggregates allow you to quickly change your time horizon using "daily, weekly, monthly, etc." Or, you can simply refine your analysis with the addition of "top” and “bottom."
You can also utilize a whole host of new analytical commands for better chart configuration:
Group Y Axes
In cases where multiple metrics are used in a Column Chart or a Line Chart, this command will group all of the Y Axes together rather than displaying one Y Axis per metric.
Example query
Show Trend Lines
On a Line Chart where the X Axis is a date value, this command will provide one trend line per attribute or metric to display the overall trend of said attribute or metric over time.
Example query
Drill anywhere
Don’t worry if you never learned how to do a VLOOKUP properly (I know I haven’t). ThoughtSpot for Excel allows you to easily drill anywhere. Simply click on any part of the visualization to dig deeper into your data. You can leverage the in-app query navigation to go forward and backward in your journey, so you never get lost in the search.
Visualizations essentials
Free with ThoughtSpot for Excel, every user has access to an essential library of data visualizations. Today the app plugin supports line, bar, stacked bar, scatter-plot, and table visualizations.
Need more visualization options or interactive Liveboard capabilities? You’ll find even more power when you upgrade to ThoughtSpot Cloud.
What if you don’t know what to search for?
We spent a lot of time exploring how we could build intelligence into the app to help you kickstart your data journey. As fans of “one-button” solutions (just click it and magic happens) we built Auto-Search.
This has been one of the most lauded editions to the app from our early adopters. Simply click Auto-Search button in the top left and ThoughtSpot intelligently compiles an endless supply of combinations using your data types.
GPT-powered AI Insights = Your data literacy cheat codes
In case you missed it, we’ve heavily invested in our LLM capabilities, leveraging GPT to launch ThoughtSpot Sage, and going beyond to create modern data experiences for every user. Similarly, ThoughtSpot for Excel follows a very simple 3-part mantra: Ask, Answer, Explain.
Ask a question
Get a chart
Explain it to me
It’s a direct path to achieving organization-wide data literacy, or in pedestrian terms, Okay, I have a bar chart, now tell me what it means.
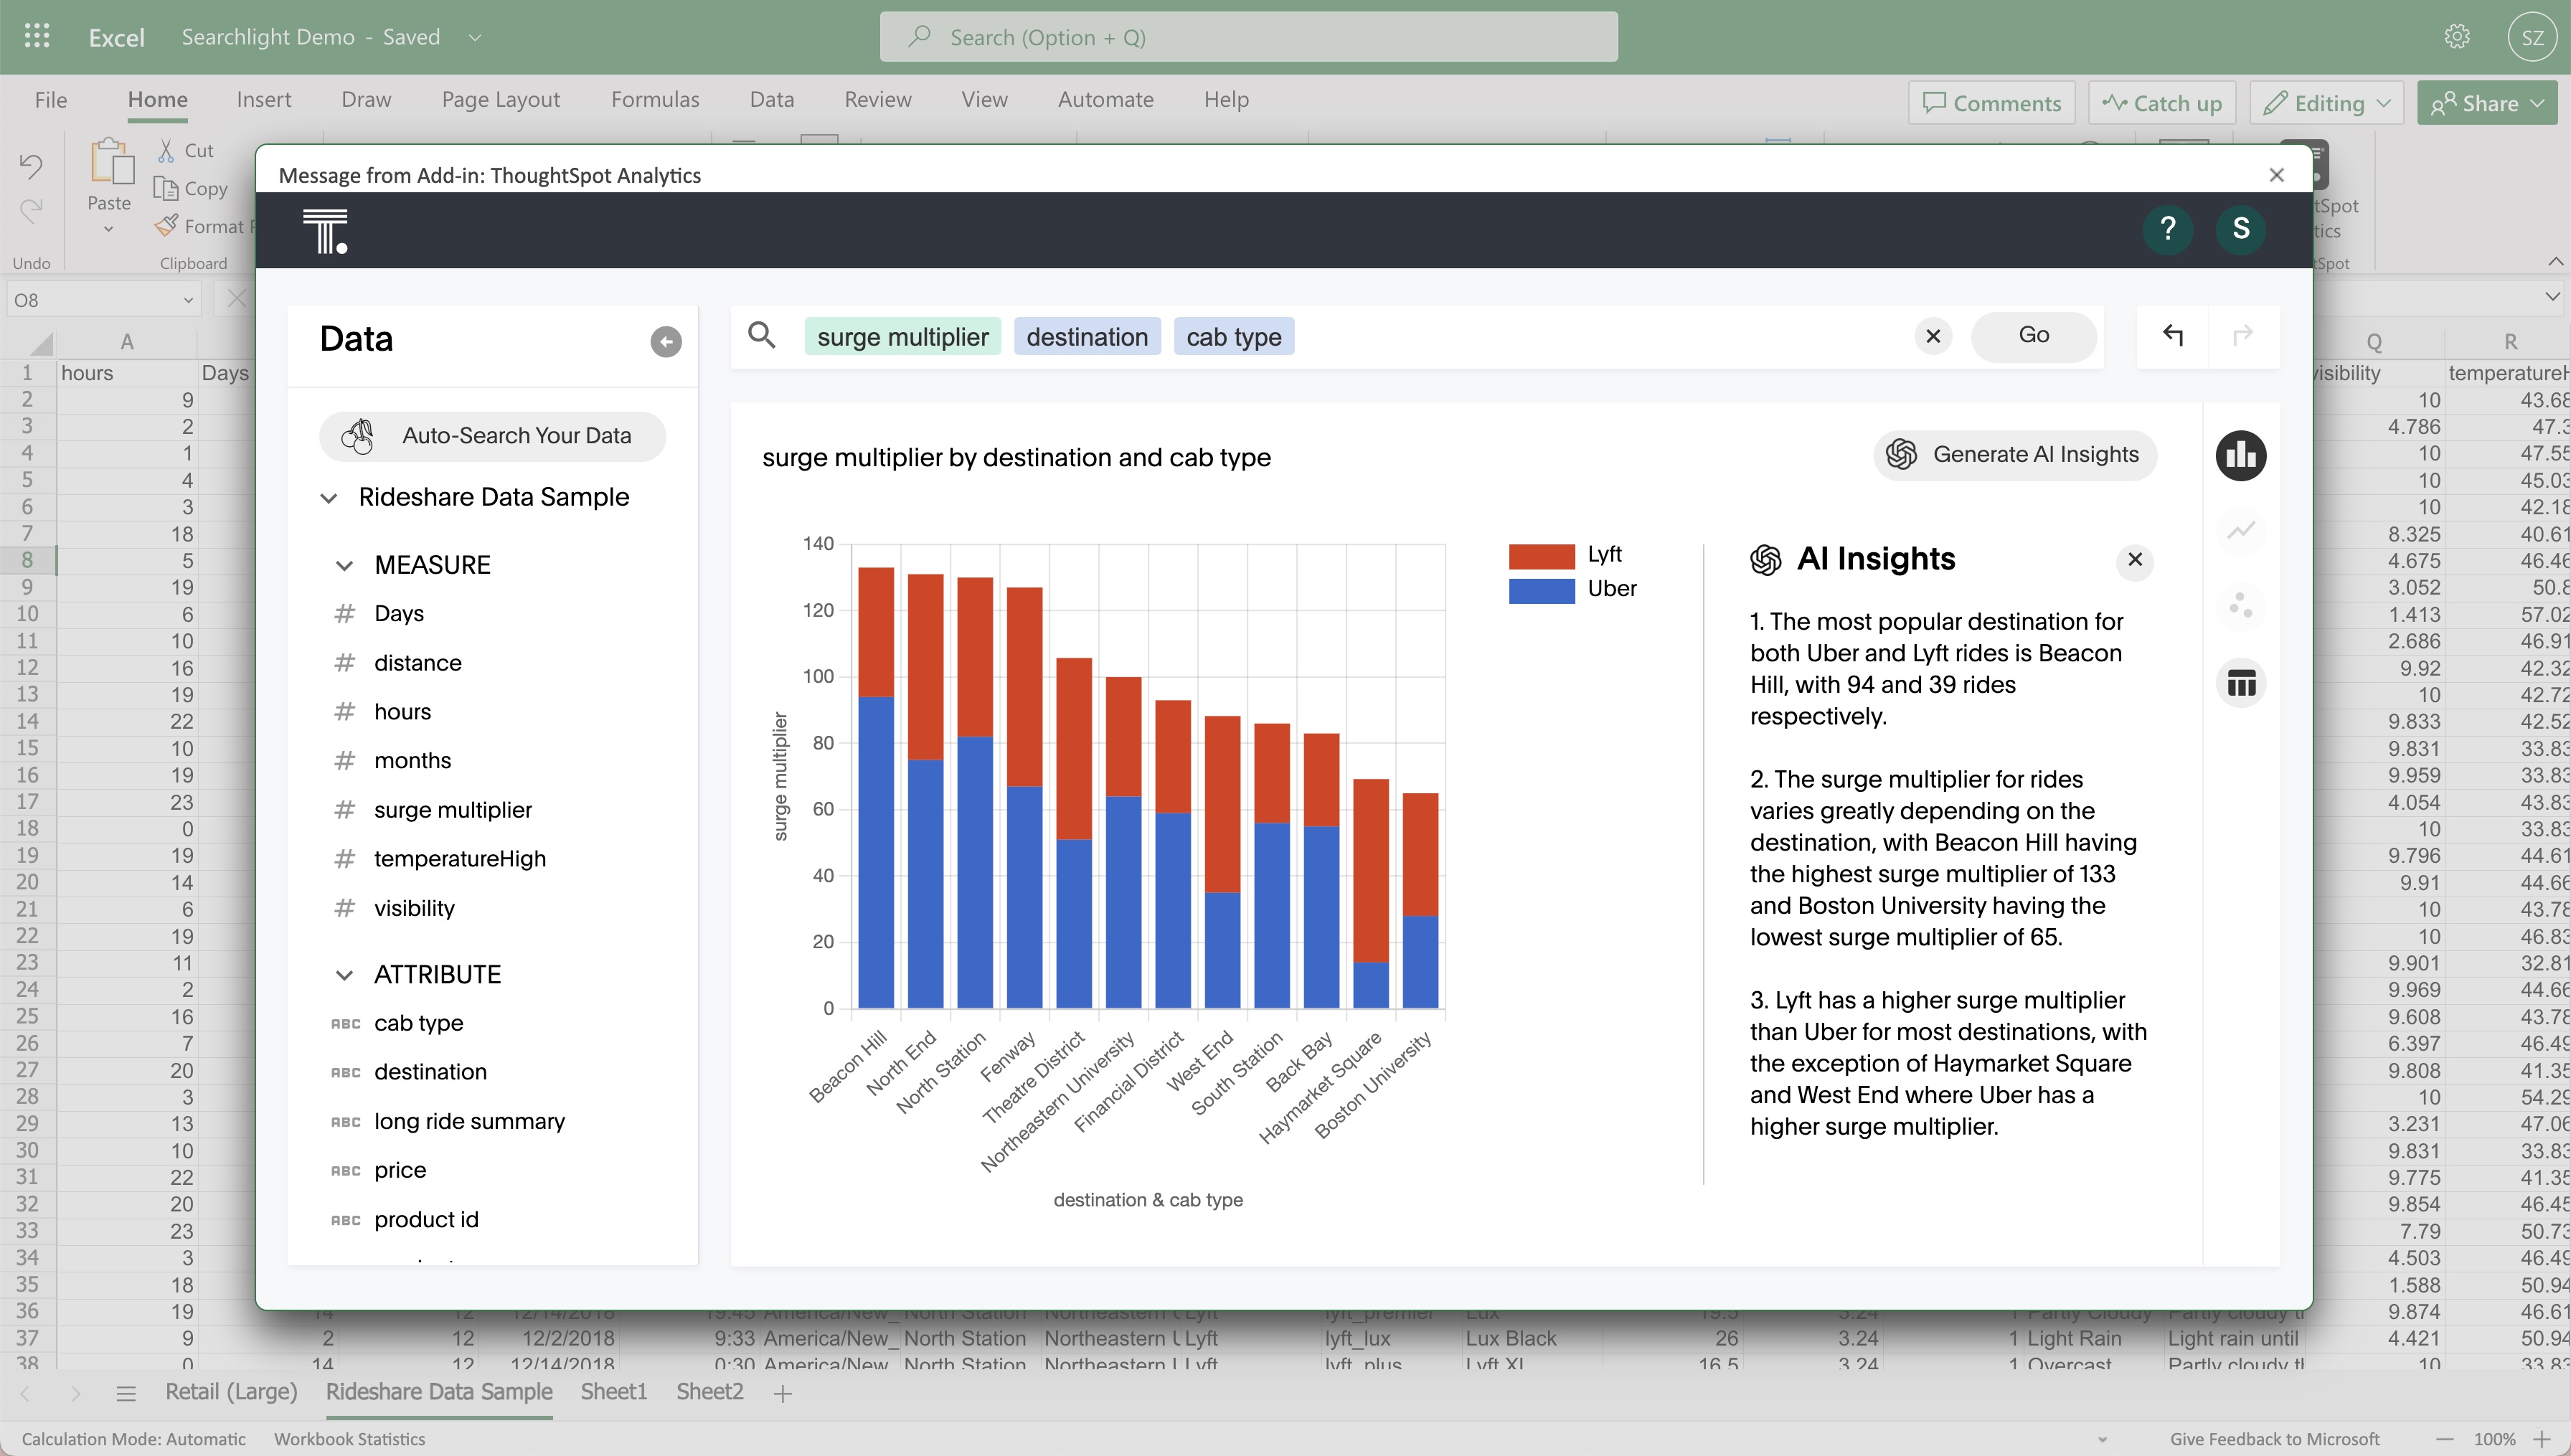
To answer that call, ThoughtSpot for Excel uses a dedicated AI-insights engine powered in the browser by GPT and DuckDB. Once you have a chart or visualization in the app, simply click AI insights in the top right corner, and the AI will generate the top three data stories about your visualization.
For those charged with data storytelling—which, let’s be honest, is almost everyone these days— this is a tremendously handy data analytics tool for creating your data story, and up-leveling your understanding of the data.
Did we mention that ThoughtSpot for Excel is 100% free?
Yup. Any Excel user can get all of this functionality free on their Excel data today. In the world of data, I challenge you to find a faster time to value than the 3-clicks we’ve built in ThoughtSpot for Excel:
Click 1 = Launch the app, models the data for you
Click 2 = Auto-search, auto-generate new visualizations
Click 3 = AI insights to explain any chart or visualization in natural language
So what’s next for ThoughtSpot for Excel?
Auto-Search and AI
Watch this space. With the explosion of LLMs on the market, we are already hard at work on the next generations of these features. One-click to auto-search through all your Excel data, another to explain what you found. We believe these two features alone can uplevel the novice Excel data user several levels—and dare we say, have fun along the way.
Pin to Excel, Pin to PowerPoint
Say goodbye to screenshotting your work for that next big presentation. We released Pin to Slides and Pin to Sheets for the ThoughtSpot for Sheets app, and will release corresponding features for Excel. This will allow you to pin your data visualizations to Excel as well as PowerPoint—empowering you to not only build, but also share your data stories.
Cloud connectivity for Excel
With the “Connected Excel" functionality, you’ll be able to push well-governed Snowflake data through ThoughtSpot’s data model and into Excel. The idea is that you get live data in nice shape to freely explore without cost concerns.
Start seeing your data with ThoughtSpot for Excel
That’s enough about the future; let’s get back to the now. Are you ready to level up your spreadsheet data analysis? Install the app today.
And as always, feel free to share your reviews with us in the Microsoft AppSource marketplace. We love reading your feedback and seeing how you're searching!


