

Update May 2023:
It’s been six months since the initial launch of ThoughtSpot for Sheets—the first free-for-everyone, and one of the best search-based analytics plugins for Google Workspace. During that time, we've seen over 4k+ installs with thousands of active users.
Even more exciting is how we're seeing users come back numerous times per week. It’s direct validation of our bold vision for Invisible BI. By neatly integrating into existing workflows, rather than forcing users to log into yet another app, users like you are finding more value in your data.
That’s why we’ve continued investing in the app, releasing new features directly through the browser. And today, we're excited to highlight a number of new major additions to ThoughtSpot for Sheets. Keep reading for a full product recap, or click the links below to jump to the new feature descriptions:
Businesses have been scaling rapidly in the cloud, driven by the pandemic and lured by the promise of agility and flexibility.
But here’s a dirty little secret anyone who works in data knows. Despite the value of the cloud, tons of data hasn’t made it there. So, where is it? Spreadsheets. Still the stalwart workhorse, hero, and bane of the business world. We all love how Google revolutionized this world by bringing spreadsheets to the cloud. You can create, share, and collaborate more seamlessly than ever with Google Sheets.
If you’re a knowledge worker today, you’re probably one of the 2 billion (yes billion with a B) people using Google Sheets every month. However, Sheets users come from many different skill levels.
You’ve got everyone from spreadsheet experts who can perform VLOOKUPS in the blink of an eye to the humble beginner just mastering how to write a simple SUM() formula. The truth is Spreadsheets are everywhere but aren't for everyone. Simply bringing them to the cloud isn’t going to fix that. As one of our customers said, "Sheets and Excel are pretty powerful, but not easy for everyone to use. It's one thing to get the data into sheets, but once it's there it's difficult to drill, ask ad-hoc questions, or simply build charts and visualizations."
Introducing ThoughtSpot for Sheets, our new standalone free app plugin built for Google Sheets. We wanted to build something lightweight, simple, and solely for streaming data in the browser. The goal was to give every Sheets user the ability to search to create charts and data visualizations easily–dare I say, an app that would make it FUN to explore your spreadsheet data.
Best of all, you don't need to be an existing customer. ThoughtSpot for Sheets is free - for everyone.
Let's take a look 😊
Getting started
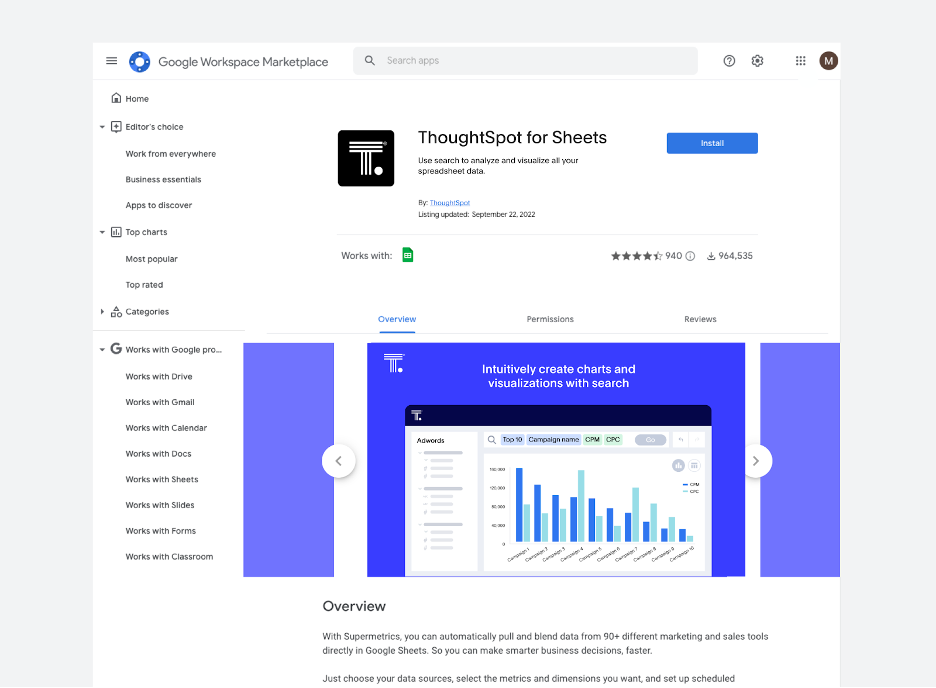
ThoughtSpot for Sheets is dead simple to launch. Do a quick search on Google Workspace Marketplace or find it here. A simple click and you’ve installed the app. If you are in an Enterprise organization, you might have to send a quick (super friendly) message to authorize the plugin from your Google Workspace Admin.
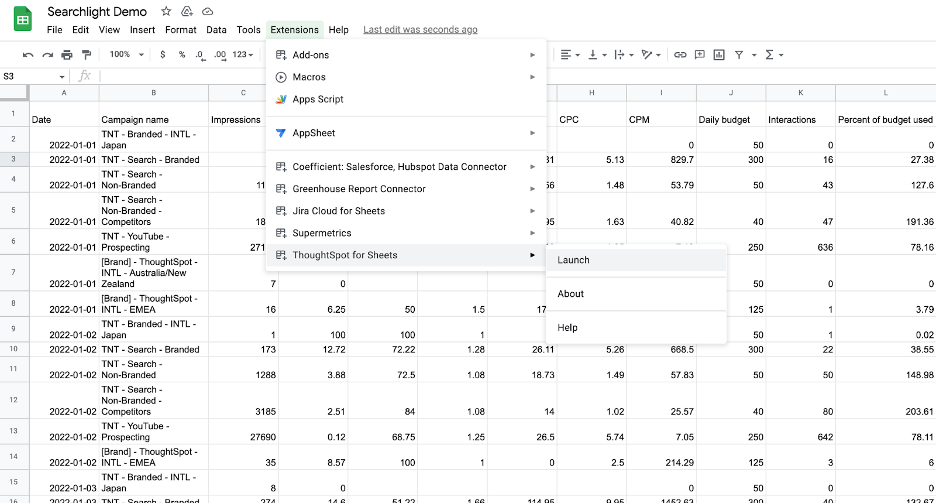
To get started, grab a Sheet you want to explore. Then, simply go to your extensions drop-down, select ThoughtSpot for Sheets, click launch, and let the fun begin.
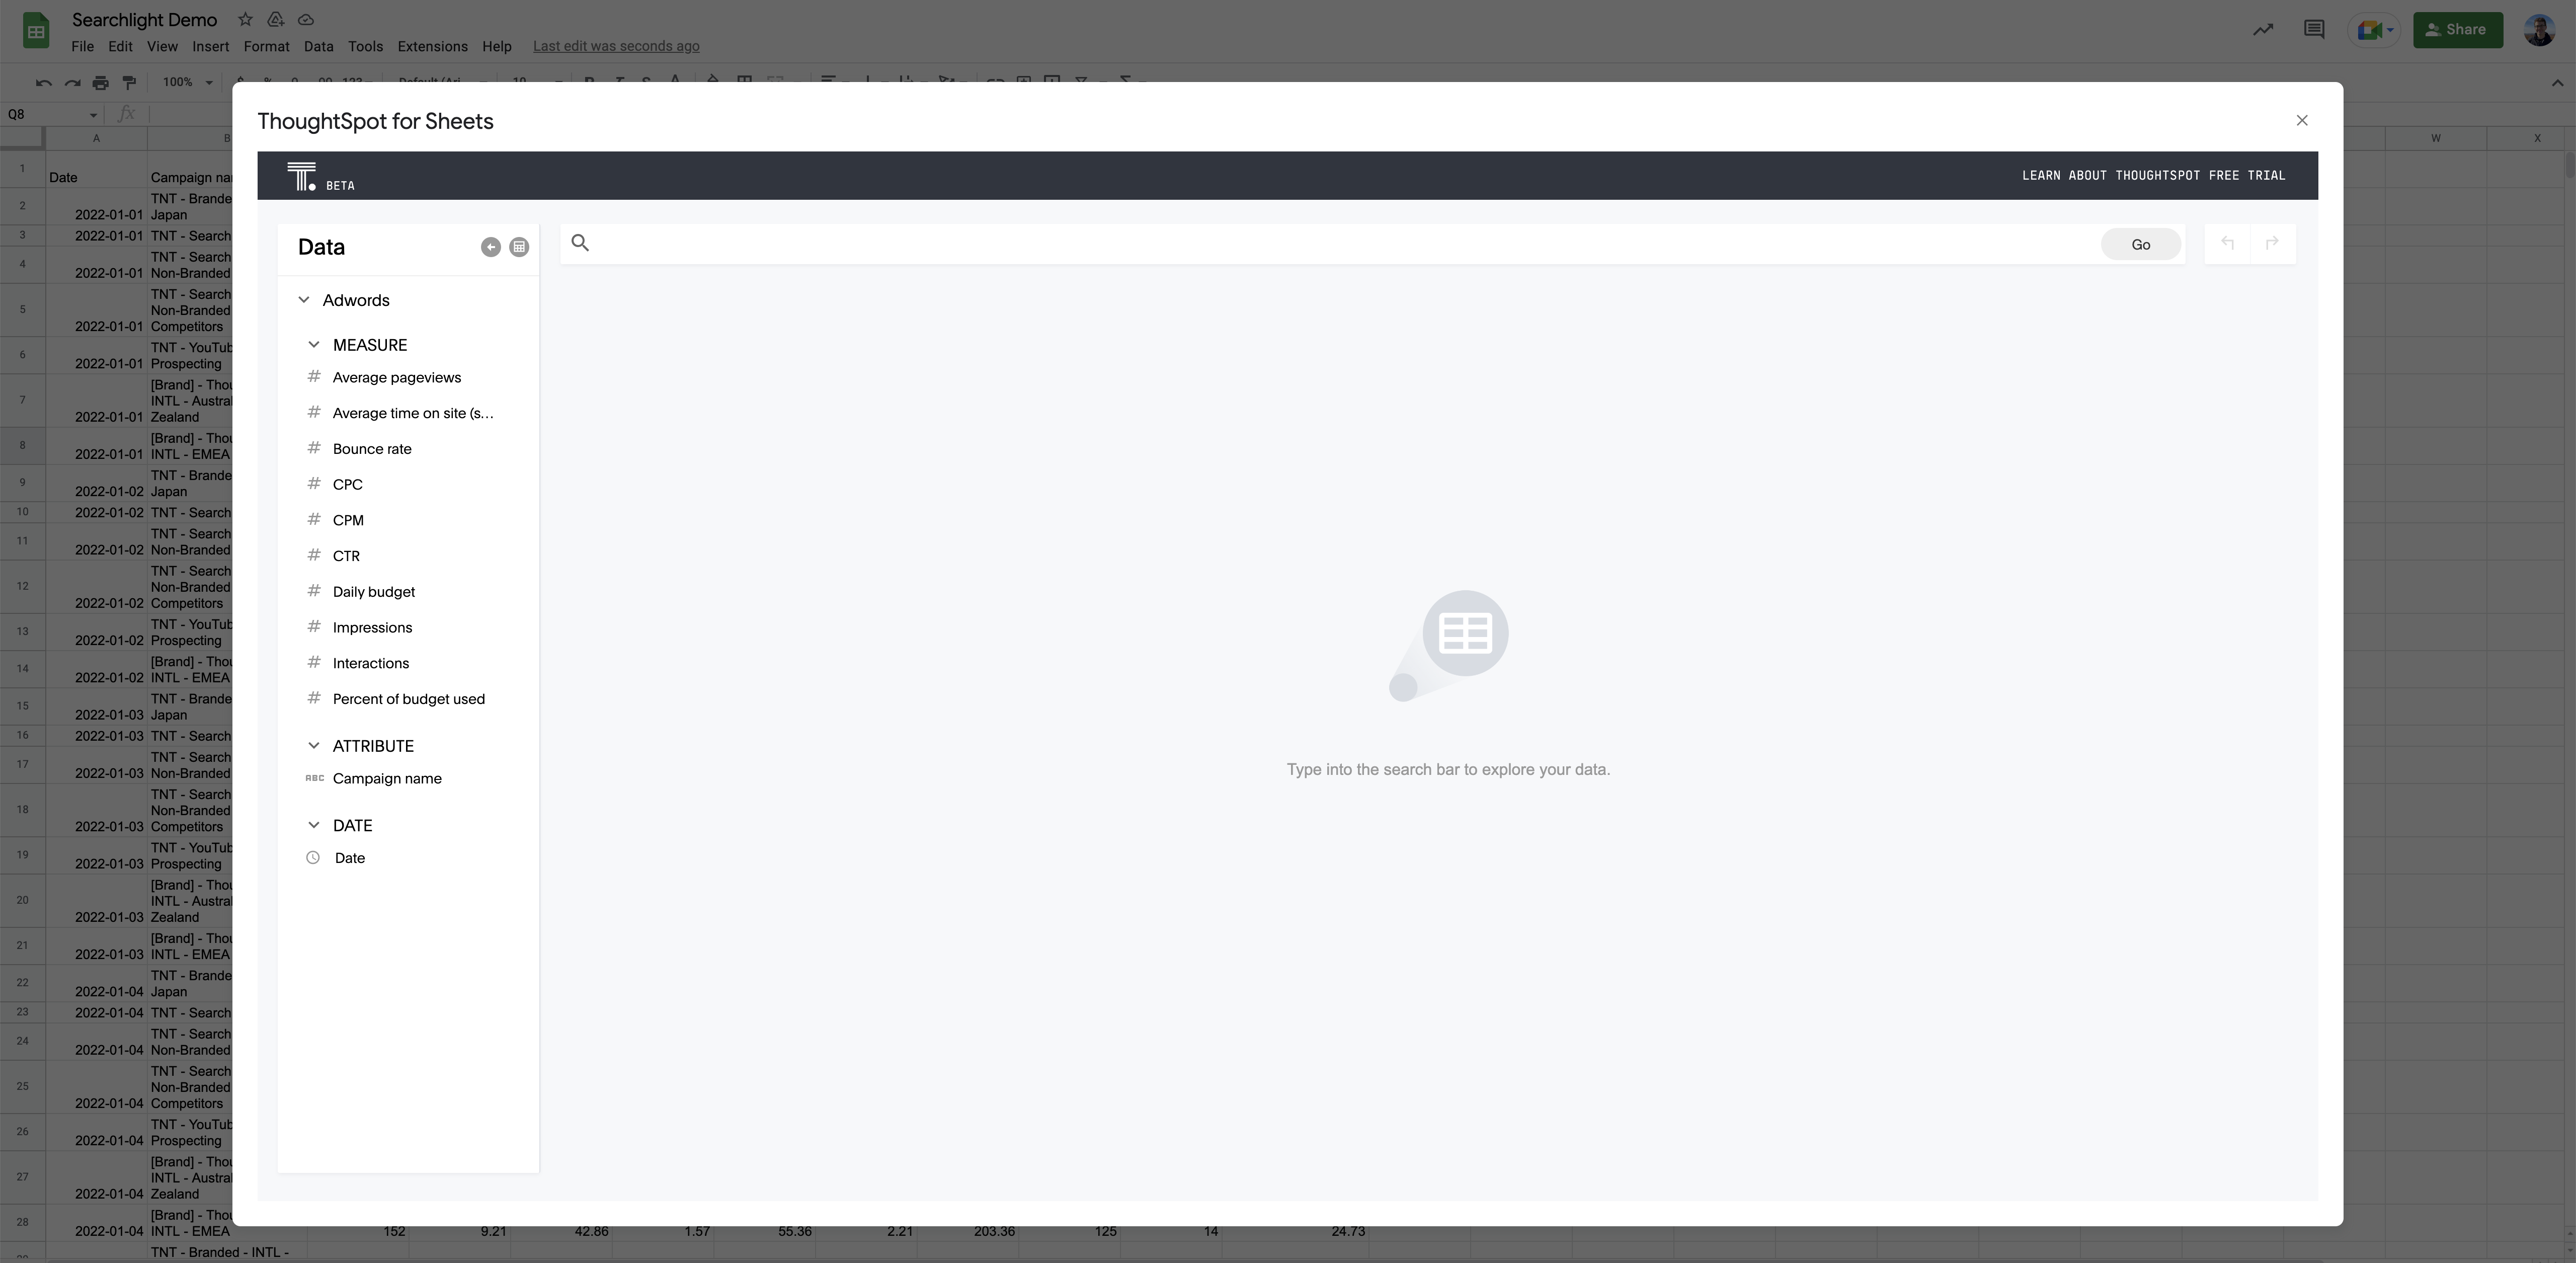
No data modeling is required
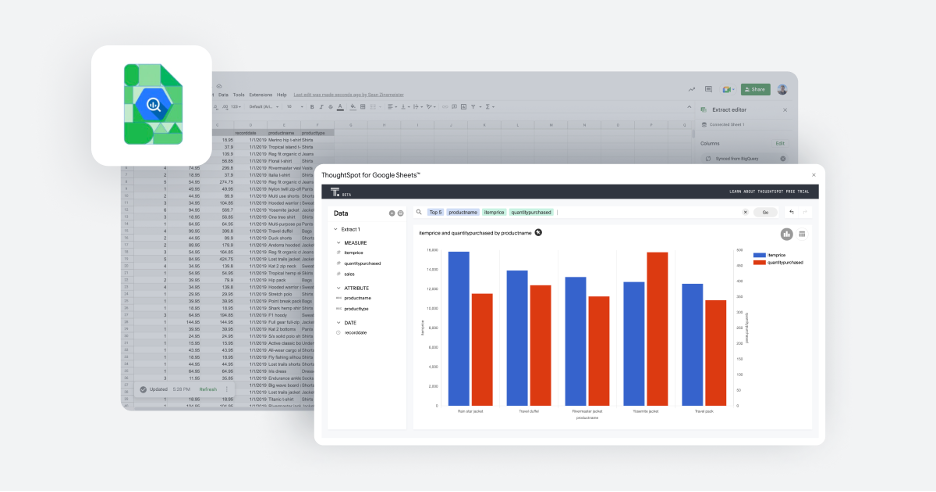
Say it again for the people in the back! No data modeling is required with ThoughtSpot for Sheets. Upon launch, the app automatically reads, understands, and categorizes your data into different types (DATES, MEASURES, ATTRIBUTES) all in a friendly modal that sits right on top of your Sheet so it's easy to explore.

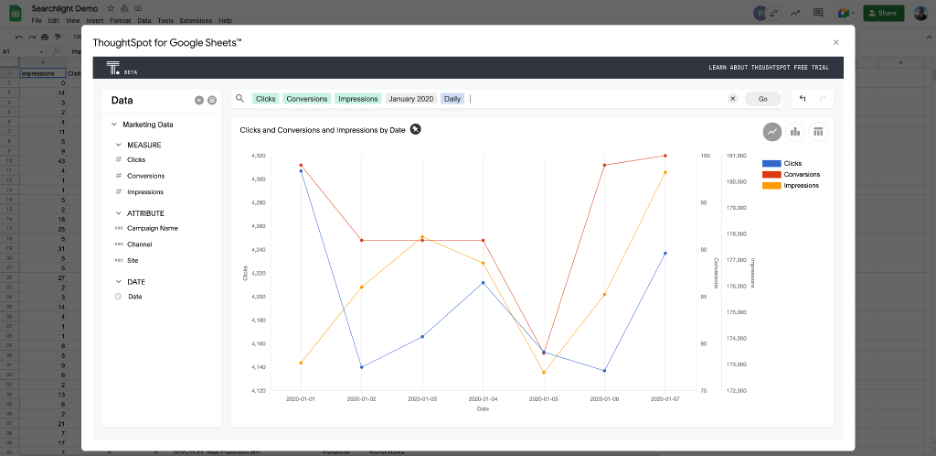
Create content with search
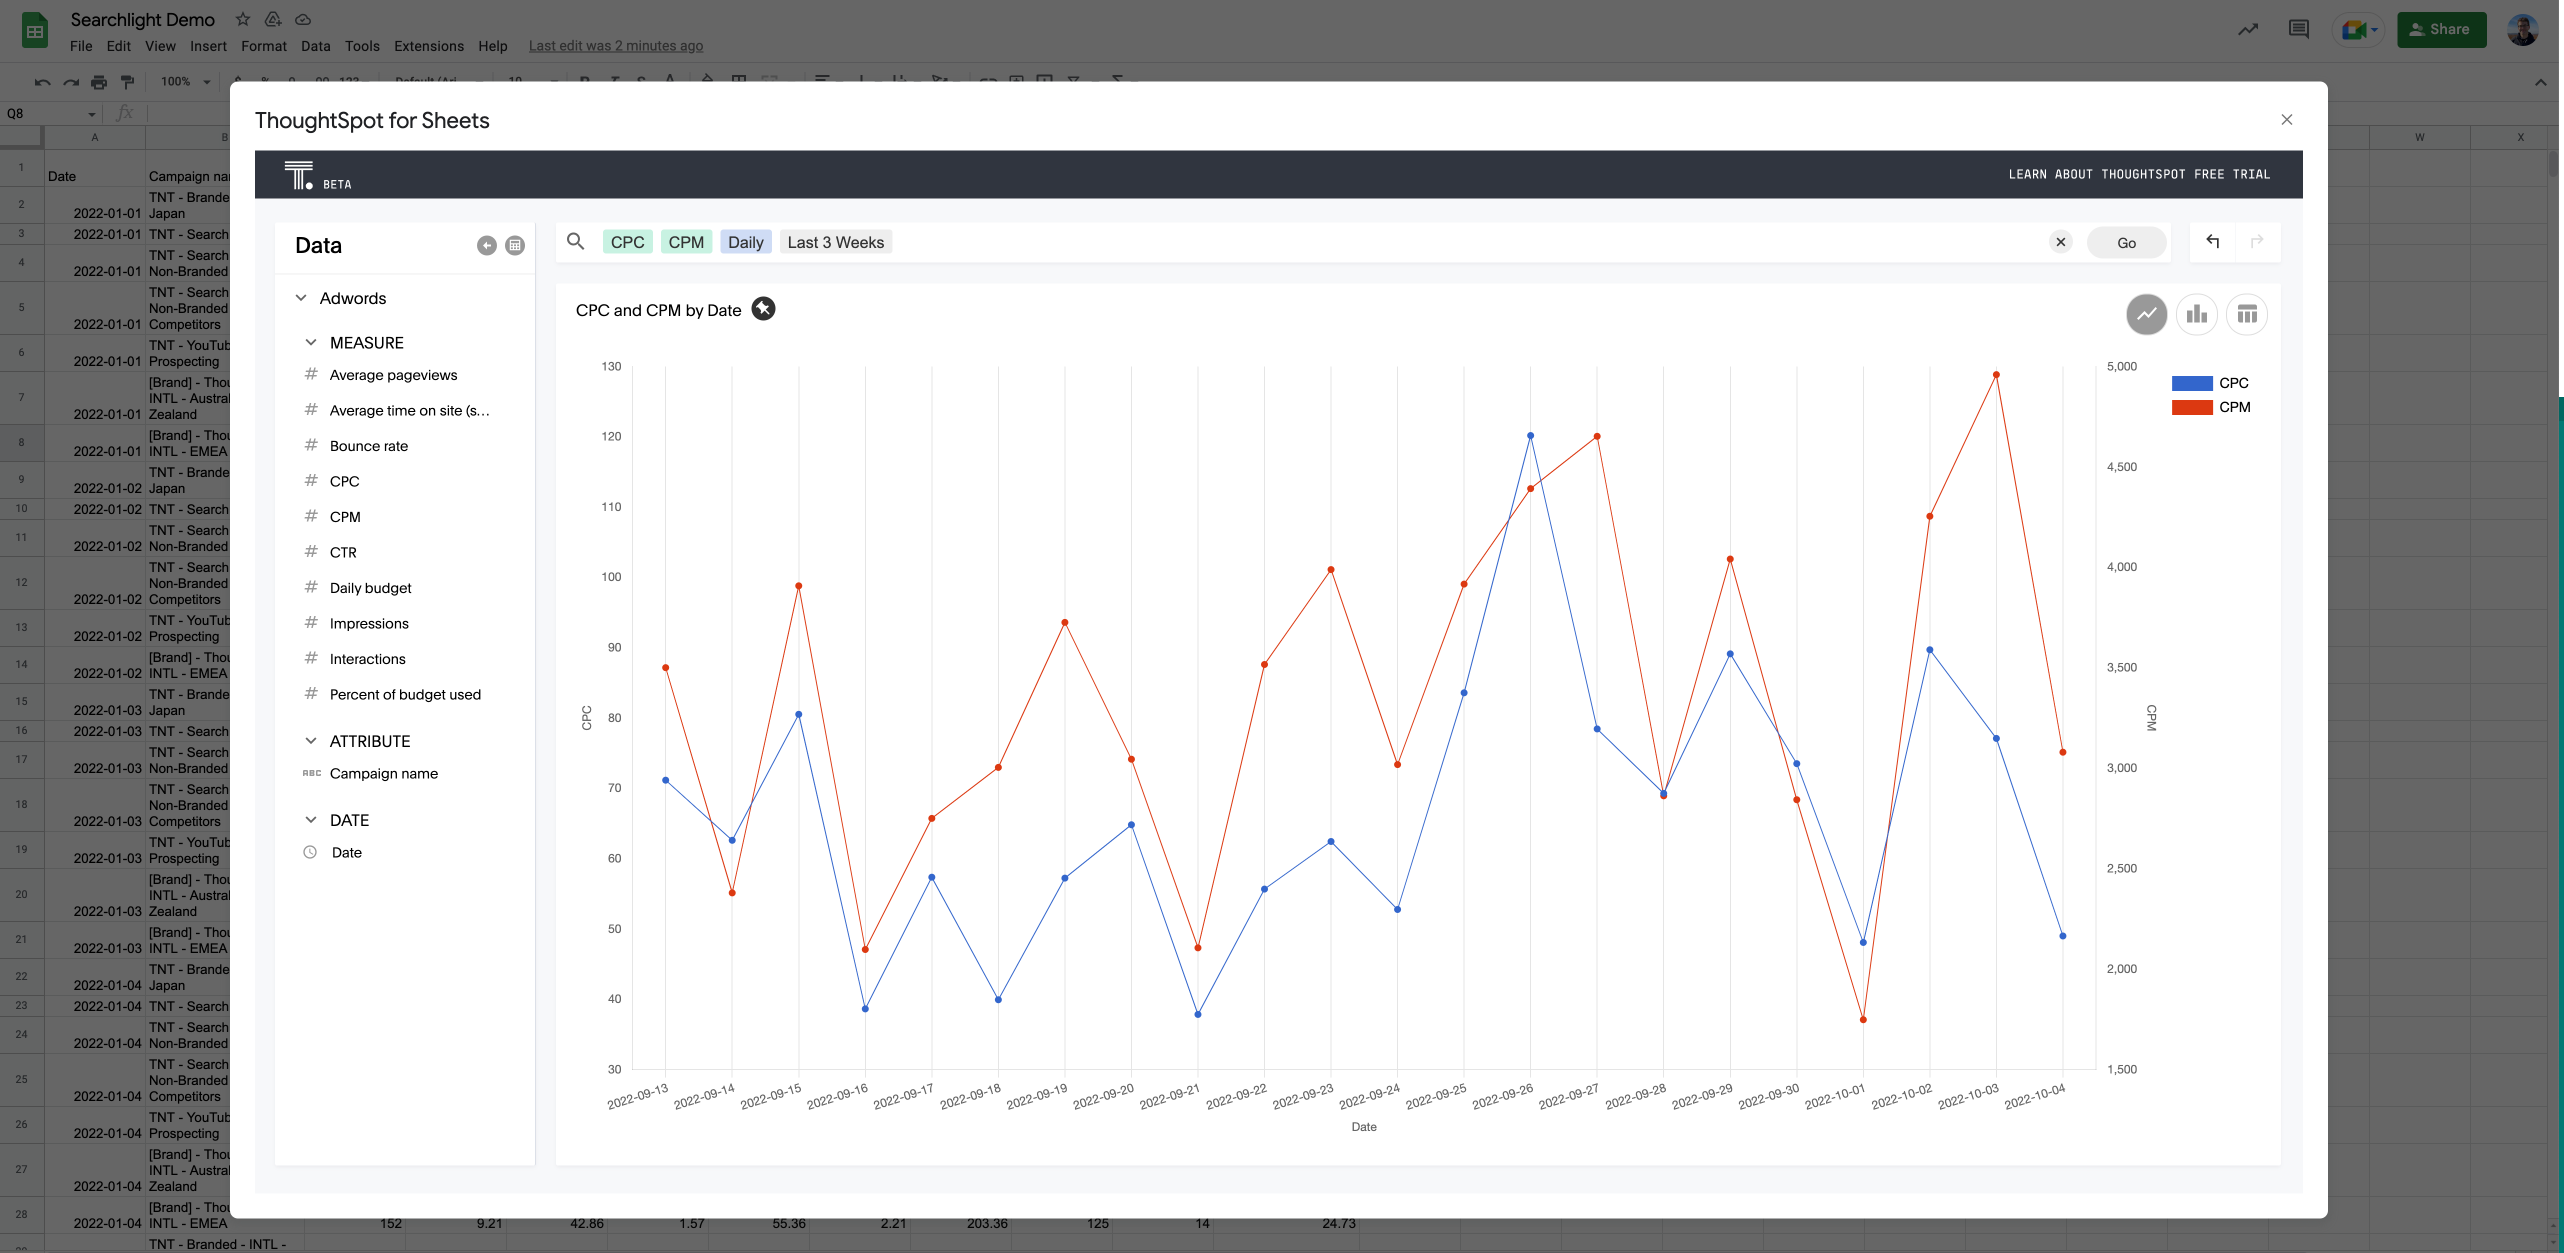
Once you've launched the app, you're ready to query your data with search. To do this you can either use the search bar, or click the columns available to you on the left-hand side of the screen.
With ThoughtSpot for Sheets, you have a lot of search power right in your Sheets. But you can also have access to native keywords like [top], [bottom], as well as ways to freely and naturally express dates on the fly like [daily, weekly, last 2 weeks, etc].
Caching is handled by the browser, and your laptop takes care of the rest of your computing power needs. It’s what we refer to as a data streaming app. To keep your Mac running smoothly, it's essential to optimize its performance. One effective way to do this is by clearing the Xcode cache.
Of course, in the decade of data, there will be limitations to the vast volume of data you can run through the spreadsheets in the browser. But don’t worry. When you are ready to grow into a cloud data platform, you can do so with our Team Edition for just $95.

(New) Auto-Search
Not sure what to search for or just feeling lucky? Hit Auto-Search, and ThoughtSpot will intelligently compile an endless number of combinations of your data types to create new charts and visualizations. Sit back and let ThoughtSpot cruise through your data until we find something that piques your interest. Early feedback shows this is users’ favorite new feature. 🔥
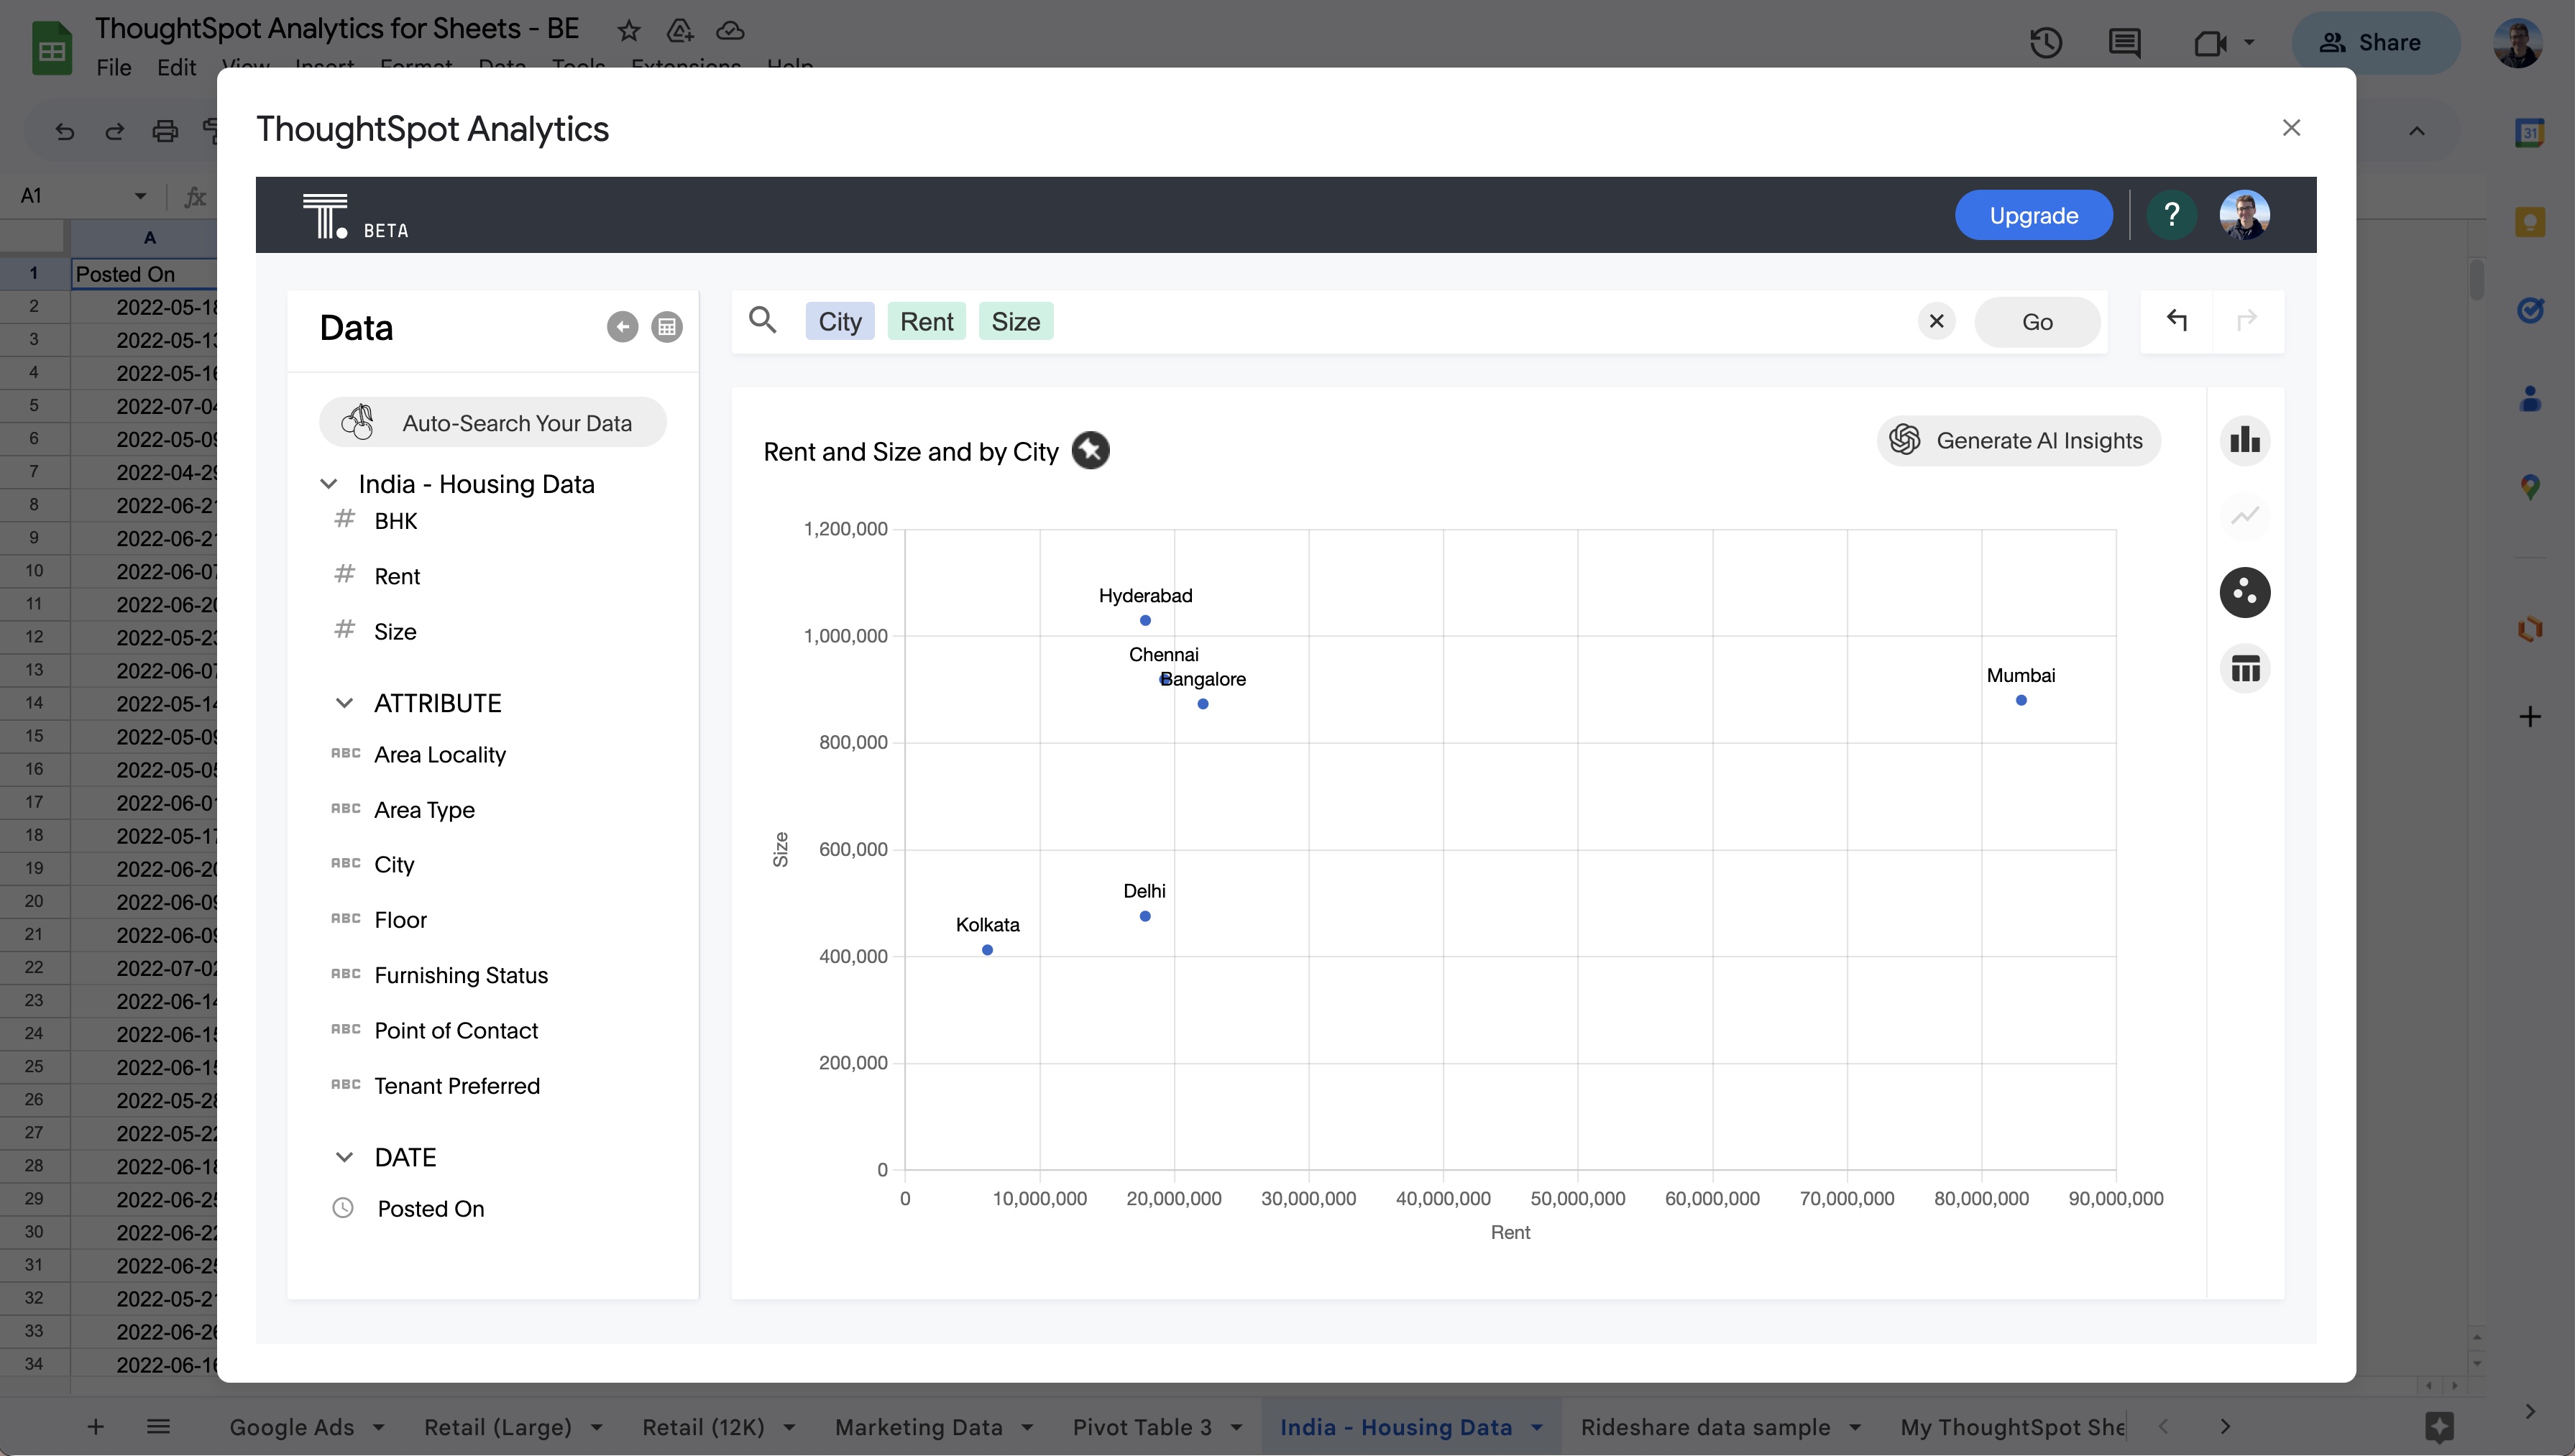
(New) Chart types
The goal of ThoughtSpot for Sheets was not to be your full-purpose BI tool. That said, we have added scatter plot to our growing list of free visualization essentials. Watch this space as we are continuously adding more interactive data visualizations based on user demand.
(New) Configuration commands
In addition to new visualizations, we've also introduced new analytics commands to give you more flexibility with chart configuration.
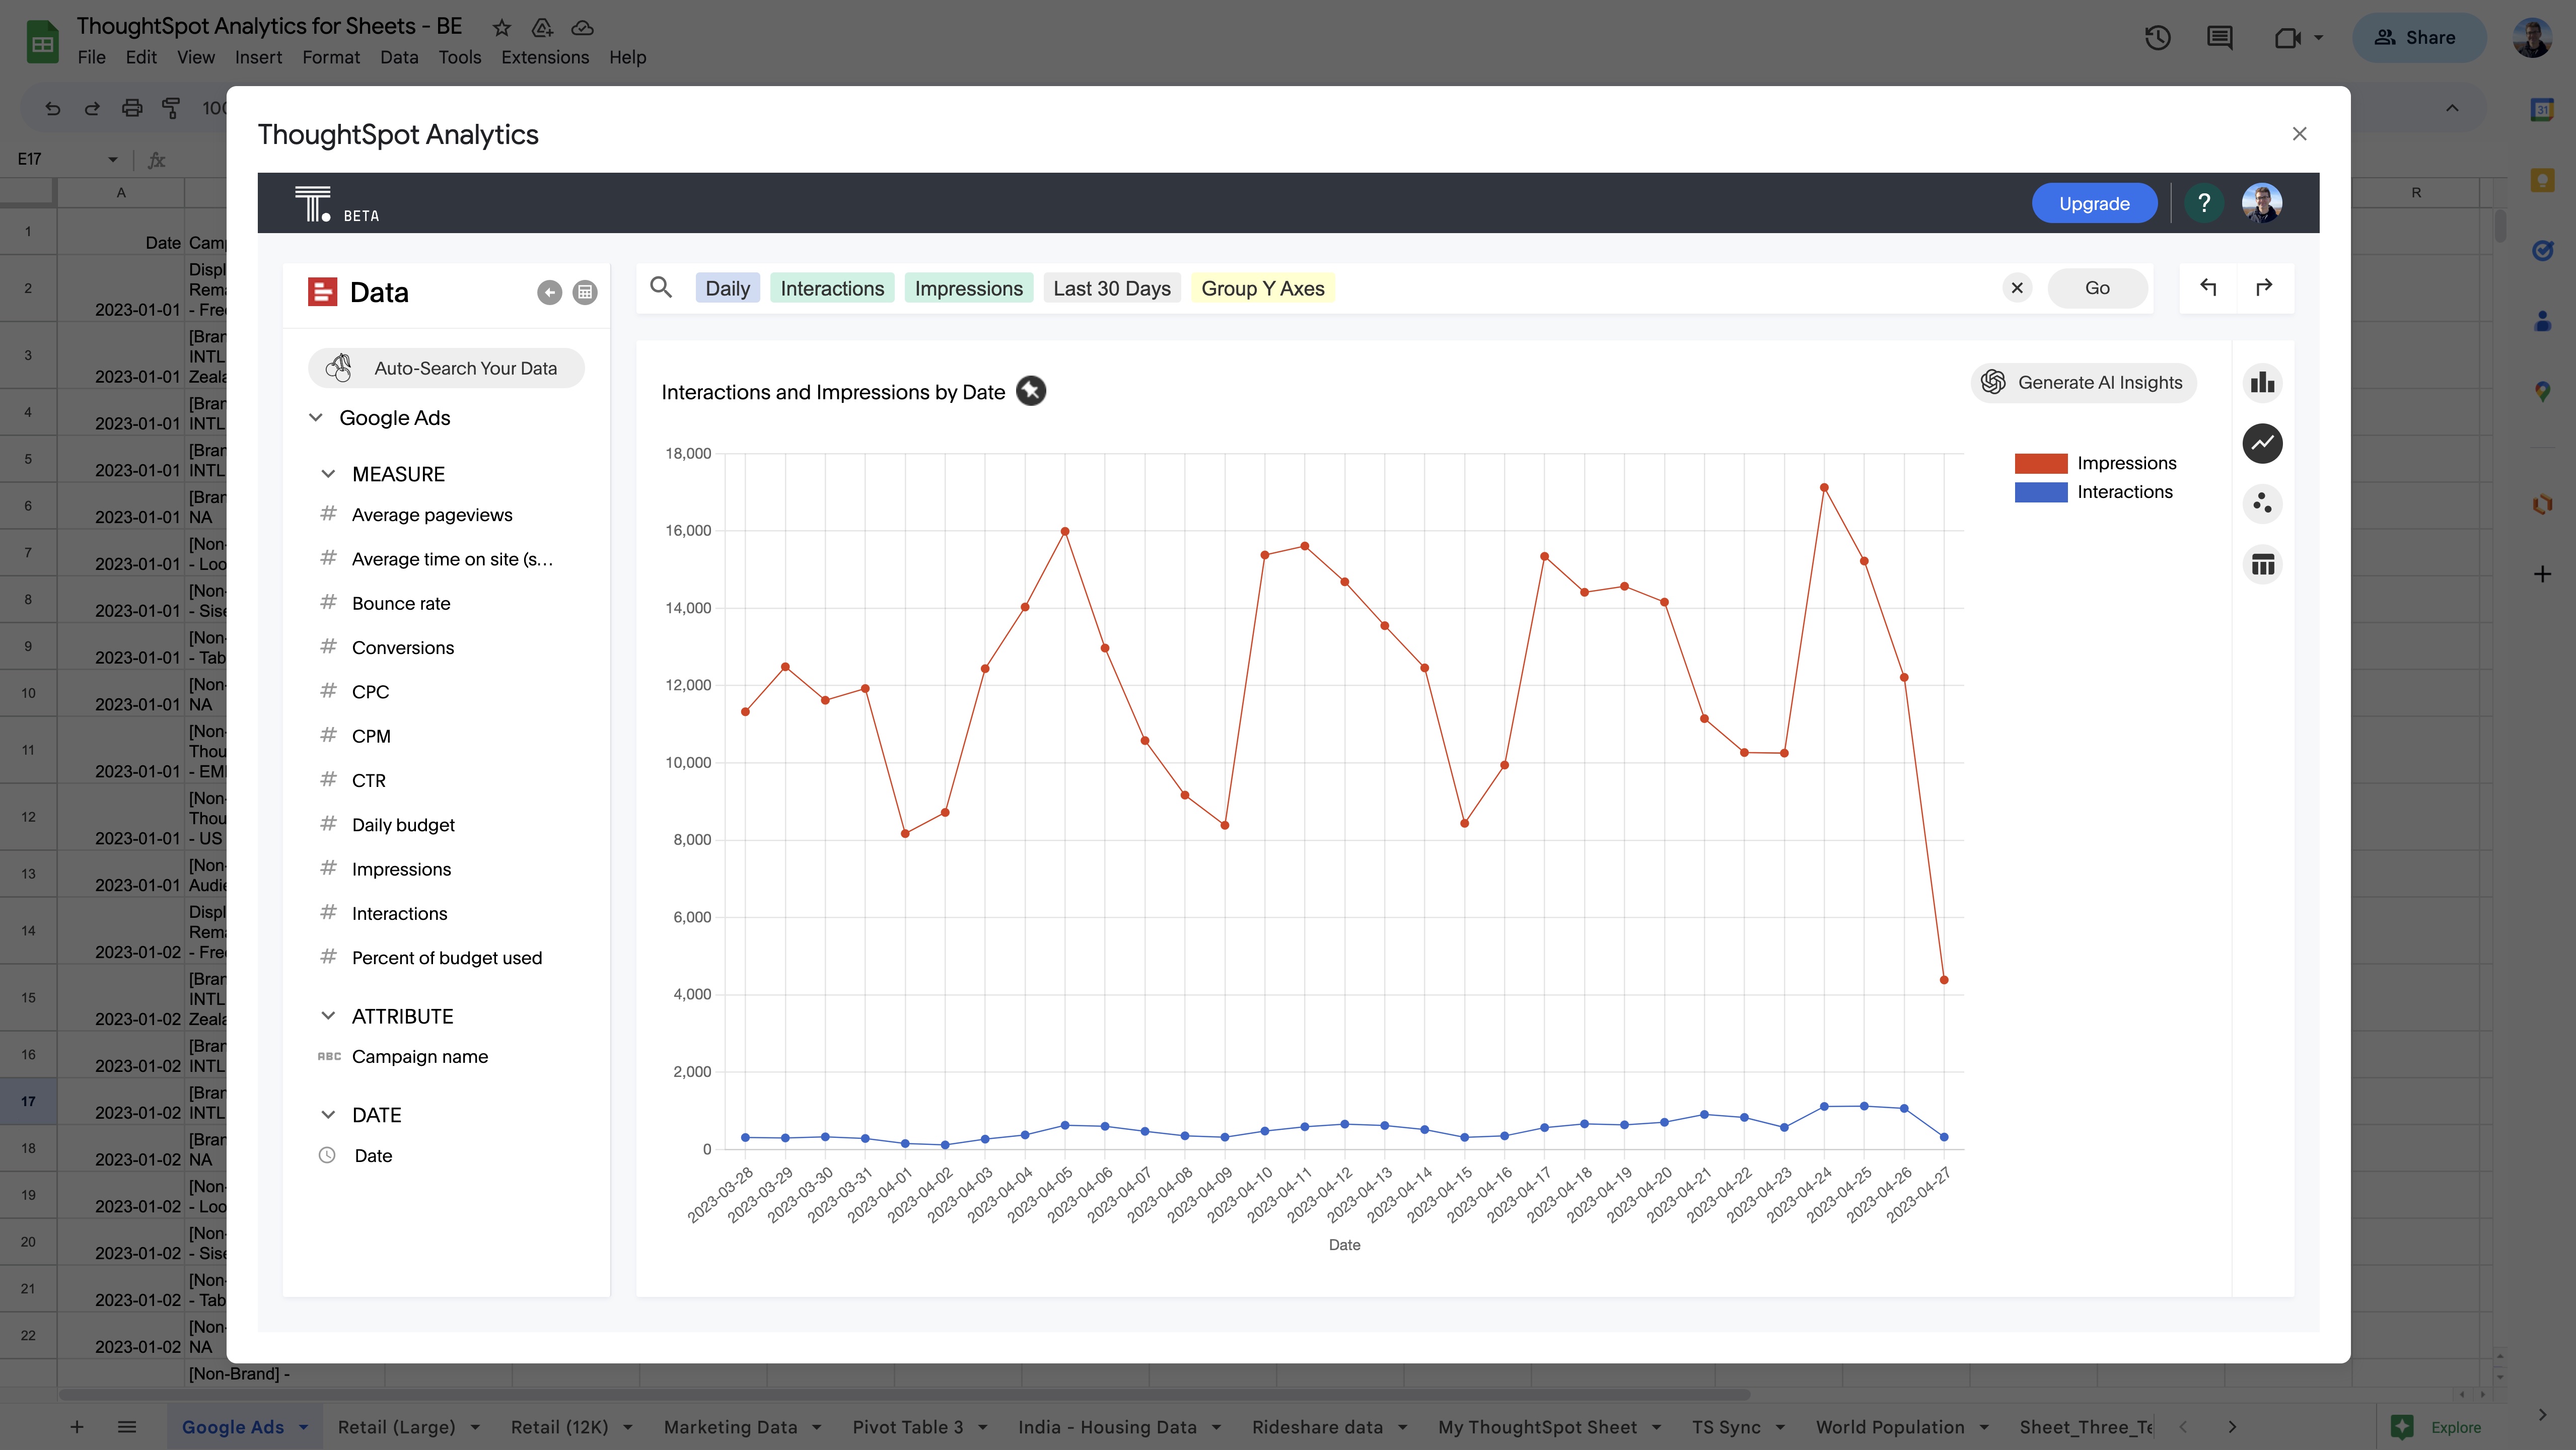
Group Y Axes
In cases where you have multiple metrics being used in a Column Chart or a Line Chart, this prompt will group all of the Y Axes together rather than displaying one Y Axis per metric.
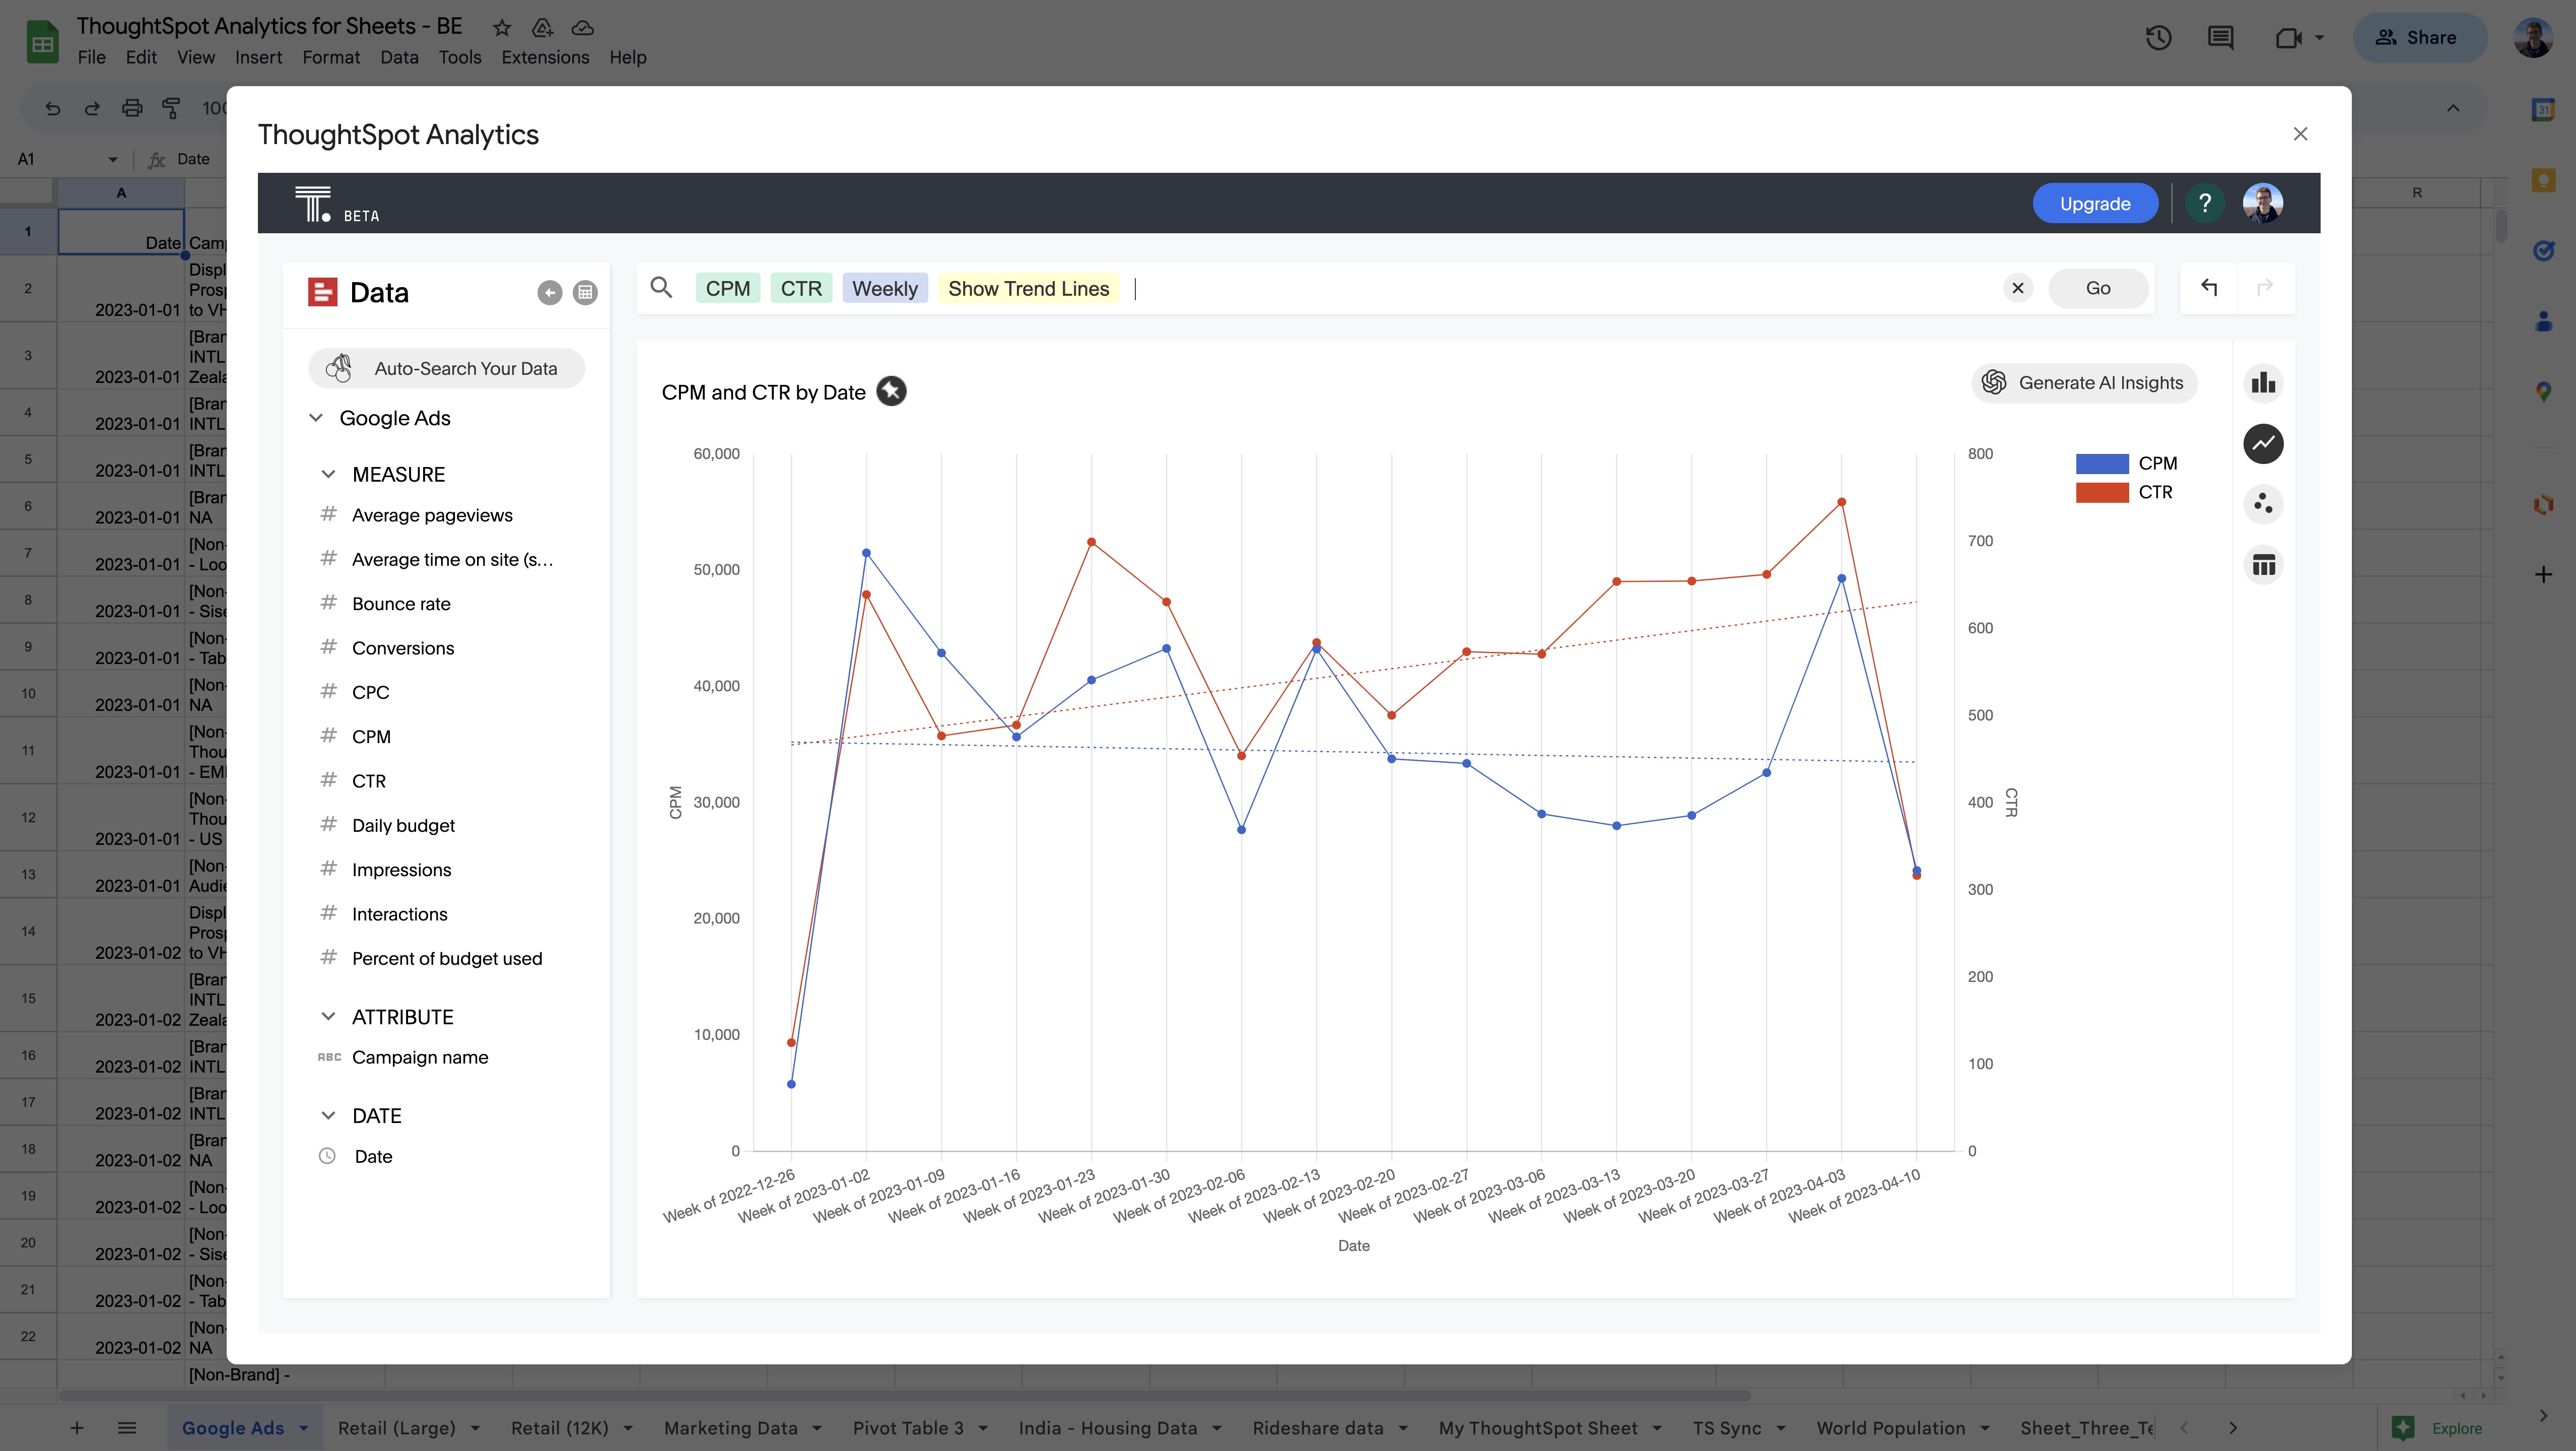
Show Trend Lines
On a Line Chart where the X Axis is a date value, this command will provide one trend line per attribute or metric to display the overall trend of said attribute or metric over time.
If you need more advanced analytics, interactive Liveboards, or an extensive library of data visualizations, we encourage you to start a free trial of ThoughtSpot.
Drill anywhere
There is a particular irony in referring to spreadsheets for "ad-hoc" analysis. It’s easy to assume that once someone is staring at columns and rows, it's easy to get started. However, for more than 70% of people according to new research we just conducted, it's very difficult to drill into spreadsheet data.
Say goodbye to VLOOKUPS; ThoughtSpot for Sheets makes this easy. The search engine includes a powerful, but lightweight SQL engine under the hood to make it easy for the user to drill anywhere in the data.
Once ThoughtSpot for Sheets is launched and you begin your search query, simply right-click on any point for the chart you want to investigate. You'll then be prompted with a list of available data types you can drill by.
(New) AI Insights
But what if you don’t know where to drill to find the needle in your data stack? That’s where AI-Powered Analytics can help.
With the meteoric rise of LLMs like GPT, PaLM, Dolly, and others—the software world will never be the same. We wanted all ThoughtSpot for Sheets users to have an AI-powered experience that was both reliable and useful.
The truth is analytics adoption is still heavily hampered by data literacy challenges. "Ok this is a stacked bar chart...but what does it mean?" To answer this question, we built a new AI-Insights engine. Now, with one-click, the AI analyzes your visualization to generate your top three data stories in natural language.
Today, ThoughtSpot for Sheet’s AI-powered insights leverages GPT-3.5 Turbo and DuckDB to help scale in the browser. We're actively working with the Google team to explore how PaLM and other Google AI can deliver even more value for Google Sheets users on Google Cloud. Recently, we've launched AI Explain which utilizes the Bison model from Google's PaLM 2 LLM. This integration enables it to automatically craft top data stories for any visualization that is created using our Sheets extension. Keep a close eye on future innovations in this space!
Easy internal navigation
Data exploration needs to be multi-dimensional. So in addition to making it easy for you to drill anywhere in your spreadsheet data, you can also use internal navigation controls to help your journey.
The undo/redo buttons on the right-hand side of the screen works similar to your browser navigation. Now you'll never worry about losing your place or returning to an ah-ha moment you might have missed in your session.
Just like most of our browsers, Sheets often have many, many tabs. To help you switch from sheet to sheet without leaving the app, we’ve added navigation on the left-hand side…just click to navigate and choose the sheet you want for a new session.
Pin to Sheets and Slides
Once you have the insights you want, it's time to save your work so you can share, collaborate, or present your data in a meaningful way. We’ve all experienced the pain of trying to do this in Excel or Google Sheets. With ThoughtSpot for Sheets, you have two ways to make this a snap: Pin to Sheets and Pin to Slides. During your session, you can Pin to Sheets, which will open up a new tab if one doesn't exist where you can save snapshots of your data.
For most of us though, we want to instantly go into presentation building mode. With Pin to Slides,you can easily save your charts and visualizations to a new presentation in an instant so you can share with clients, the next big board meeting, or collaborate with team members.
🥁Teaser...we are getting a lot of exciting feedback already about our "pin to" features for both Slides and Sheets so watch this space for future updates.
Architecture-less is more
How often do you think about the architecture of the products you use? I bet you’ve never thought “what cloud is this on?” when using HubSpot or Salesforce. The same is true for ThoughtSpot for Sheets. Everything is client-side streaming through the browser.
Making it seamless with partner integrations
Getting data into sheets is a whole other problem in the market - and we’re glad to have some new friends to make that a snap. We've integrated ThoughtSpot for Sheets app with three premier partners:
Google Connected Sheets
At the beginning of 2022 Google has made Connected Sheets free for every user! This means you can use Google Sheets to query your BigQuery data platform live. You simply build your connection to BigQuery, and once the data is in Sheets you can launch ThoughtSpot for Sheets for ad-hoc analysis.
Coefficient.io
Is a horizontal application that lets you take all your source systems, including your cloud data platform (Snowflake, GBQ, etc) and SaaS apps, and bring that live data into Google Sheets. ThoughtSpot for Sheets integrates seamlessly, detecting and understanding the data coming from Coefficient and makes it easy to explore. Combined with Coefficient's powerful scheduling engine, it's easy to explore Sheets data with ThoughtSpot and build new live queues with Coefficient.
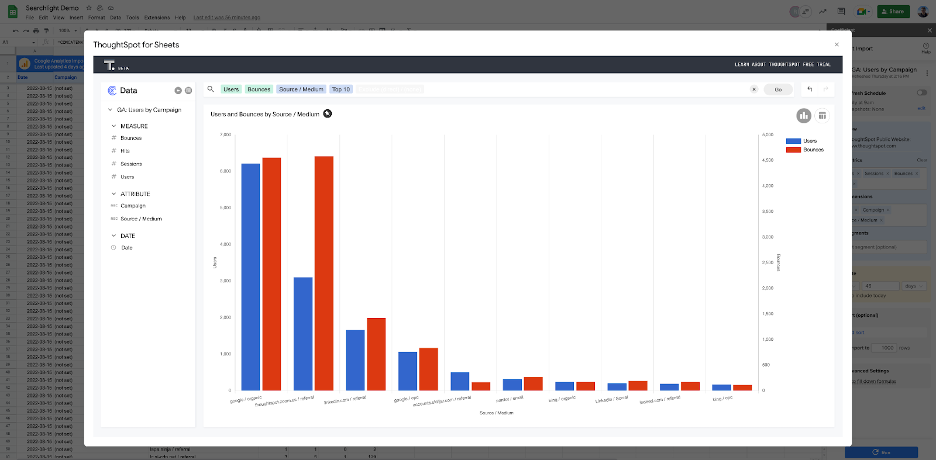
Supermetrics
Marketing is a data-driven profession, so whether you're an agency or brand you likely live in Sheets. Fortunately, the Supermetrics team knows this world well and gives you a brilliant way to bring all your Marketing apps data into sheets for ad-hoc analysis. ThoughtSpot for Sheets automatically detects data coming from Supermetrics so you can quickly find and create new opportunities for clients or drill anywhere to uncover that next winning campaign.
If you’re ready to supercharge your spreadsheets, install the app today. We’d love to hear your feedback!


