

As the Senior Director of Revenue Marketing, I’m responsible for optimizing our campaigns and every customer touchpoint.
No biggie, right?
I’m part of a lean marketing team at a high-growth company. We’re not in the business of generating leads – we’re about creating real demand for our products. Instead, my priority is to figure out what we’re doing that impacts the bottom line, how we can measure that impact, and what steps we need to take next to maximize that impact.
Since I joined ThoughSpot, my approach to measuring demand has shifted in a big way. In previous roles, I was usually assessing past performance: what worked, what didn’t, and how we could do better next time.
Now, it’s not all post mortems and three-week lead times. I’m focused on the future. I go into ThoughtSpot every day to ask: “What can I do to impact the bottom line today?”
Here are the top five ways I use self-service analytics for demand generation:
1. Dig into the health of your MQL flow
Marketing Qualified Leads (MQLs) aren’t a golden metric, but they’re very important if you want to hit top-of-the-funnel pipeline numbers. After all, those critical first meetings are driven by leads, which are driven by campaigns. And it all gets a bit complex when dealing with different regions, products, and market segments.
So that’s where I’ll start my day. It’s a live “gut check” on how we’re doing; taking the pulse of the business, so to speak.
At ThoughtSpot, I have an MQL Liveboard to see how well we’re pacing with our MQL monthly targets.
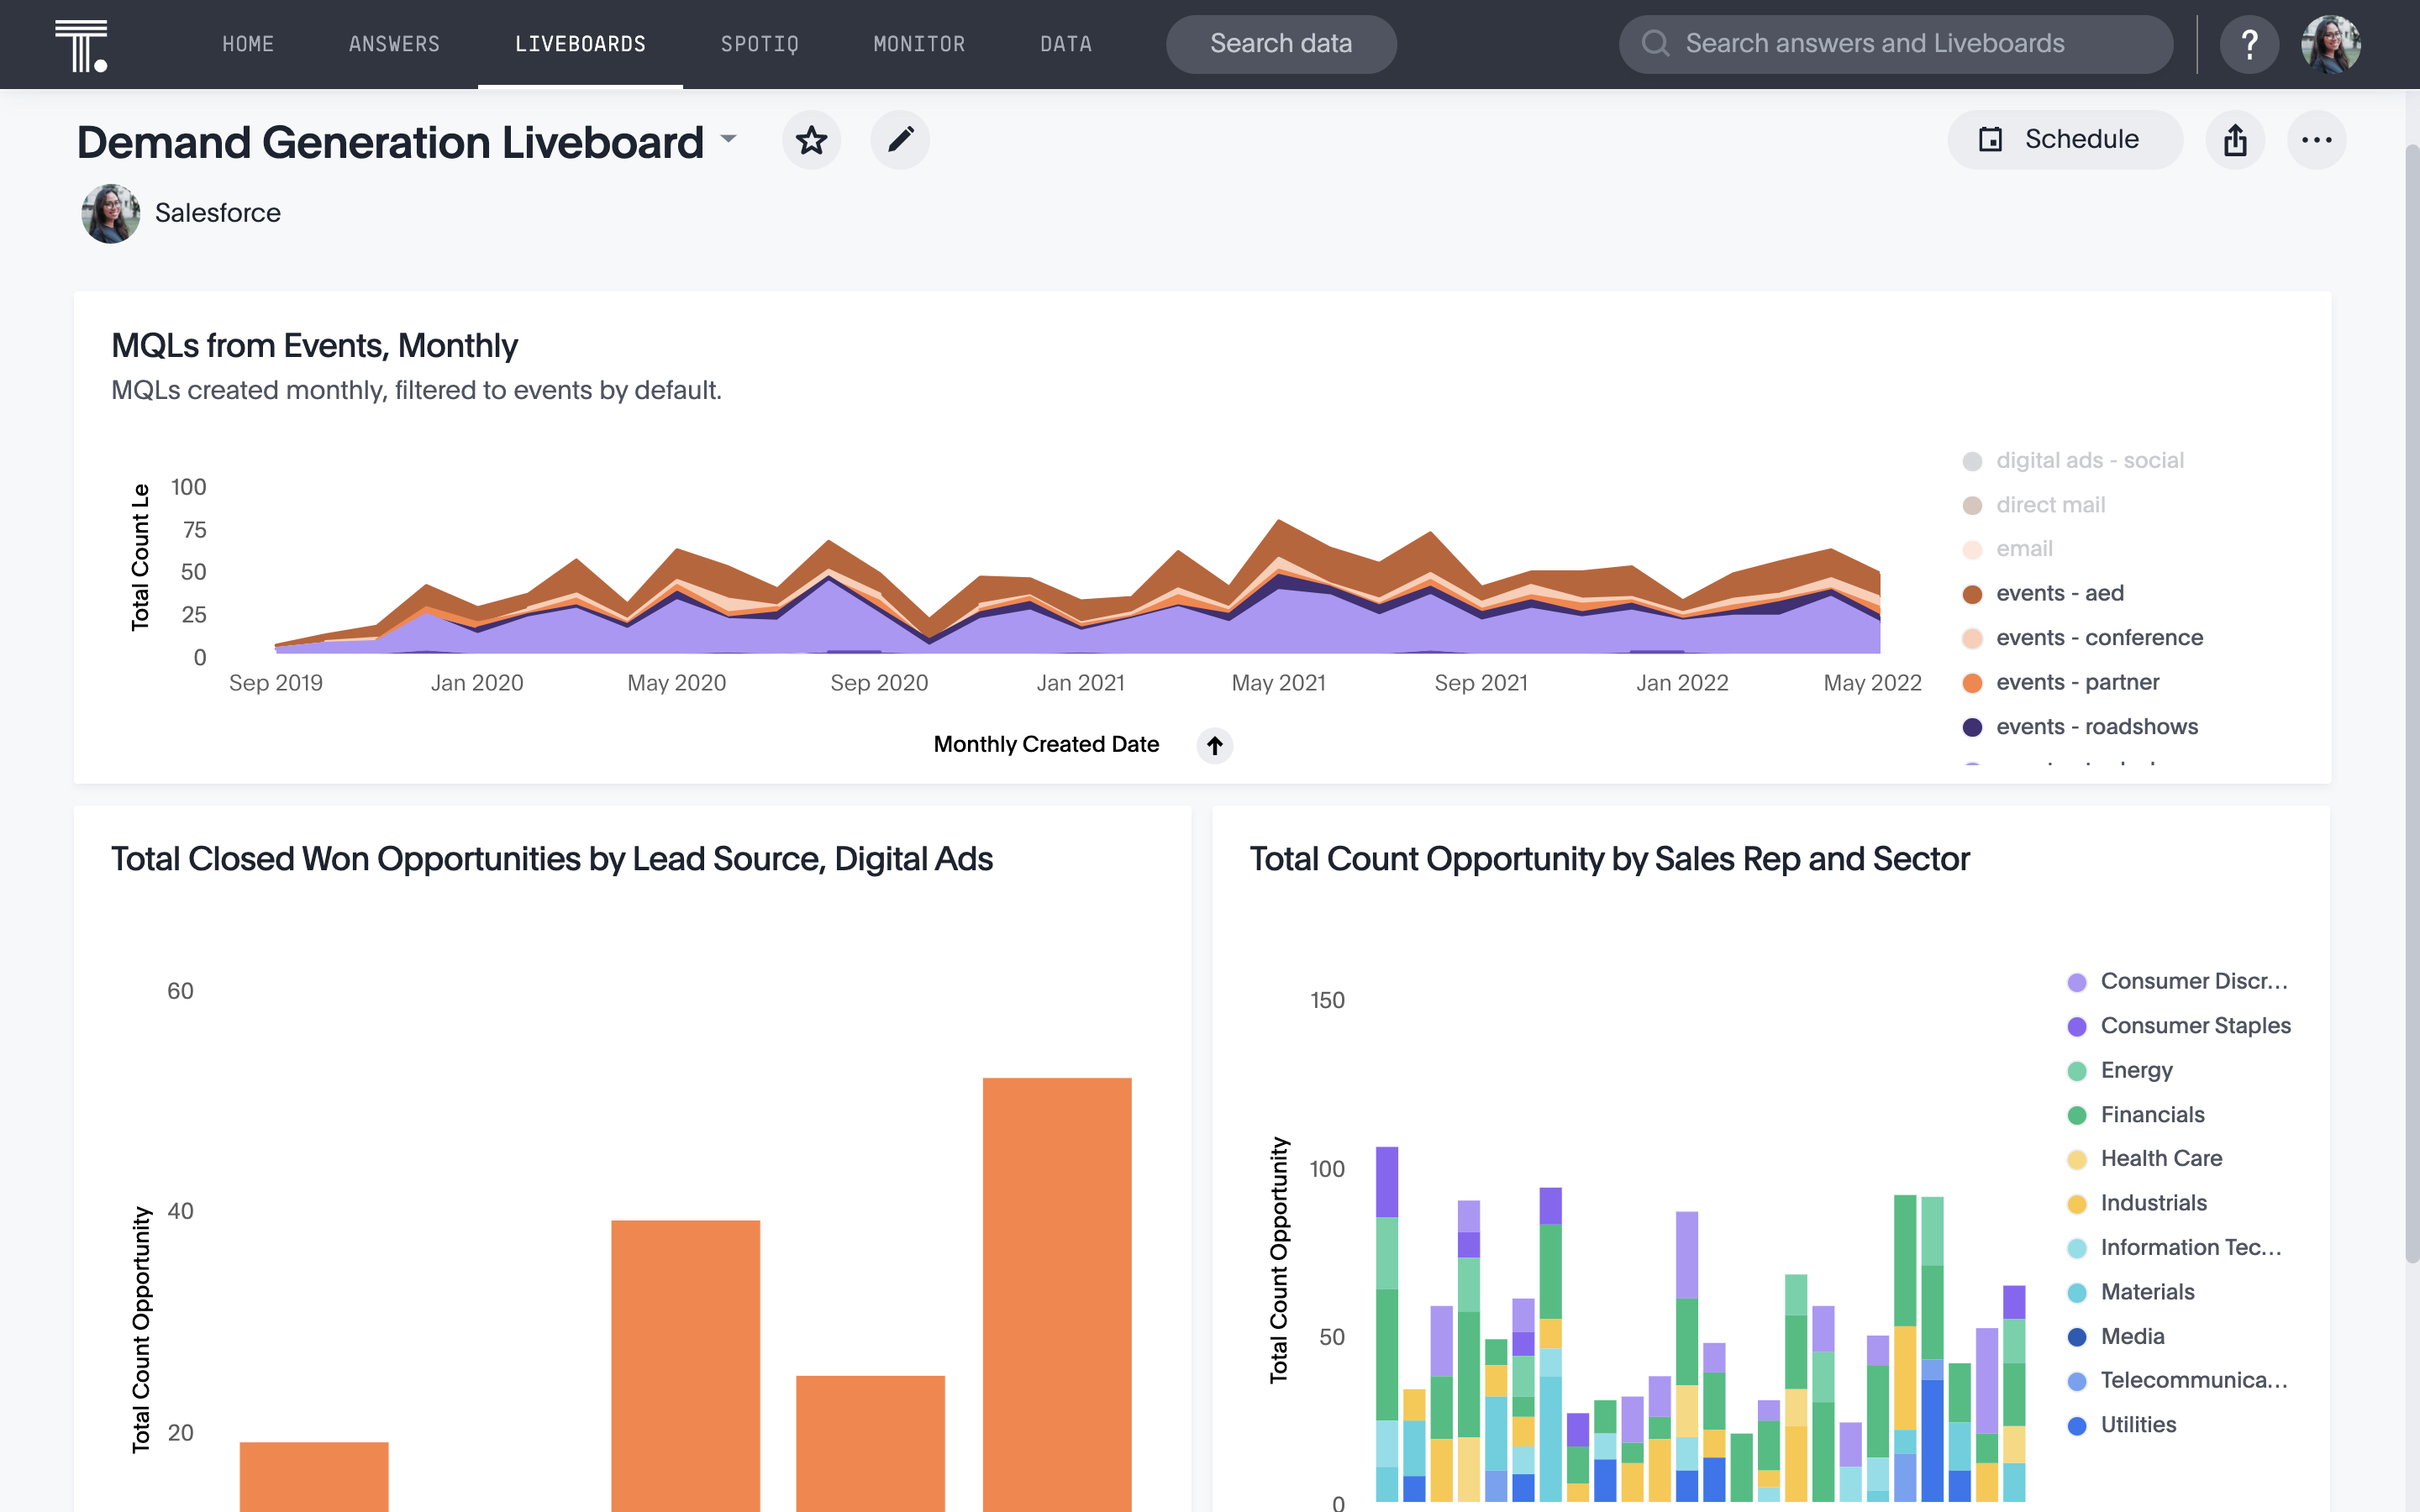
If there are any alarm bells ringing (say, if I see a major drop off in MQLs) I’ll dig into MQLs by source. This will give me a good idea of which channels I’m driving leads through, and what changes we’ve made recently that might have caused the drop.
I’ll let you in on a not-so-secret secret: that’s my favorite part of the MQL Liveboard. It’s all of my live marketing data in one place. It’s what’s happening right now, not a week ago. That makes it the easiest way to detect any errors in targeting, tracking, spend attribution… you name it. I can’t afford to wait a week to notice the pipes are broken.
There are so many ways to slice demand gen data: personas, channels, campaigns, source, and so on. For my work, I rely heavily on ThoughtSpot’s drill down capability to dig into the underlying data and can see exactly which campaigns are driving our MQLs in real-time.
I can use this level of granular insight to take immediate action, and I know I should see the results the next day.
See the data, act on the data, rinse, repeat.
2. Get a handle on pipeline generation
Of course, MQLs don’t mean anything if you’re not generating pipeline.
You really need to be checking your data every day or two to see how your ICP is engaging and changing, and which campaigns are working best in terms of conversions.
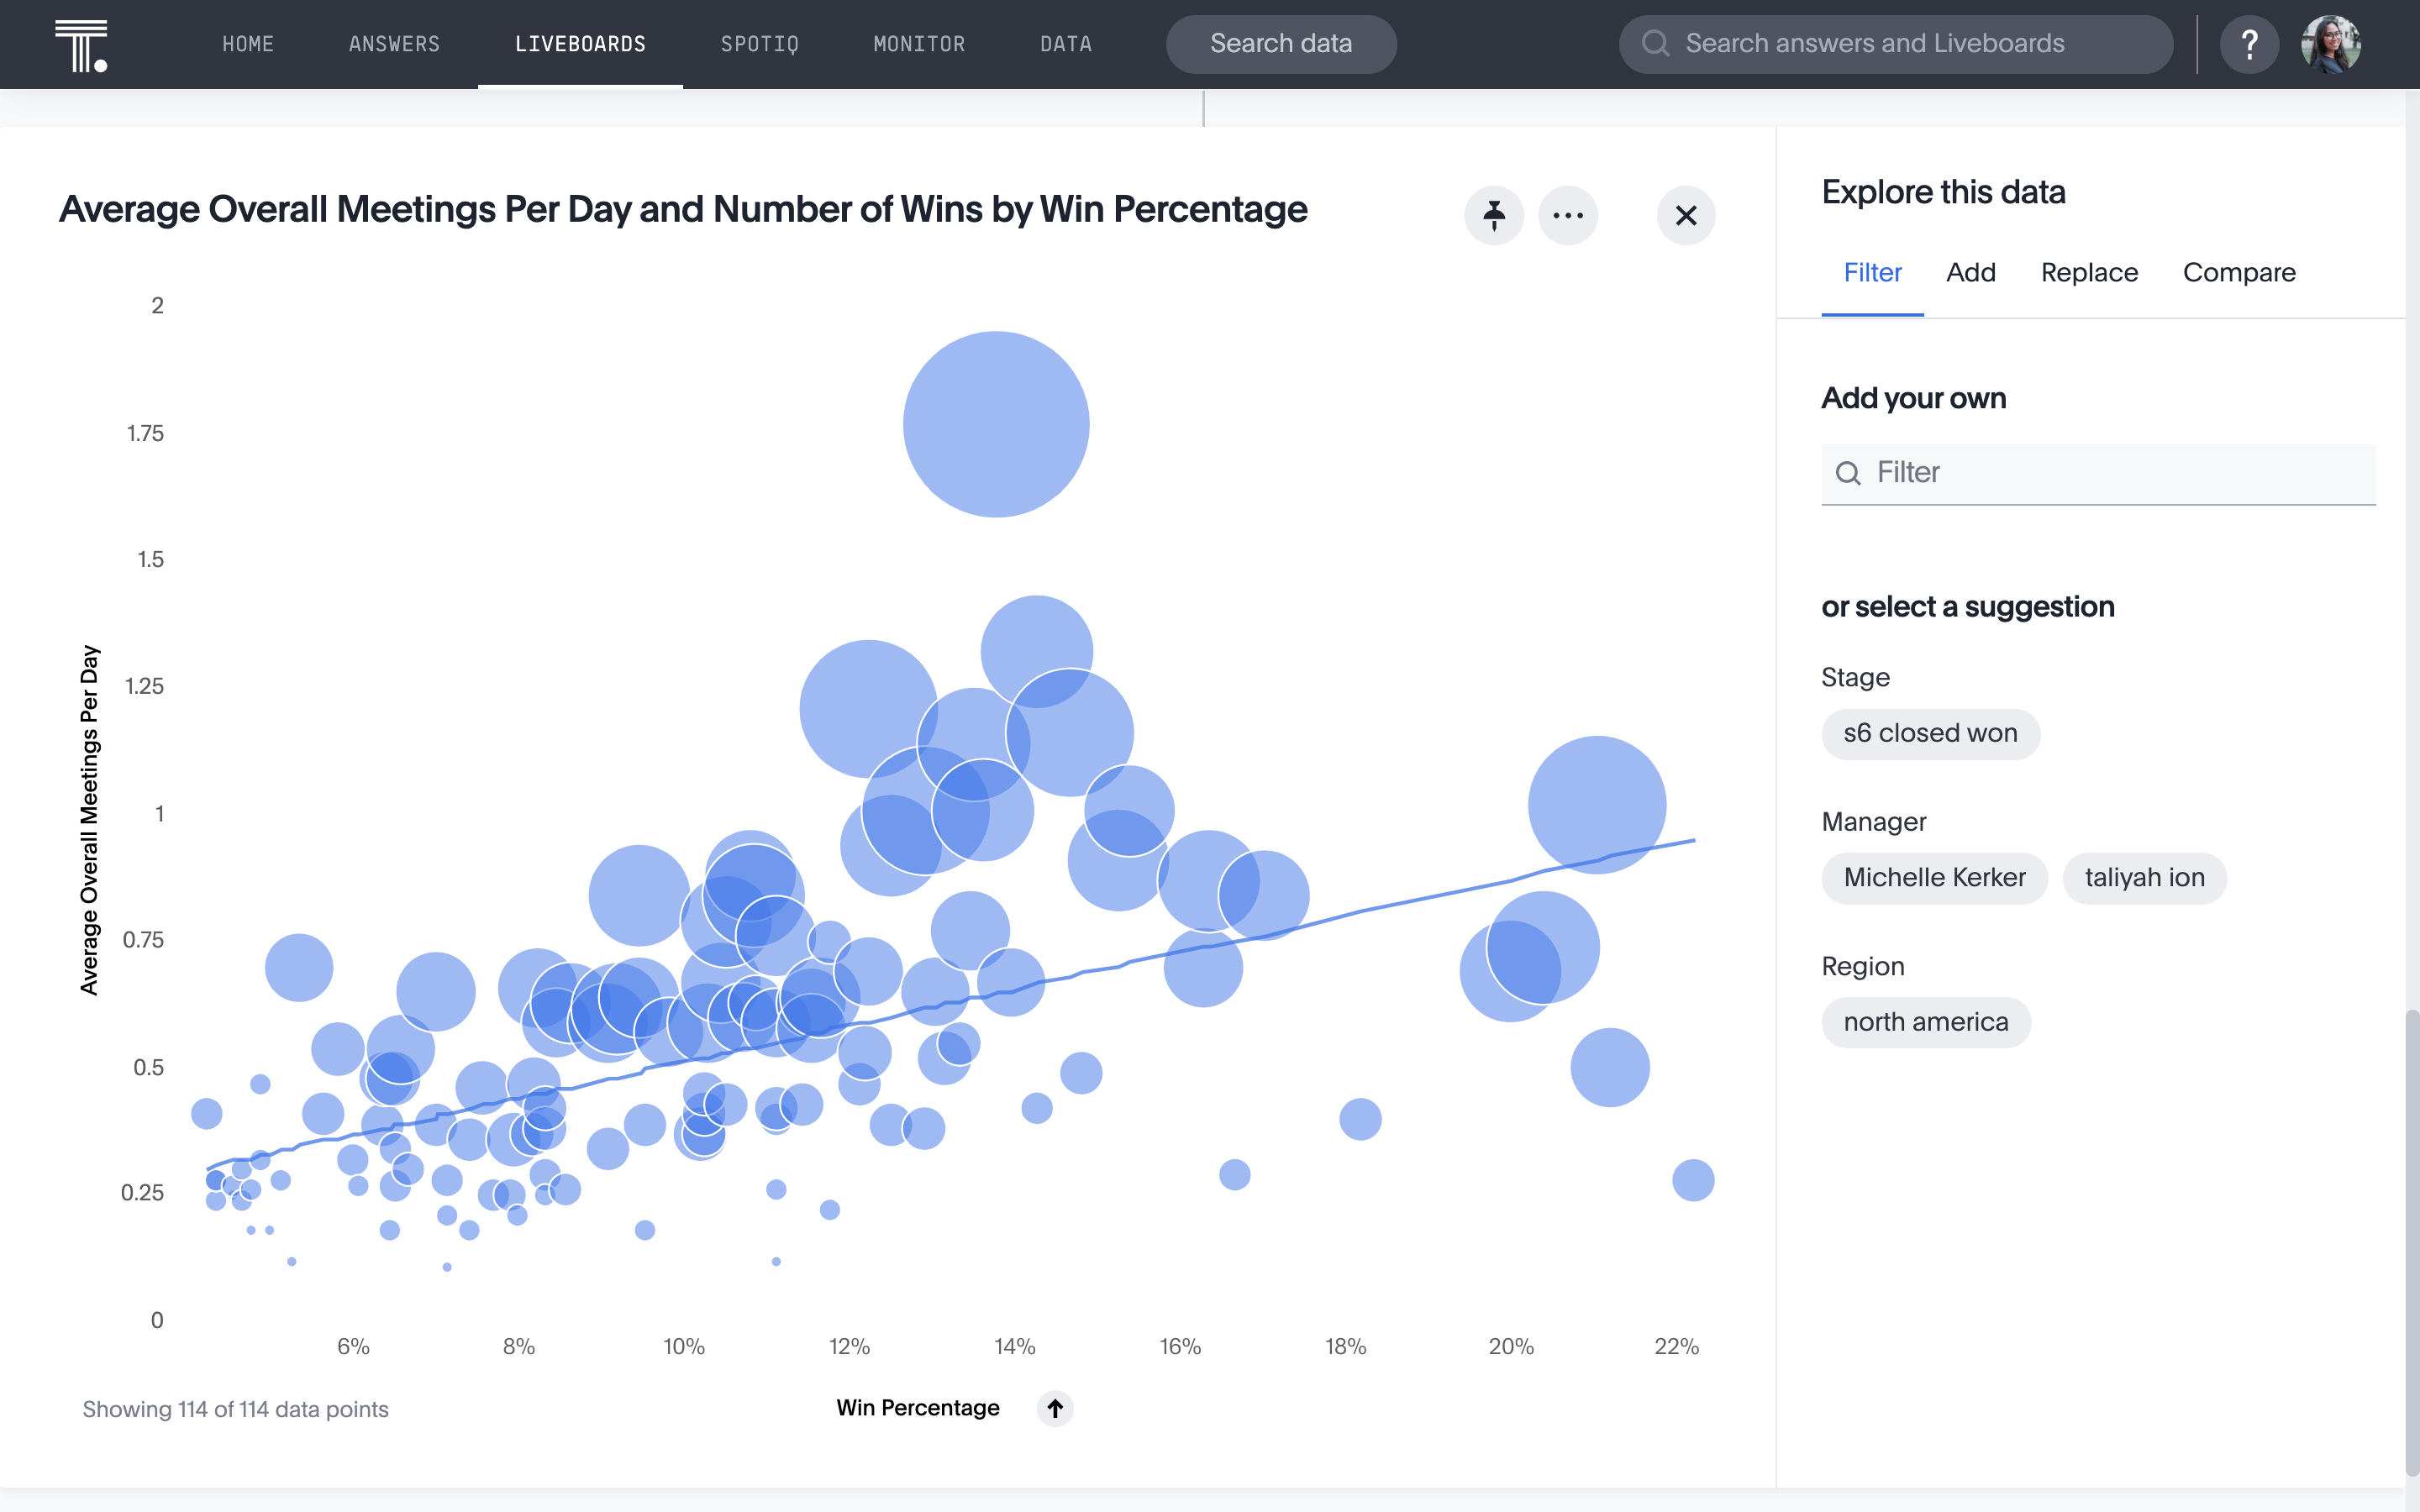
Again, drilling down into the data to find the answers is key here. I have a Liveboard that shows me which campaigns are driving the leads that convert to first meetings—and which meetings convert to qualified pipeline. Then, I can drill in even further, and check on which channels we’re running those campaigns on, and how well our campaigns are performing on each of those channels when it comes to conversion.
It’s vital to go beyond the top level vanity metrics and look at what the data is really telling you. For instance, one of our campaigns was generating more MQLs on Facebook. But when I looked a bit deeper, it turns out that even though we had fewer leads coming in via LinkedIn, they were more likely to convert to meetings.
Another key advantage of using ThoughSpot is that I don’t have to go into each channel to chase up the data. I have all the data from our social media channels, from Salesforce, from Google Analytics, from Pardot, unified right in ThoughtSpot. This is critical in today’s multi-channel marketing environment. You need to be able to track engagement and buying activity across channels, to get a comprehensive understanding of the right ways to interact with your customers.
3. Bring everyone onto the same page
Any (good) demand gen marketer will prioritize keeping the sales team in the loop. It could be check-ins with sales managers and their AEs, or it could be top-level updates for sales leaders.
With Liveboards, you can create specific insights for each sales meeting—that way you can show the rest of the revenue team self-service analytics, instead of pulling out a slide deck chock full of outdated data.
It eliminates the curiosity tax: if someone has a question, you never have to say “I’ll get back to you on that.” Instead, you can drill down into the data with them, and walk them through the numbers until everyone feels comfortable with the answer you’re giving them. That way you can focus on the metrics that matter to each specific team, not just the big picture.
The key in demand gen is to keep one eye on the most important question: What’s creating high-velocity pipeline and how can we do more of that? I curate Liveboards to different regions and segments to ensure we’re looking at the data that is relevant to each specific team. They need to know what their business looks like—and how marketing is going to make them successful.
Big picture, self-service analytics gets you a lot closer to that “sales and marketing alignment” we all strive to achieve.
For example: let’s say you see your conversion rate go down as your lead quantity up. That tells you that you’re sending too many leads to your Sales team. Better yet, it opens up the opportunity to explore the right lead volume. Together.
How?
When you’re looking at leads volume, there are three variables you can consider:
lead scoring ( how are we prioritizing our ICP?)
messaging (what are we saying?)
speed to lead (how fast are we responding?)
By running all three through ThoughtSpot, you can figure out the ideal lead volume for your business, and then test your hypotheses to make sure you’re right.
4. Double down on productive personas and campaigns
Another area where ThoughtSpot gives us a leg up is when we’ve pulled out what I call a “spaghetti bowl insight”: looking at a bunch of data but not seeing a clear story that you can respond to. With ThoughtSpot, it’s easy to take a step back and look for other ways of slicing the data until a clear pattern emerges to tell us what’s converting and what’s not. And the magic is being able to do this without an analyst.
Say a particular buyer persona is converting really well, you might decide to shift your budget in their direction. To make sure you’re optimizing spending, you’ll get into a lot of specific details first: region, persona, funnel stage, and so on. That way, you can increase the level of personalization in the content we’re offering to that target segment, and give them a better experience. Tools like Predis.ai can further enhance this personalization by automatically generating tailored ad creatives using AI. This ensures your campaigns resonate deeply with each target persona at scale.
Or, if you found that a buyer persona is reluctant to talk to your Sales team, you can instead focus our attention on engaging them in other ways, instead of just passing them on to Sales as MQLs.
After all, demand gen is all about results; it’s not a volume game.
With ThoughtSpot, you can:
Analyze campaigns by results, not just engagement
Test the impact of campaign variables
Validate big picture ideas (like ungating content or opening up a free trial)
5. Generate (and validate) new ideas with SpotIQ
Finally, we use SpotIQ to identify our blindspots.
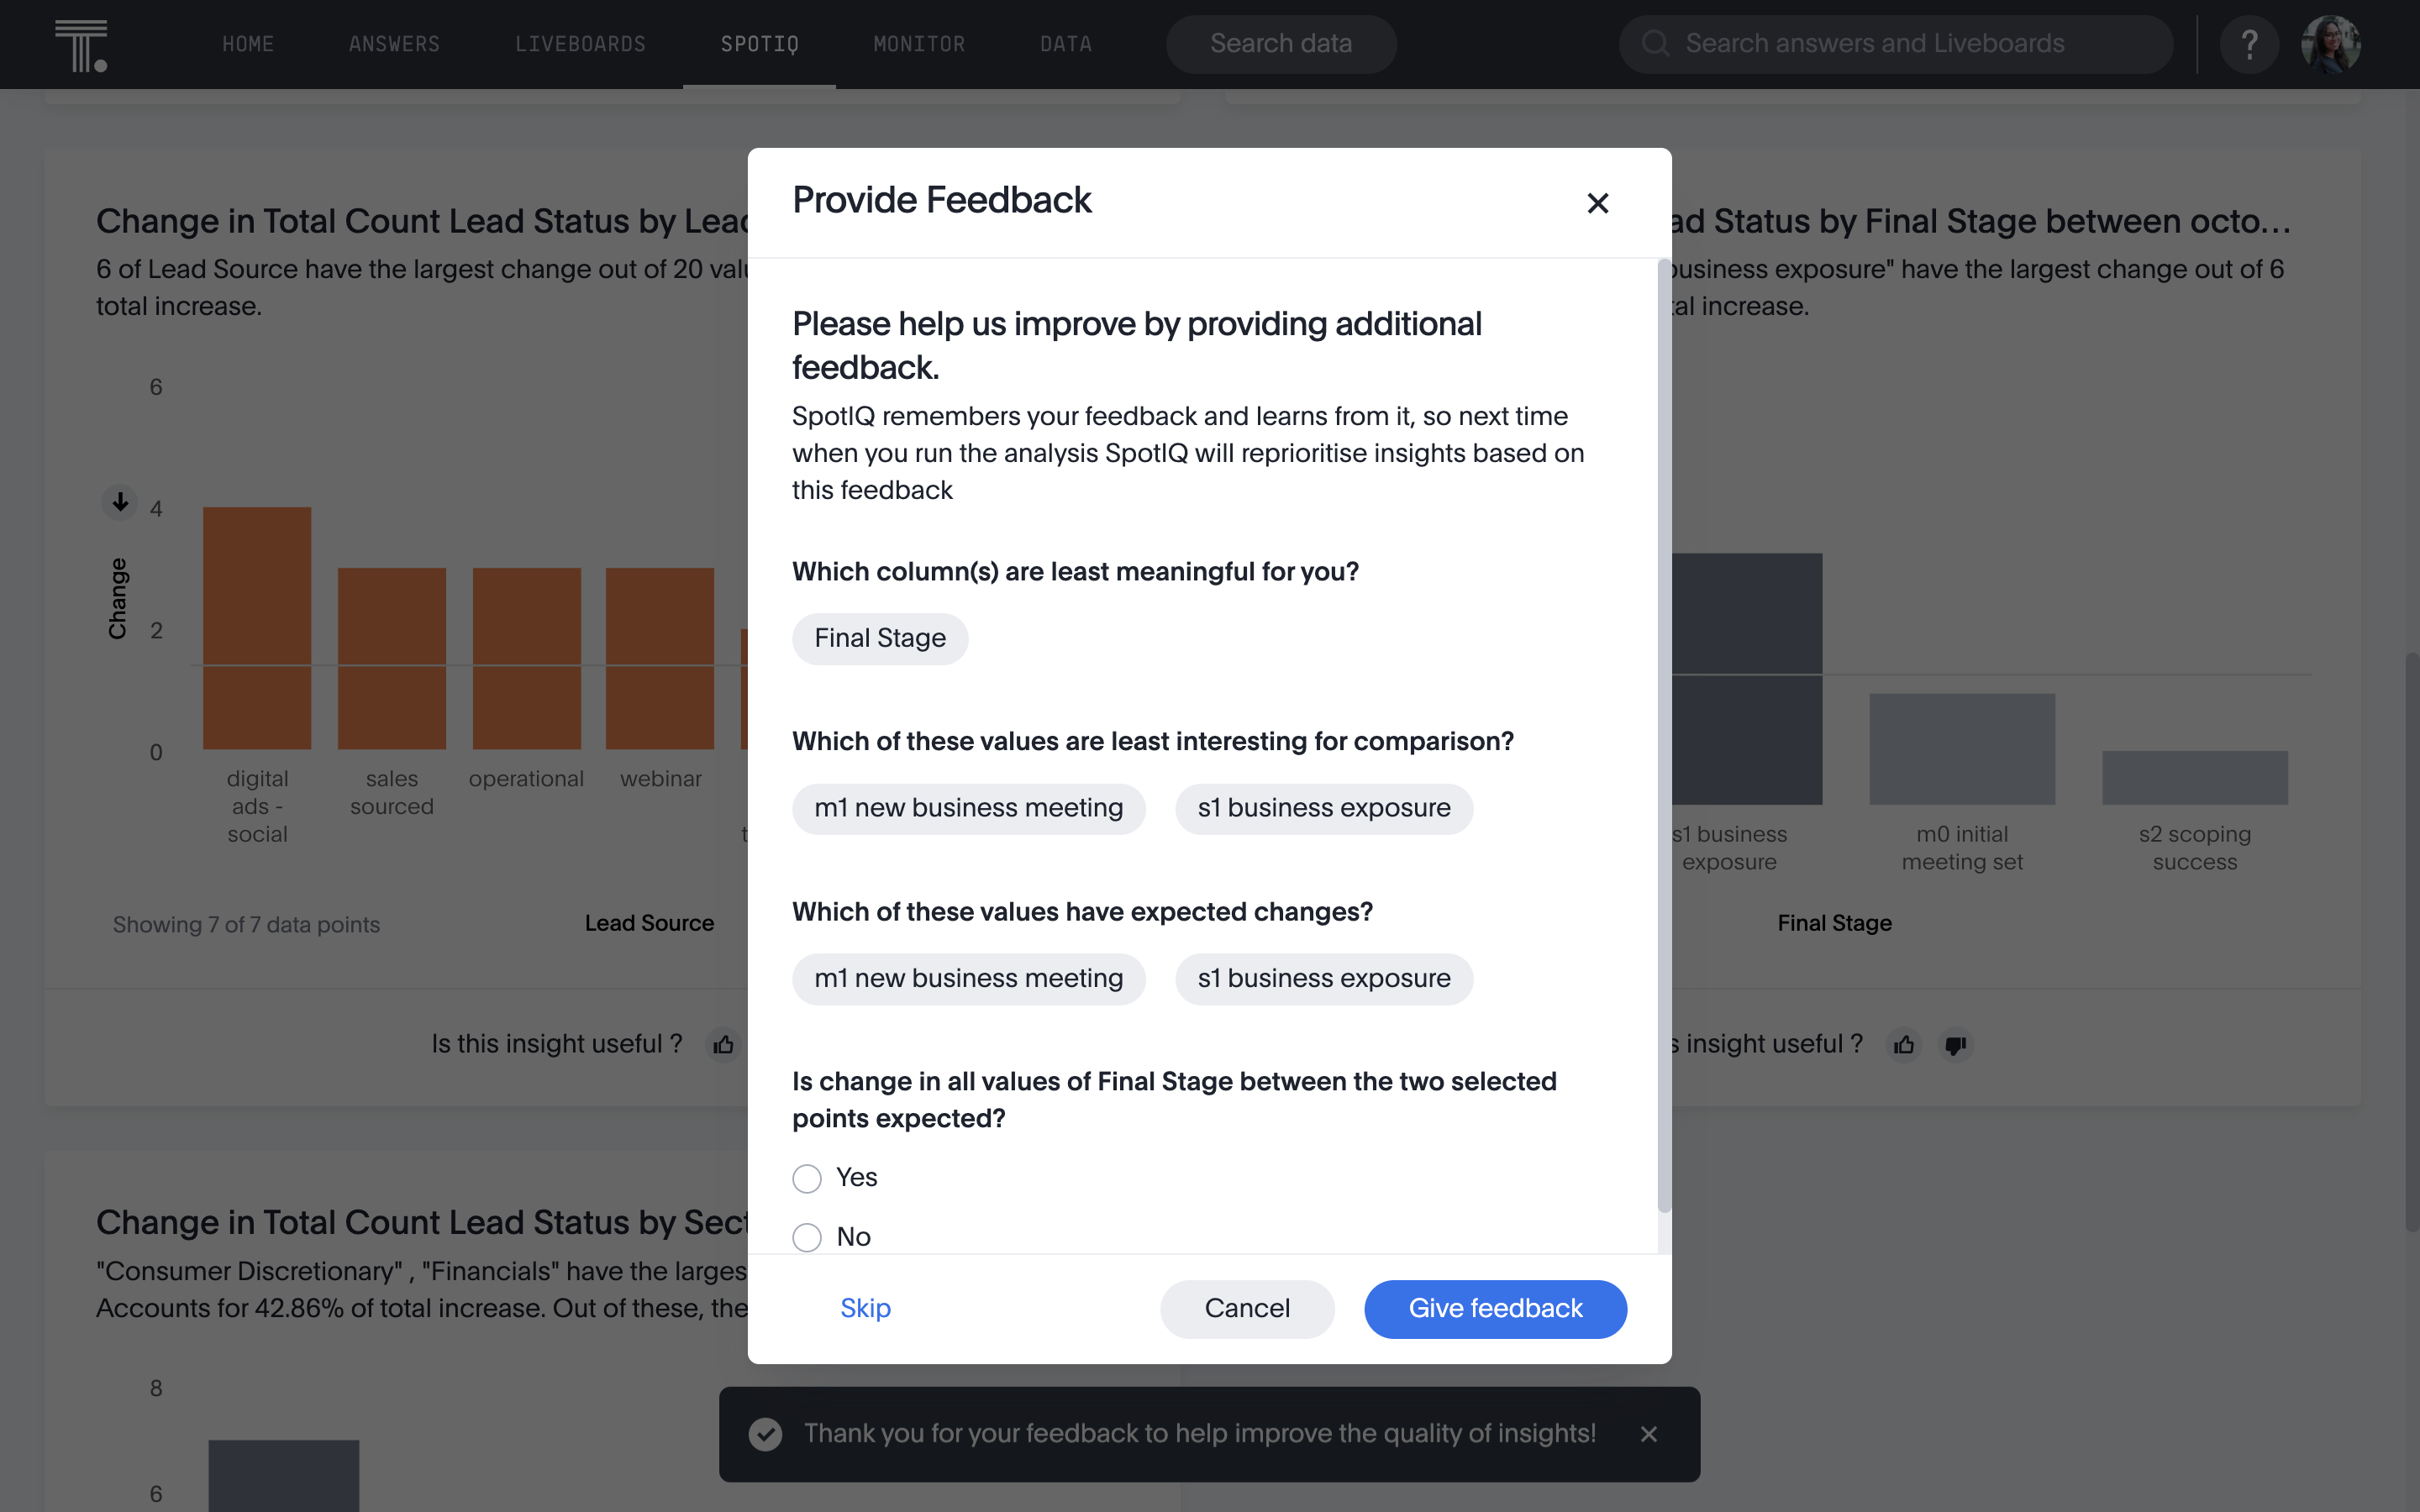
SpotIQ is an AI-driven analytics tool within ThoughtSpot, that automatically surfaces anomalies and trends in the data that we might otherwise have missed. It lets us identify patterns in noisy data—which is great in demand gen, where there’s so much data to wade through. With augmented analytics, it just does a lot of the work for you, and it’s learning every time you search. And it’s literally just one click.
(Side note: you can give SpotIQ feedback. Every result always comes with a rating button so you can give it a thumbs up or a thumbs down if it wasn’t helpful for you.)
Demand gen needs self-service analytics
ThoughtSpot changed my entire approach to measuring and acting on campaign insights. And I say that as a demand gen marketer, not a demand gen marketer for ThoughtSpot, pinky swear.
If you want to understand the causes behind the numbers so you can make better decisions, you need truly self-service analytics, with interactive Liveboards of all your data at your fingertips.
Ready to dig in for yourself? You can learn more about how marketers are using ThoughtSpot for demand generation here or sign up for a free trial.


