

Since the start of the pandemic, business demands on your IT team have skyrocketed.
You need granular, actionable insights to keep up with the speed and volume of digital transformation projects and IT incidents occurring across your organization. Canned reports from SaaS-based systems like ServiceNow aren’t fundamentally built for analytics. They don’t provide the level of granularity needed to meaningfully manage your entire IT ecosystem, which can lead to repeat incidents, wasted resources, and overspend.
With ThoughtSpot for ServiceNow Analytics, you can drill down into all your IT data and surface granular, actionable insights to increase operational efficiencies across even the most complex IT environments. Read on for the four powerful ways to get started.
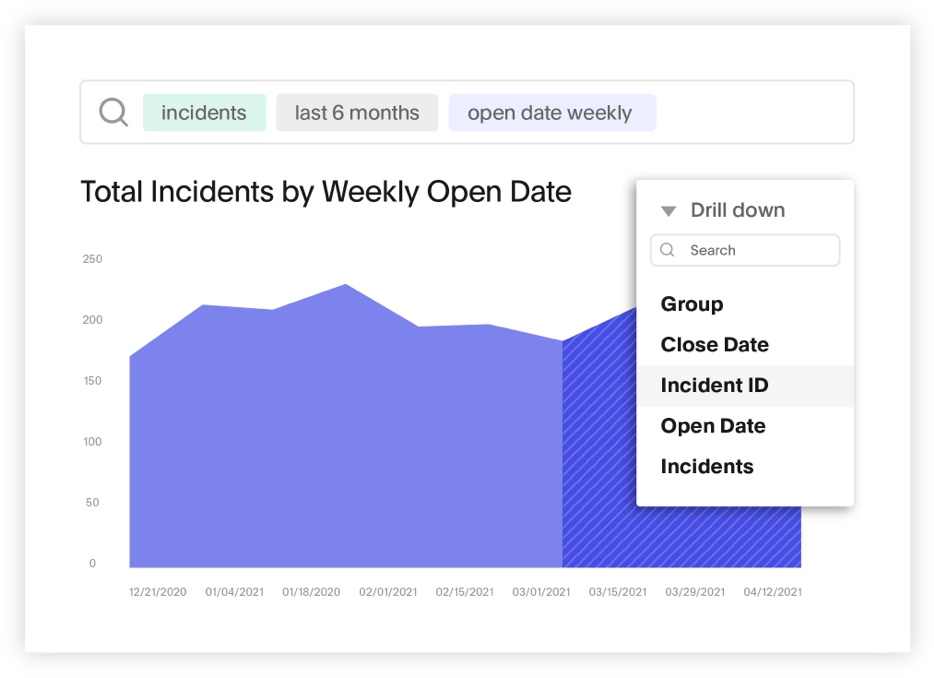
1. Pinpoint the root cause of critical incidents
When major system failures or outages occur, you need to get to the root cause — quickly. Instead of relying on inflexible reports to extrapolate a solution, you can resolve incidents in record time by surfacing granular incident-related insights using natural language search.
You can then power workflows by pushing data back into productivity apps like Slack and Google Sheets to operationalize your insights, and share your findings using interactive pinboards to keep your business humming. Learn more about incident management with ThoughtSpot for ServiceNow Analytics.
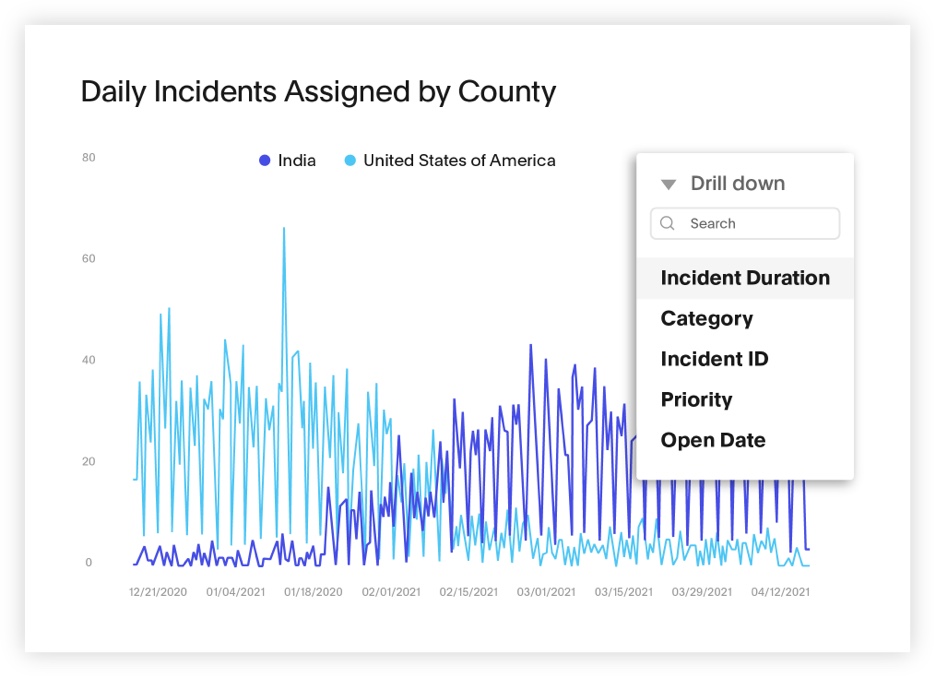
2. Spot anomalies across all of your endpoints
If you can’t see a problem, you can’t manage it. And you certainly can’t stop it from growing into a system-wide issue that affects the entire organization. You need all of your IT data in one place, but bringing multiple data sources into ServiceNow is complicated at best.

With ThoughtSpot, you can easily connect to popular data clouds like Snowflake and Databricks for a 360-degree view of your IT efforts. This allows you to query data from multiple sources, explore trends across all of your productivity applications, and make sense of millions of events as they’re occurring from a single, intuitive interface. When you see something out of the ordinary, you can easily drill down for deeper insight into what’s driving trends. You can also use pre-built pinboards to create a shareable, 360-degree view of key metrics and application issues across teams and departments or build your own in just a few clicks. Learn more about problem management with ThoughtSpot for ServiceNow Analytics.
3. Deliver IT projects on time and on budget
Nothing kills stakeholder trust faster than failing to meet deadlines or budget expectations for critical IT projects. As a change manager, you can’t afford to be at arm’s length from your technology rollouts. You need to know exactly what’s happening, when, and how to get ahead of project blockers and beat performance baselines.
With ThoughtSpot, you can track the progress of your most important IT projects by adding key metrics (e.g. significant hardware or network events) to your homepage watchlist. You can also catalogue your insights to make them easily discoverable by IT team members and stakeholders with search answers. When progress against particular metrics change, ThoughtSpot will send an alert so you can quickly remove bottlenecks and report status updates. Learn more about change management with ThoughtSpot for ServiceNow Analytics.
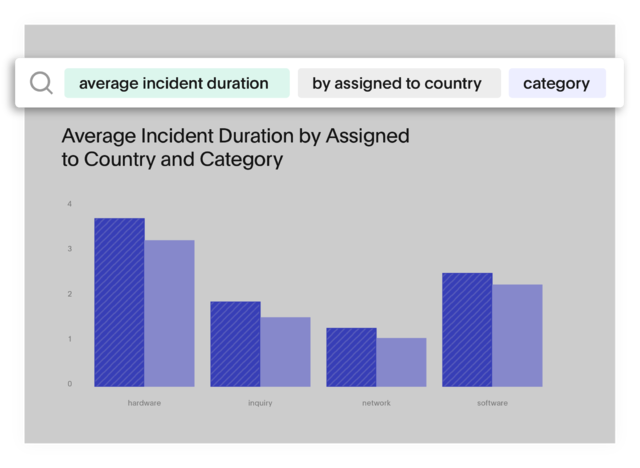
4. Align spend with business initiatives
Understanding where your team spends the most money and energy is a valuable skill for any IT leader. It’s also a prerequisite for properly aligning IT efforts to business needs. Unfortunately, static dashboards don’t make integrating personnel data or asking questions outside of pre-defined drill paths easy. But with ThoughtSpot, you can achieve both of those things and more.
Simply connect to your favorite data cloud to create a 360-degree view of all your IT efforts in the context of the rest of the business. Then, instantly surface granular insights on every IT dollar spent with natural language search. Want to dig deeper into a resourcing question? You can flexibly explore your IT data without predefined drill paths and use SpotIQ’s anomaly-detection algorithms to determine the best use of IT resources across multiple business initiatives. And with pinboards providing a live look at all of your data, you no longer have to worry about spending hours rebuilding PowerPoint visualizations to keep stakeholders in the loop. Learn more about cost management with ThoughtSpot for ServiceNow Analytics.
See your IT data in action
Sign up for a free trial of ThoughtSpot to get the most out of your ServiceNow data today.


