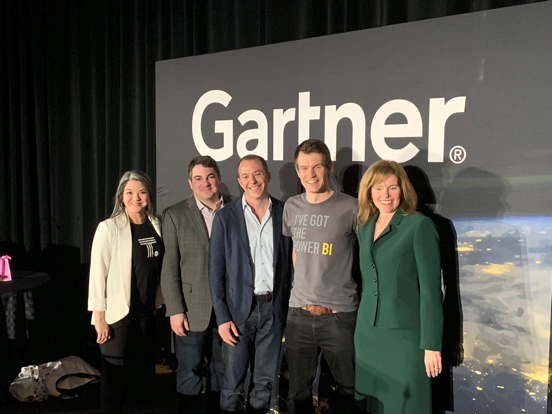
Last week, ThoughtSpot participated in the 5th annual BI Bake Off at the Gartner Data and Analytics Conference in Orlando. Like years past, Gartner selected 4 vendors to demo their products side-by-side in a controlled setting based on a prescribed use case. This year, Gartner shook up the lineup and included ThoughtSpot to showcase a disruptive approach in serving the market.
I’ve been a huge fan of the BI bake off. Having attended previous bake offs as an audience member, I knew full well that this is one of the most intense and entertaining sessions at the event. I mean, who wouldn’t want to demo next to larger, more established vendors like Microsoft, Tableau, and Qlik - live, and in front of 800 people? For me, this was an opportunity that neither ThoughtSpot nor I could pass up. Challenge accepted!
A Greater Purpose for Data
I spend my days helping customers improve their analytics capabilities to drive their business forward. While it’s gratifying to see my customers succeed, nothing inspires me more than using data for a greater purpose - to make a positive impact on society.
That’s why this year’s bake off topic was especially intriguing. We were asked to assess the impact of technology on loneliness, happiness, and our overall mental well-being. To do this, we used data from the Kaiser Family Foundation and the Economist’s survey on loneliness, and the Gartner’s Consumer Values Survey data.
So what did we find?
The Harsh Realities of Loneliness
Is loneliness a problem? What are the factors that influence loneliness or happiness? Let’s dive into the data to answer these questions.
The survey data from the Kaiser Family Foundation consisted of responses from the United States, the United Kingdom, and Japan. An obvious first question would be to ask “What is the loneliest country in the world?”. In our personal lives, we would just ask Google. ThoughtSpot is built upon that same premise, making it easy for you to ask that question in natural language.
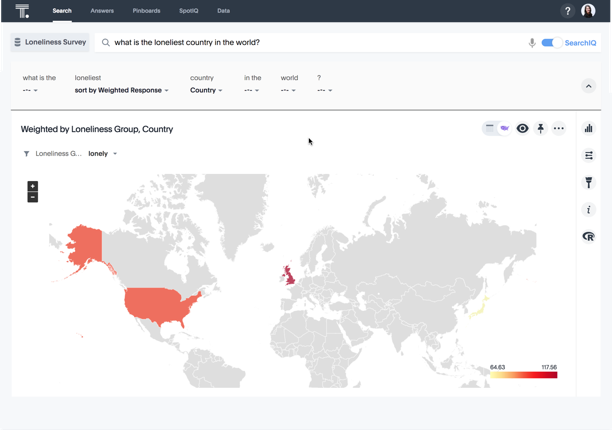
Based on the survey responses, The United Kingdom is shown to be the loneliest country in the world. And while the search seems simple, there’s actually a lot going on. ThoughtSpot understood your question, including the superlative “loneliest”, ignored filler words, and generated a best fit data visualization design in the form of a geo map.
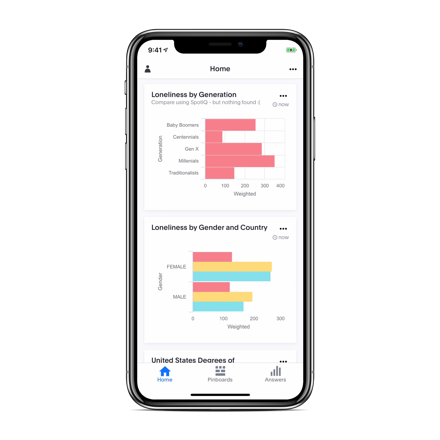
But there’s never just one question you want to ask of your data. What if I wanted to know about loneliness by different age groups? Since ThoughtSpot enables me to continuously drill down, I can ask follow up questions on the fly, instantly get answers, and add them to a pinboard. There’s no tax on my curiosity, as ThoughtSpot lets you answer that all important NEXT question with ease.
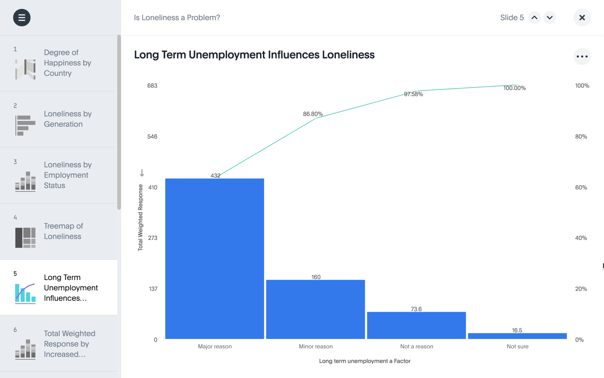
Once I’ve made my pinboard, we find that people age 80-97 are surprisingly not the loneliest cohort. In fact, millennials turn out to be the loneliest bunch. We also see that long term unemployment is a major contributing factor to loneliness.
If I ever need to go back to my pinboard, I can go to the home page and see what questions are trending or recently viewed so I don’t have to sort through folders or lists. ThoughtSpot knows me, and what I need to see.
But there are so many more possible questions you can ask of this data - why not let ThoughtSpot’s SpotIQ AI engine do it for you? The system automatically asks thousands of questions, and uses AI to return relevant answers. Pinboard Insights are available on each dashboard to identify anomalies and trends that you may not have spotted.
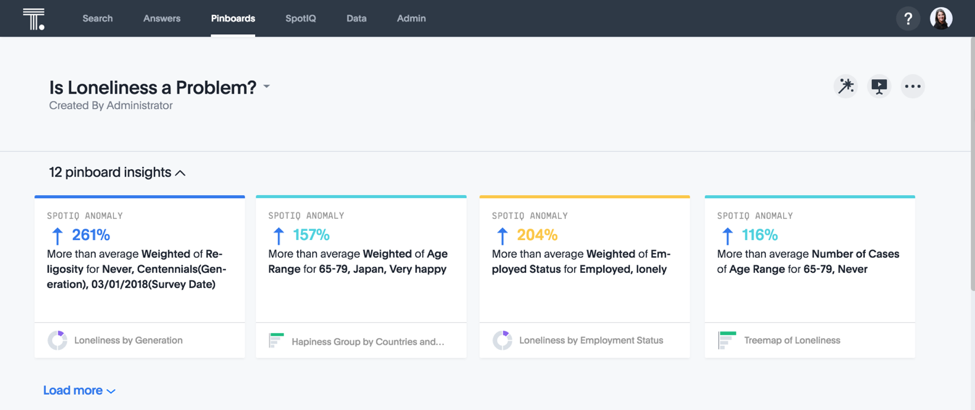
SpotIQ discovered that nonreligious centennials (born after 1997) reported being lonely, 65-79 year olds from Japan are happier than the respondents of other age ranges, and that while long term unemployment contributes to loneliness, a significant number of respondents that were employed reported being lonely.
Millennials: Socially Independent, or Lonely?
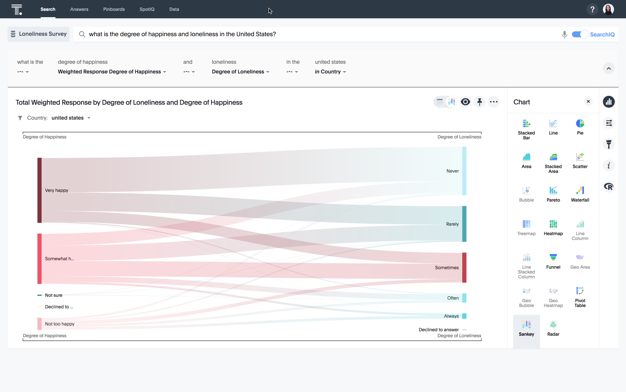
Let’s take a closer look at loneliness and happiness in the United States. “What is the degree of happiness and loneliness in the United States“? During the bake off, I asked this question with just my voice, and ThoughtSpot’s SearchIQ parsed my voice, and calculated an analytical answer.
I can even do a comparison by asking “How lonely are American baby boomers versus millennials?” ThoughtSpot recognizes that the term “American” is mapped to the “United States”. As it turns out, American millennials are 54% lonelier than baby boomers.
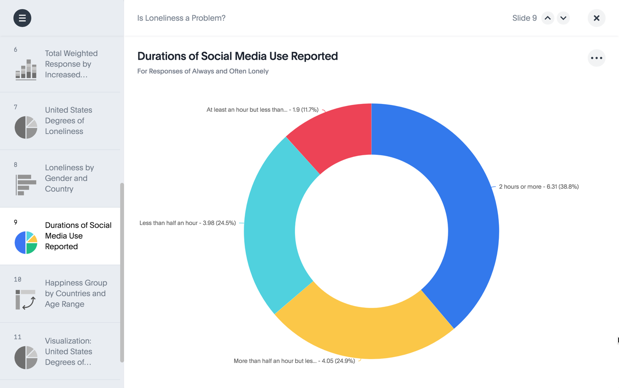
But why? By asking another question on technology impact, we see that the self-reported, lonely, Millennials believe that increase in technology usage is a major contributing factor for them.
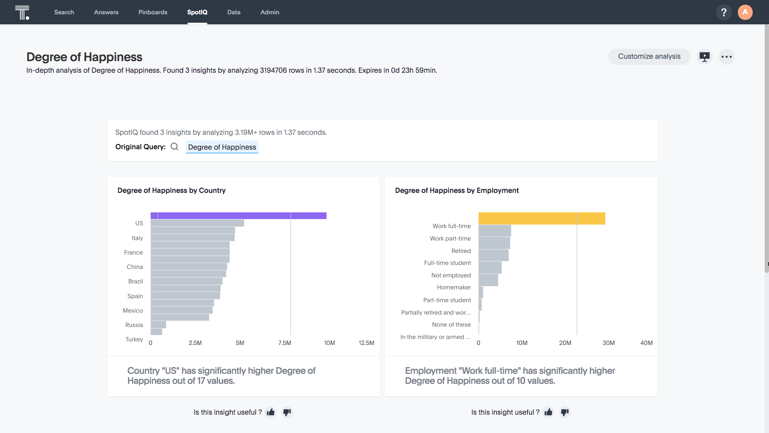
My curiosity led us to run SpotIQ on 8 years’ worth of Gartner Customer Values survey data. This meant I could work with a larger, richer data set to uncover deeper insights to understand the contributing factors to happiness and well-being across generations.
Luckily, SpotIQ can handle large data volumes at scale and with ease. In a few seconds, it analyzed over 3 million rows to generate new insights by top zip codes, country, and employment statuses. SpotIQ understands your usage behavior and uses crowd-sourcing to generate insights that are most relevant to you. Insights are generated in natural language. You can also thumb up insights you like, thumb down those you don’t to make the system smarter for everyone.
Adding all this content to my pinboard, I was ready to go. I didn’t even have to download my slides to tell my story - I could present the information live within ThoughtSpot.
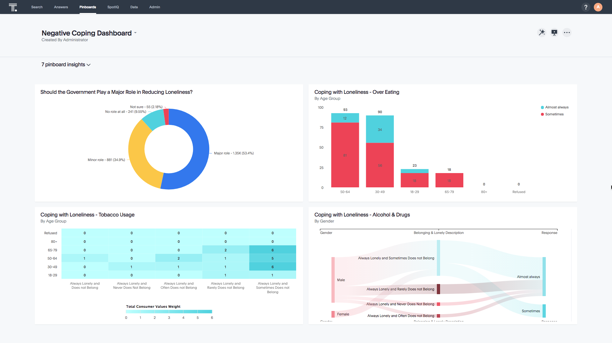
Coping with Loneliness
How do people cope with their loneliness? Overeating, smoking, and alcohol and drugs seemed to be common coping methods for loneliness. The analysis also showed that there were significantly more men that turned to alcohol and drugs versus women. And more than half of the survey respondents believe that the government should play a larger role in reducing loneliness.
To raise awareness and address these concerns around coping mechanisms, I may wish to share the findings more broadly. I can download a PDF, I can schedule a report to be sent out, and I can even set up gating conditions to trigger these reports. But there are more modern ways to share content these days. When I’m on the go, I can access all my content via a mobile device and also share via text or email. I can even share this on a Slack channel and collaborate with other users.
How did we bring all this data together?
Survey data is inherently messy. Once it's in ThoughtSpot you can immediately start searching, but without a little prep, the data won’t be easy to understand. In ThoughtSpot, I can model the data for search by changing column names, adding synonyms, and controlling how the data is used. I can define join types on relationships between the data sets.
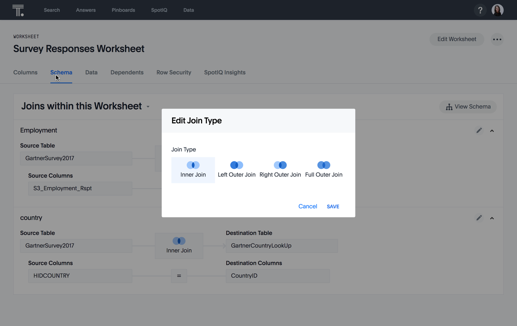
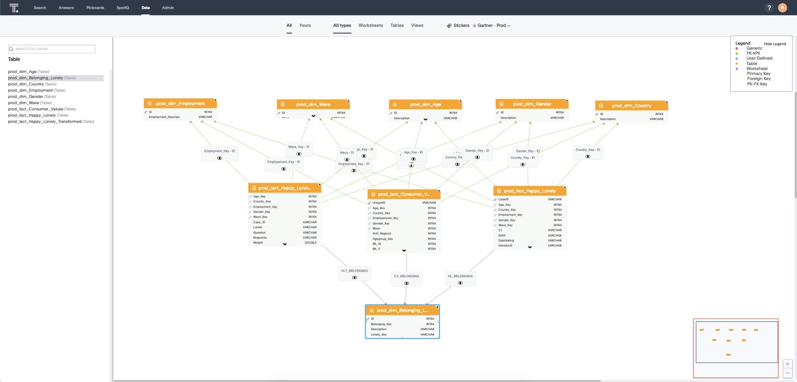
I can also create Worksheets, or reusable logical data models, where you can combine tables into one view, add calculations and custom groupings, and tailor the experience for end users. Once completed, the loneliness and Gartner customer values survey data are combined in a complex schema with a few conformed dimensions.
One more thing, or two
As an SE, I consult and demo for a living. There is nothing riskier than pushing the limits of your product while demoing live. So to close out the bake off, I decided to kick it up a notch and show off ThoughtSpot’s ability to deliver speed at scale. I switched over to another ThoughtSpot environment and asked a question on 50 billion rows of transaction level retail data across 2,500 products over 5 years.
The query returned in under 10 seconds.
Yes, that’s right - 50 billion rows in under 10 seconds! No pre-aggregations required. At ThoughtSpot, we don’t fake speed at scale.
We’re also extending our platform to provide an analytic service similar to what you may experience with Amazon Alexa or Google Home. We call this the ThoughtSpot Assistant and we previewed it at the bake off. The reason we are building our own device is that businesses don’t want to have their content and questions streamed openly in the public domain. With the ThoughtSpot Assistant, businesses can ask their questions securely in their board rooms within their own network.
ThoughtSpot is Different in Every Way
And there you have it! From search, to AI-driven insights, to speed at scale, I demonstrated a completely different approach to analytics. For those of you in the audience, I hope you learned something more about ThoughtSpot. More importantly though, I hope this event helped raise awareness of the growing problems of loneliness and social isolation so that we can help find ways to address them. And so I leave you with the following:
"If you wish to overcome that feeling of isolation and loneliness, I think that your underlying attitude makes a tremendous difference. And approaching others with the thought of compassion in your mind is the best way to do this.” - Dalai Lama
The Happiest Place on Earth
On behalf of ThoughtSpot, I’d like to thank Gartner for the opportunity to participate in this year’s bake off. It was an enormous amount of work, but I had a blast, and made a lot of friends along the way. And Cindi’s cookies were delish! As for me, after an intense bake off and a week-long event jam-packed with customer meetings in Orlando, I'm going to Disneyland with the fam!