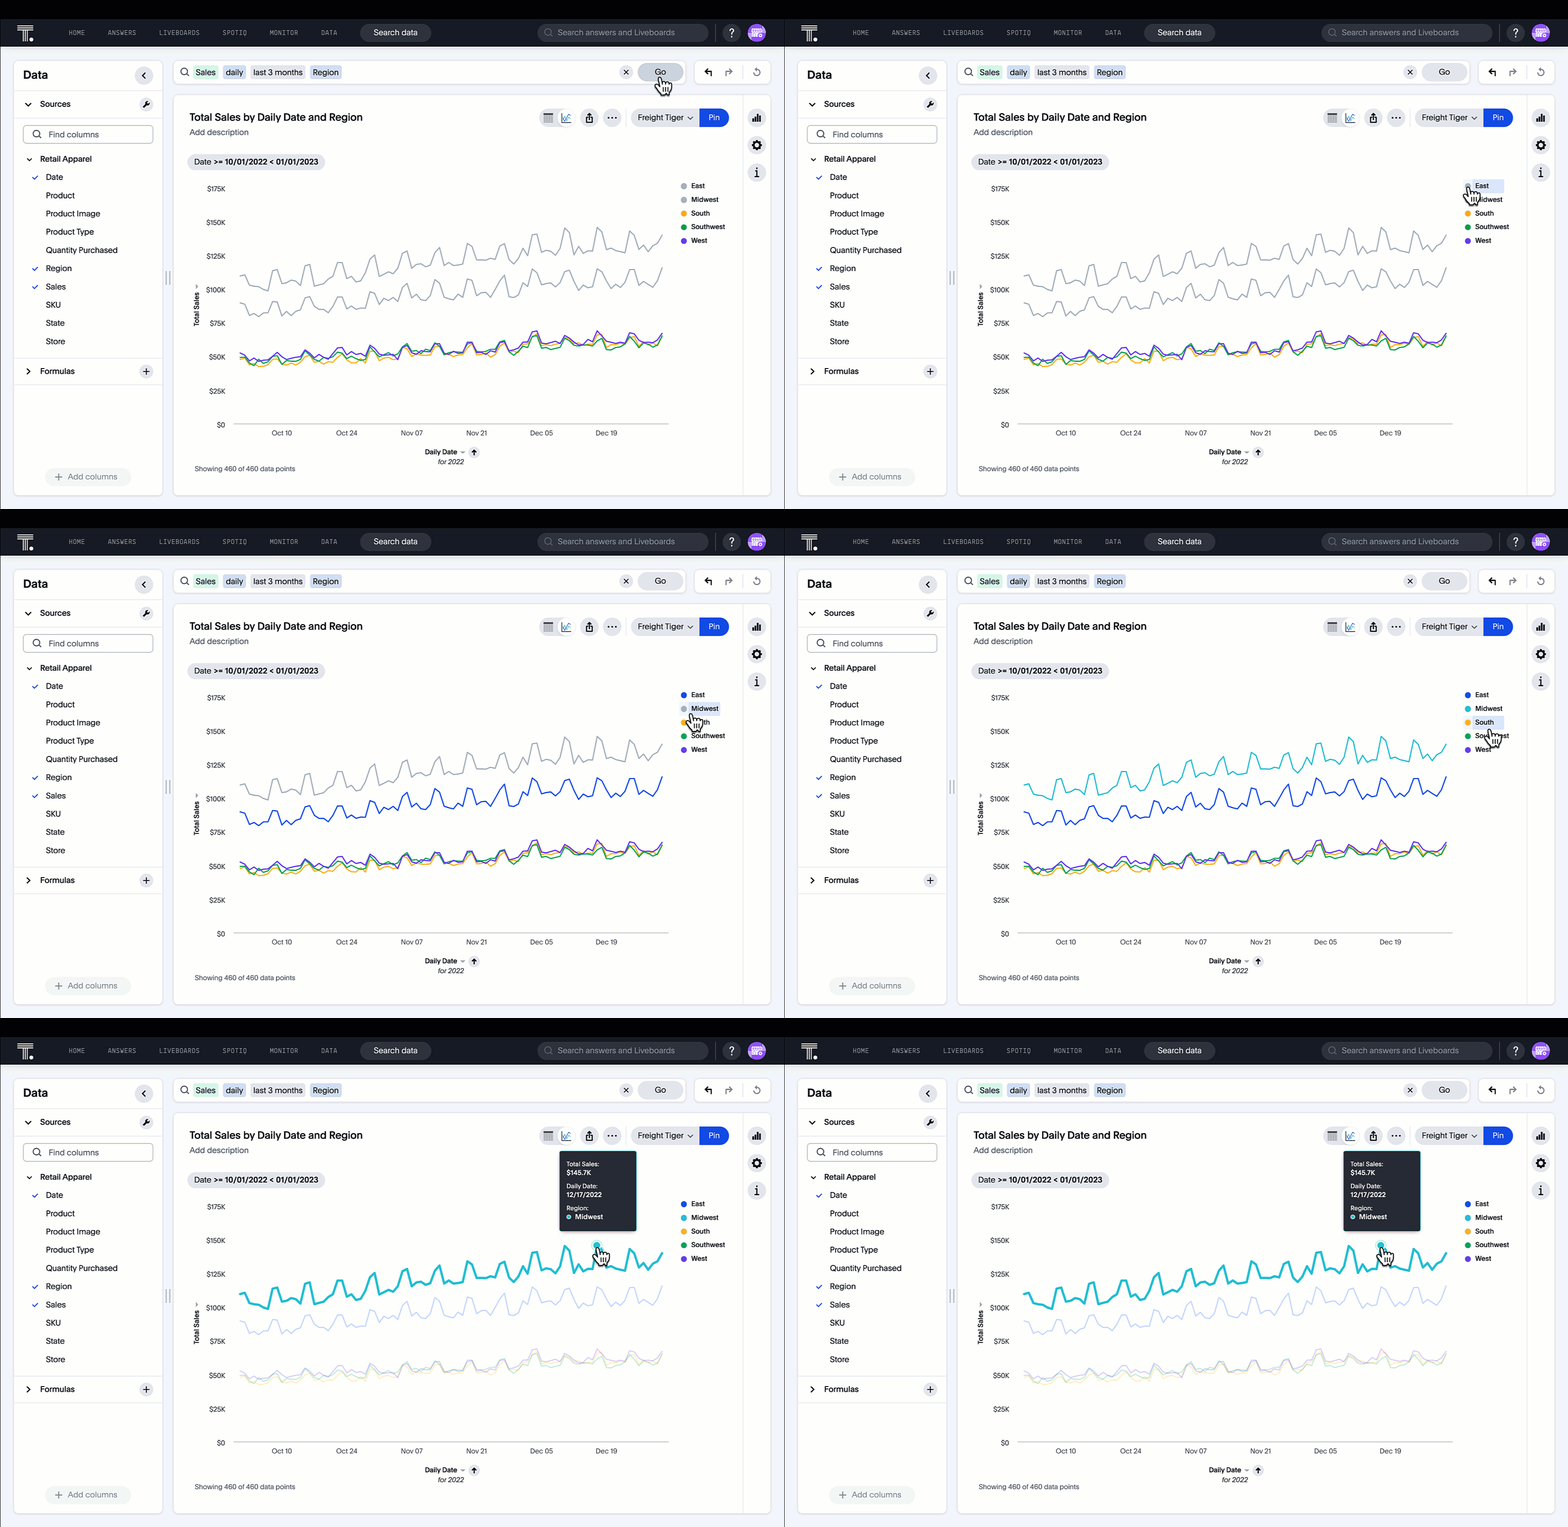
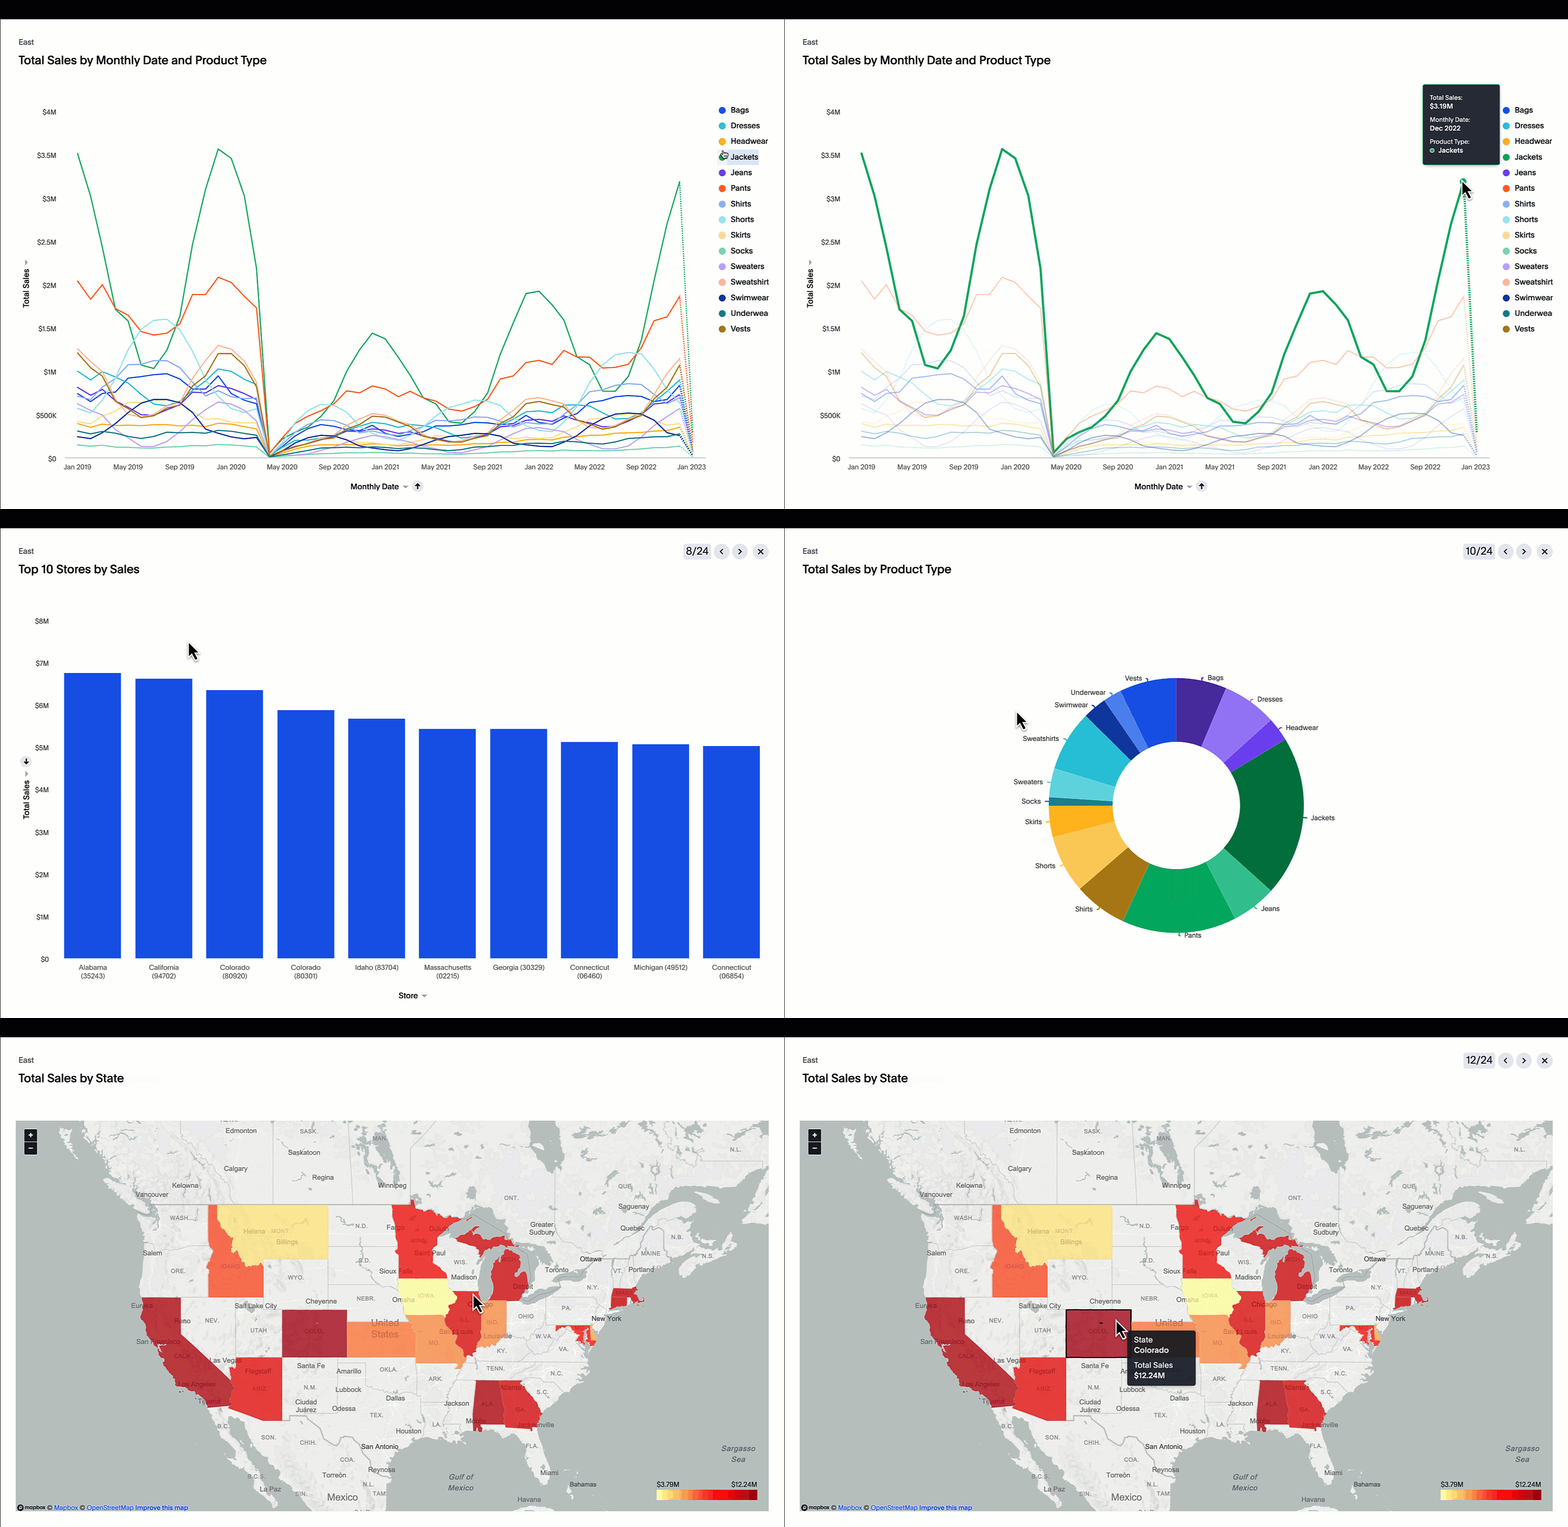
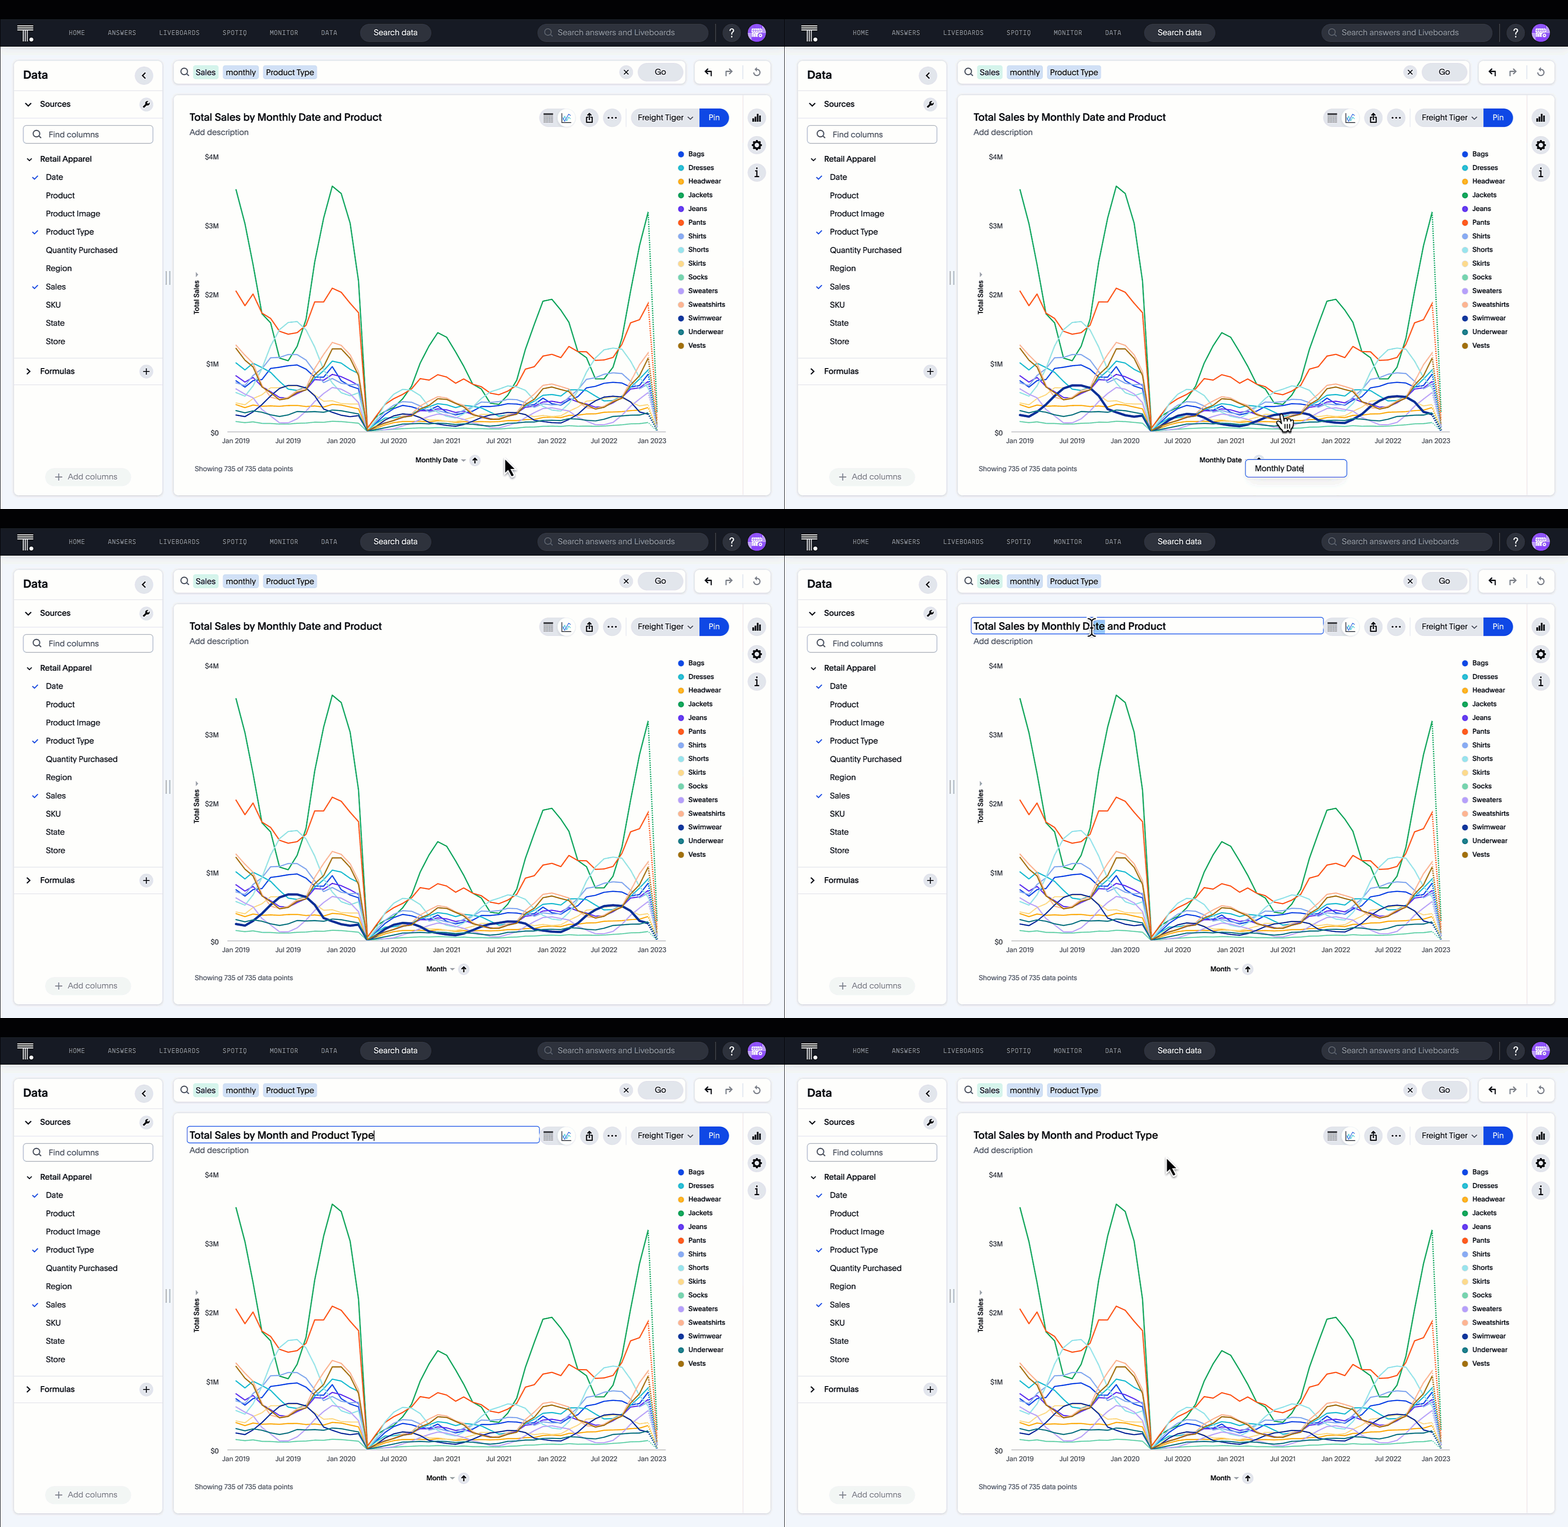
Visualizing data is an important aspect of presenting insights clearly. But it's not always easy to create an effective visualization that people will understand on their first glance, or even second. So how do you create the kinds of graphs and tables that leave key stakeholders thinking, "Wow! I need this information!"
In this post, we will discuss the top nine best practices for data visualization. Following these best practices will help ensure that your visualizations are clear and informative, and that your insights land as intended. Let's get started.
1. Keep it simple
Data visualization is all about communicating data insights in a way that is both accurate and easy to understand. When creating visuals, less is almost always more. Data overload can quickly lead to confusion, so it’s important to only include the most important information.
In the words of Iaro Boutorin, AVP Replenishment at Canadian Tire Corporation, “It’s about understanding the needs of the end users as well as educating them on the available data points and KPIs they need for their unique use cases.”
2. Use intuitive visual cues
The best data visualizations make use of visual cues that are immediately intuitive to the viewer. For example, using different colors to represent different data points can help the viewer more easily understand the relationships between those points.

3. Avoid distracting elements
In addition to keeping the visualization itself simple, it’s also important to avoid any extra elements that could serve as distractions. This includes things like excessive use of color, busy background patterns, and cluttered layouts.
4. Tell a story
Data visualization is an opportunity to tell a story with the data. An effective visualization will effectively communicate the key insights from the data in a way that is both accurate and easy to understand.

5. Use data points carefully
When using data points in a visualization, it’s important to carefully consider which points are most important to include. Data points should be chosen based on their ability to accurately represent the underlying data and tell the story you want to communicate.
When Capital One implemented ThoughtSpot as the analytics layer, their Director of Data Engineering and Consumption, Latha Govada Nekkalapudi, noted that “As part of our modernization effort, we were very intentional about what [data] we were choosing, how we were implementing it, [and] how we were baking [in] our governance and security needs.”
6. Use visual hierarchy effectively
An effective data visualization makes use of visual hierarchy to direct the viewer’s attention to the most important information. This can be accomplished through the use of things like size, color, and position.
💡Related read: 8 best data visualization tools to use
7. Use effective labels
Labels are an important part of any data visualization. They should be clear and concise, and they should accurately describe the data that is being represented.

8. Test data visualizations with users
Before finalizing a data visualization, it’s important to test it with actual users. This will help ensure that the visualization is effective in communicating the story you want to tell.
9. Continuously iterate and improve
Data visualization is an iterative process, and it’s important to continually strive for improvement. As new data becomes available, or as new insights are gained, be sure to update the visualization accordingly.
Kris Curtis, Senior Analytics Manager at Just Eat, shared how he originally launched ThoughtSpot’s self-service analytics platform to key account managers and other business users. Following a quick adoption, Kris decided to extend this opportunity to their branded restaurant partners, feeding restaurants invaluable data insights to help properly resource their businesses while simultaneously deepening Just Eat’s relationship with these essential partners.
Find what works best for you and your data
Following these best practices and data visualization examples will help ensure that your data visualizations are effective in communicating the story you want to tell. However, it’s also important to remember that there is no one right way to visualize data. The most important thing is to experiment and find what works best for you and your data.
If you’re looking for a self-service analytics platform that can help you quickly create interactive data visualizations, ThoughtSpot is a great option. Our platform offers all of the features you need to get started, and we have a wide range of Liveboards and support from our team of experts to help you get the most out of your data. Start a free trial today to see how easy it is to take your data from insights to action.


