


You already feel the pressure from AI pushing every team to move faster, answer harder questions, and make decisions with more confidence. But the real challenge isn’t recognizing the need; it’s building the day-to-day foundation that actually improves how your organization uses data.
When your BI and analysis setup runs on clear definitions, clean governance, and workflows that connect directly to how teams operate, even complex questions become easier to answer. You move from scrambling for alignment to making decisions that actually stick.
This guide walks you through how to build that foundation: a simple decision loop you can apply across teams, quick experiments to test whether your current stack is ready, and governance patterns that grow with your data, not against it.
What "business intelligence and analysis" really means
Business intelligence (BI) and analysis are really about turning your data into decisions you can act on. BI provides the platform and processes to collect, organize, and visualize your business data, so you have a clear view of what's happening across your organization. Data analysis supplies the methods and techniques to examine that data, discovering patterns, diagnosing issues, and identifying opportunities for action.
Think of it as the bridge between data and decisions. BI creates the infrastructure that makes your data accessible and understandable, while analysis applies the techniques that extract meaning and guide your next steps. Together, they turn information into impact.
The DecisionOps loop: Sense → Explain → Decide → Act
To make business intelligence and analysis part of how your teams actually work, you need a repeatable BI strategy. One relatively simple and highly effective model is a continuous loop that helps you move from data signals to concrete actions.
This DecisionOps loop consists of four key stages that work together to turn raw information into business value:
1. Sense (signals and access)
The first stage is about noticing what’s shifting in your business as it happens. Instead of waiting for overnight refreshes or weekly reports, modern cloud BI platforms connect directly to live data sources, giving you the freshest possible view of your operations and enabling faster, more confident decisions.
Here's what effective sensing can look like:
Real-time data connections: Connect directly to operational systems to capture business events as they happen, eliminating the delays inherent in batch processing
Threshold-based alerts: Configure intelligent notifications that trigger only when metrics cross meaningful boundaries
Continuous anomaly detection: Let AI scan your data streams for unexpected patterns and outliers, surfacing issues you didn't know to look for
2. Explain (consistent metrics and lineage)
Once a signal is detected, everyone needs to trust it. This is where a governed semantic layer and data lineage become the heart of your analytics.
A semantic layer is a business-friendly abstraction layer that sits between your raw data and your analytics tools. Think of it as a universal translator that defines all your business terms—from "net retention" to "regional sales"—in one centralized place. Properly configured, a semantic layer establishes that these metrics mean exactly the same thing whether you're viewing a dashboard, running a query, or asking an AI copilot a question.
Lineage adds the context behind each number. It shows where the data came from, how it was combined, and the exact logic behind the calculation. No guessing, and no “why doesn’t my report match yours?” Just transparency that builds confidence instead of friction.
3. Decide (narratives and copilots)
With trusted data, you can move to making a decision. This is where AI in BI workflows can dramatically speed things up. Instead of (or in addition to) a traditional chart, you get a narrative that explains what the data means and why it matters.
AI copilots help you build visualizations instantly, surface the most relevant follow-up questions, and identify the specific actions your data is pointing toward.
4. Act (embedded and workflow integration)
Insights only drive value when they trigger action. The final stage pushes insights directly into your team's existing workflows through embedded analytics, whether that's Slack, Microsoft Teams, or your custom business applications. This integration shortens the path from insight to action, measuring success not by dashboards viewed but by data-driven decisions made.
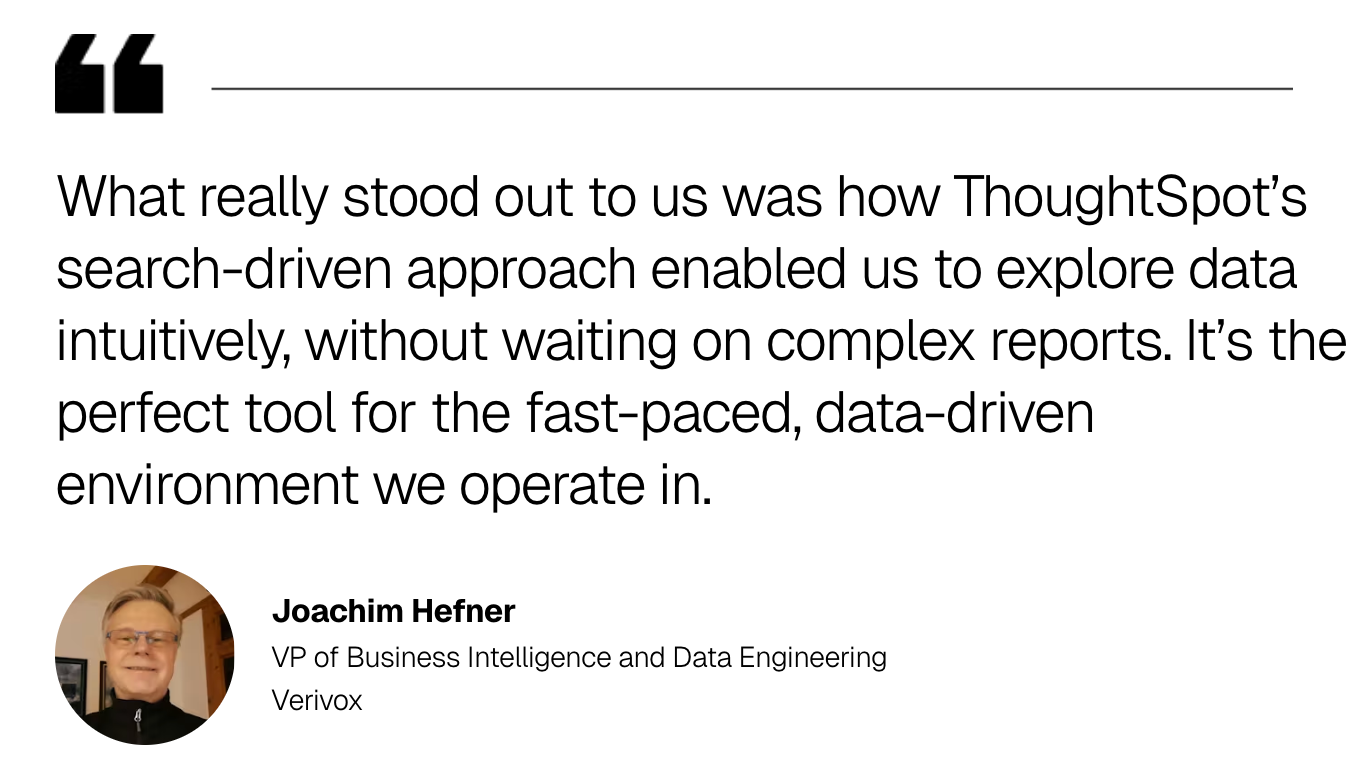
Verivox, a leading German vendor comparison platform, faced struggles with slow time-to-insight and rigid data exploration tools. By embedding ThoughtSpot directly into their B2B platform, they transformed their analytics experience. User adoption increased dramatically, teams began monetizing data as a product, and real-time insights became standard across the organization. Verivox is seeing strong adoption of ThoughtSpot Analytics, with over 350 Monthly Active Users (70% of their 500 employees), and is leveraging ThoughtSpot Embedded as the analytics engine powering Vertriebspartner-Portal, their B2B platform.
Start Getting Better Insights
Five fast experiments to validate your business intelligence and analysis stack
Before committing to a major BI overhaul, validate your current stack's readiness with these five quick experiments. Each includes clear pass/fail criteria for an at-a-glance indicator of which areas need more attention.
1. One KPI, many surfaces
Pick a single KPI that really matters, say “quarterly sales.” Check it in three places: a dashboard, natural language search, and a SQL query. The number should match everywhere. Then click into it to see if your tool can explain how it was calculated and where the data came from.
Pass/fail criteria:
Pass: The same KPI shows identical values across all three access methods, and you can trace its calculation back to the source data with a clear explanation of the formula used.
Fail: Values differ between interfaces, or the system can't explain where the number came from or how it was calculated.
What this tells you:
Whether you have a consistent and trustworthy semantic layer that ensures metrics mean the same thing across every interface and tool.
2. Multi-turn refinement
Ask your analytics platform a question, like "Show me sales by region." Then, ask two follow-up questions, such as "show me sales only for the last month" and "now break that down by product line."
Finally, ask how the final number was calculated. If the system can follow your train of thought and explain its work, it has true conversational context.
Pass/fail criteria:
Pass: The platform remembers your previous questions and refines the analysis without requiring you to repeat context. It provides a clear explanation of how it calculated the final result.
Fail: You have to restate your full question each time, or the system can't explain its calculations in a way you can understand and verify.
What this tells you:
Whether your platform can maintain conversational context across multiple questions and provide transparent explanations for its analytical reasoning.
3. Proactive digest
Subscribe to a daily or weekly KPI digest delivered to you in Slack or Microsoft Teams. When it arrives, compare the narrative summary with the source data. If the AI-generated summary is accurate and genuinely helpful, it’s a sign that your platform is successfully turning signals into decisions.
Pass/fail criteria:
Pass: The digest arrives on schedule with accurate summaries that highlight meaningful changes and suggest relevant next steps you can act on immediately.
Fail: Summaries contain incorrect information, miss important trends, or provide generic insights that don't help you make better decisions.
What this tells you:
Whether your platform can proactively surface insights that are both accurate and actionable, turning raw signals into decision-ready narratives.
4. Integration readiness
Your BI platform might look great inside its own walls, but the real test is how easily it plugs into your actual business applications. Pick a simple workflow, maybe a staging app or an internal tool, and try pulling in a governed KPI plus a drillable visualization. Don’t over-engineer it; the point is to see how much friction your developers hit when they try to wire your analytics into the places people actually work.
If you can get something functional, secure, and permission-aware up and running in a day, you’re operating with modern, integration-friendly plumbing. If not, you’ve found one of the first places your overhaul is going to get expensive.
Pass/fail criteria:
Pass: A developer can stand up a working, governed visualization in an application within one business day. Authentication behaves; users only see the data they’re supposed to, and the integration relies on clean APIs rather than being dependent on complex custom code.
Fail: The work drags on for days, requires custom engineering just to display a chart, or forces you to sidestep governance and security rules to get anything to load.
What this tells you:
Whether your platform’s APIs, embeddings, and security model are actually ready for real-world integration, or whether they’ll slow your team down the moment you try to extend BI beyond dashboards.
5. Guardrail test
Using a test account with limited permissions, try to access a restricted dataset or a sensitive column like salary information. The system should not only refuse the request but also ideally explain that access is denied due to a specific governance policy.
Pass/fail criteria:
Pass: The system blocks unauthorized access and provides a clear message explaining why access was denied, referencing the specific policy or permission level.
Fail: Restricted data is accessible when it shouldn't be, or the system provides confusing error messages that don't explain why access was denied.
What this tells you:
Whether your security and access controls are properly configured and can enforce governance policies while providing clear, transparent feedback to users.
The trust core: Governance patterns that scale
For any business intelligence and analysis initiative to succeed, people in your organization have to trust the data from the C-suite to the shop floor. Trust isn't built by accident; it's the result of intentional governance patterns that guarantee data is consistent, secure, and transparent.
These scalable governance concepts will help your organization build a stronger and more flexible framework for BI and analytics.
1. Metrics and semantic layer
Your semantic layer is the cornerstone of trust. Start by identifying your top KPIs and documenting their exact definitions in one centralized place. Build this incrementally. Begin with one department's core metrics, validate them with stakeholders, then expand to adjacent teams. This approach lets you prove value quickly while building momentum across the organization.
As your semantic layer grows, use version control to track changes and establish a review process where metric owners approve updates before they go live. Create metric families that inherit common logic, so related calculations stay consistent automatically. This reduces maintenance overhead and ensures that whether you have twenty metrics or two thousand, they all speak the same business language.
2. Security and access
Effective security starts with mapping your organizational structure to data permissions. Implement role-based access controls (RBAC) with broad categories like "Sales," "Finance," and "Operations," then layer in row-level security (RLS) to automatically filter data based on user attributes. A regional manager sees only their region's data without needing separate reports because the system handles it automatically.
Scale this approach by creating reusable permission templates and inheritance hierarchies. New users should automatically receive appropriate access based on their role, eliminating manual configuration for every hire. Maintain an audit log that captures every data access event, giving you complete visibility into who viewed what and when. This transparency protects sensitive information while keeping your analytics accessible to those who need it.
3. Observability
The best way to improve your analytics is to analyze your analytics. Set up BI-on-BI by instrumenting your platform to track usage patterns, query performance, and user behavior. Create dashboards that show which content gets used most, where users abandon their analysis, and which queries run slowly. This visibility helps you understand what's working and what needs attention.
Build feedback loops into your system, such as thumbs up/ down ratings on AI-generated insights, to continuously improve accuracy. Schedule weekly reviews of these metrics with your analytics team to identify adoption blockers and optimization opportunities. As usage grows, set up automated alerts for anomalies like sudden drops in dashboard views or spikes in failed queries, so you can address issues before they impact your business.
Where AI fits in business intelligence and analysis (and where it doesn't)
You’ve probably heard the phrase “AI is the new BI” used to describe the increasing role of agentic AI and other machine learning technologies in business analytics. While it’s true that AI is redefining the analytics landscape, a smart and results-driven implementation requires you to understand its role.
AI is not a magic box; it's a powerful assistant that works best when grounded in trusted, governed data. These are some of the most powerful use cases of AI for business intelligence and analysis, along with some of the biggest potential challenges.
1. Copilots and conversational BI
AI copilots transform natural language questions into instant visualizations. With an AI analyst like Spotter, you can type a question like "Show me Q4 revenue by product category" and get a formatted chart in seconds. Context retention across multi-turn conversations lets you refine analysis naturally without restating your full question each time. The key advantage is democratizing data access so business users can explore data without SQL expertise.
However, these tools require careful implementation to deliver reliable results. Grounding them in your semantic model prevents AI hallucinations by ensuring answers use only pre-validated business logic. AI copilots work best with well-defined metrics and may struggle with ambiguous questions or edge cases, so success requires both robust augmented analytics capabilities and user training on how to validate AI-generated insights.
2. Proactive insight engines
AI monitors your data continuously, surfacing meaningful changes before you ask. These engines detect anomalies and explore their drivers automatically, like identifying why sales dropped in a specific region last month. Configure delivery through Slack or Teams digests to shift from searching for answers to having critical insights pushed directly into your workflow.
While proactive insights can dramatically accelerate decision-making, they also introduce new challenges. Alert fatigue becomes a real risk when systems generate too many notifications, causing teams to ignore genuinely important signals. False positives, where AI flags normal variance as anomalies, can erode trust if not properly calibrated. Start with a narrow scope of high-priority metrics, set clear thresholds for meaningful changes, and refine your models based on user feedback.
3. Guardrails
AI requires controls to maintain trust. Implement technical safeguards that prevent unverified responses and require the system to show its work, including data sources, filters, and calculation logic. The core idea is creating continuous improvement cycles that strengthen accuracy over time.
Effective guardrails balance innovation with governance. Too restrictive, and you limit AI's ability to surface unexpected insights. Too permissive, and you risk introducing AI bias or propagating inaccurate conclusions through your organization. The most successful implementations combine technical controls with organizational processes, such as requiring AI to cite its sources and designating metric owners who review insights before wide distribution.
Your BI implementation playbook: How to go from pilot to production
Moving from a pilot to real adoption takes more than good dashboards. This playbook focuses on the three areas that matter most when you want a modern BI setup that people actually rely on.
1. Metric contracts and glossary
Why it matters: Inconsistent metric definitions create confusion and erode trust in data-driven decisions.
Action steps: Convene stakeholders from finance, sales, and operations to document your top 10-20 metrics. For each metric, specify the exact calculation formula, data sources, refresh frequency, and business owner. Store these definitions in a centralized glossary that feeds your semantic layer. Start with one department, validate accuracy over two weeks, then expand.
Implementation: Analyst Studio lets data teams collaboratively define metrics using SQL, Python, or R, then publish them as governed datasets that power both traditional dashboards and AI-powered search.
2. Content lifecycle
Why it matters: Analytics environments quickly become cluttered with outdated content, making it harder for users to find trusted insights.
Action steps: Establish a three-tier certification system: "Certified" for executive-level content reviewed monthly, "Trusted" for departmental analytics validated quarterly, and "Sandbox" for experimental work. Assign content owners responsible for accuracy. Review usage metrics monthly and archive content with zero views for 90 days.
Implementation: Liveboards incorporate AI-generated insights and drill-anywhere exploration, transforming static reports into interactive experiences that surface answers to follow-up questions automatically.
3. Embed and automate
Why it matters: Insights only create value when they trigger action within existing workflows, not isolated BI tools.
Action steps: Identify three high-impact workflows where embedded analytics would eliminate context-switching, such as sales forecasting in your CRM or inventory alerts in your ERP. Use REST APIs to embed interactive visualizations with full drill-down capabilities. Instrument click-through rates and measure time-to-decision before and after embedding.
Implementation: ThoughtSpot's embedding framework supports both low-code iFrame integration and full SDK customization, letting you place governed analytics directly into operational applications while maintaining security and performance at scale.
Put your data to work across your organization
Dashboards and data warehouses are essential tools, but the real path forward for business analysis and intelligence in 2026 involves rethinking the fundamentals of how you use data. In short, it's about making data-driven decision-making as natural as checking your email.
ThoughtSpot is an AI-native agentic analytics platform that combines live data connections, governed semantics, automated insights, and embedded analytics in one system. Every question leads to an answer and every answer leads to action, without requiring SQL expertise or sacrificing governance.
It’s time for you to move from reactive reporting to proactive intelligence—experience ThoughtSpot in action with a free trial.
Business intelligence and analysis: Frequently asked questions
1. How do data analysis and business intelligence work together?
Data analysis is the technical process of inspecting, cleaning, and modeling data to discover useful information, while business intelligence is the broader strategy and technology used to present that information to help you make smarter decisions. The two work together to turn raw data into action.
2. Do I need a metrics or a semantic layer for business intelligence?
Yes, a semantic layer is what makes your analytics trustworthy and scalable. It defines your business logic and ensures that everyone, including AI, is speaking the same data language. That consistency and structure are vital for tracking consistent KPIs and grounding natural language search in reality.
3. Can AI copilots replace traditional business intelligence dashboards?
AI copilots complement dashboards, but they don't replace them. Dashboards are excellent for monitoring known KPIs, while AI copilots are ideal for exploring data, asking follow-up questions, and generating new insights and visualizations from your trusted data models.


