


Starting in 2006 with the introduction of Docs and Sheets, Google’s suite of apps revolutionized productivity by allowing users to access files from anywhere, collaborate in real-time, and share/read various file types. As an individual, you no longer needed expensive licenses like Microsoft to create professional documents online. And for businesses, these types of tech advancements fueled collaboration for globally distributed teams.
Of course, Google has no shortage of innovative products. Just consider the way we search the internet and what browser you’re searching the internet on. By far, one of the coolest inventions is the app marketplace. Sure, that might have been Apple’s idea originally, but Google quickly saw the value and found ways to incorporate it into their own products. By allowing third-party apps to integrate services into Google’s products, like Chrome and its workplace apps, Google has added value for their users. This process creates loyalty, it’s part of any successful user engagement strategy, and it's one of the main reasons I still use Chrome today—despite my privacy concerns. ICYMI: I really love my chrome extensions.
As a product of the 90’s, I’ve spent a majority of my life having access to these tools. And often, I take them for granted. When we launched ThoughtSpot for Sheets back in 2022, I was reminded of the value these add-ons provide—new functionalities that streamline workflows, integrations that create previously unavailable capabilities, and connections that change our perspectives. This got me thinking, “What other Sheets add-ons exist, and how could they alter the way I perform data analytics in spreadsheets?” I’ve compiled this list to share some of my favorites with you.
If you aren’t familiar with ThoughtSpot’s aforementioned Sheets add-on, here’s a shameless plug on how to use ThoughtSpot for Sheets. This free add-on automatically creates interactive data visualizations and allows you to search your data in natural language search—eliminating pesky v-lookups and the endless loop of scouring for answers. Recent updates include additional chart types, pin to Sheets and Slides features, and most excitingly for me, AI Insights.
AI Insights points out correlations and anomalies that you may not know to look for. And, it eliminates that glazed-over look I often get on my face when I first open up a spreadsheet of marketing data. ThoughtSpot for Sheets provides all of this functionality, directly in the Sheets app. That’s why so many of our monthly active users are in the add-on multiple times a week. PS: if you happen to be a Microsoft user that somehow ended up on this page, we’ve got a plugin for Excel, too.
If you haven’t already, I highly recommend that you install the app and try it today!
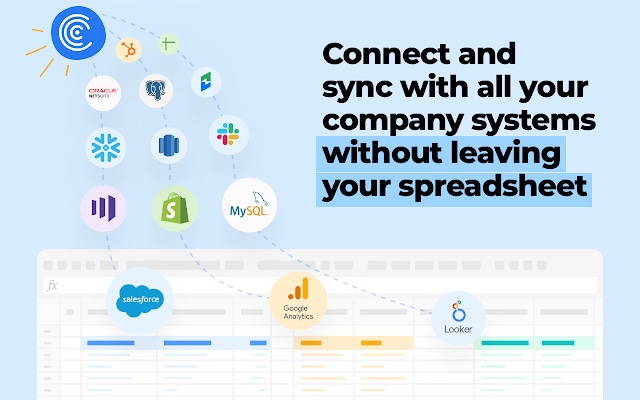
Before you can start performing analysis on your data, you first need to pull that data into your Sheet. While this might seem like a no-brainer task, data movement can be extremely time consuming—just ask an analytics engineer. That’s where add-ons like Coefficient come in handy, allowing you to schedule data imports on a custom cadence from an ever-growing list of company systems (think: HubSpot, Salesforce, and MySQL) directly into Google Sheets.
As a marketer, I’ve spent hours fighting with HubSpot dashboards, trying to produce the exact visualization my clients needed. Using Coefficient and ThoughtSpot add-ons, you can pull the data you need, create the visualization you want, and push that visualization straight into your client presentation. Coefficient has also introduced AI functionality for a more productive day-to-day in spreadsheets. Their GPT Copilot will build formulas, charts, pivot tables, and SQL queries for you. Of course, the benefits reach far out of my own experiences, and I encourage you to try it out for yourself.
Read more on how to get started with ThoughtSpot + Coefficient.
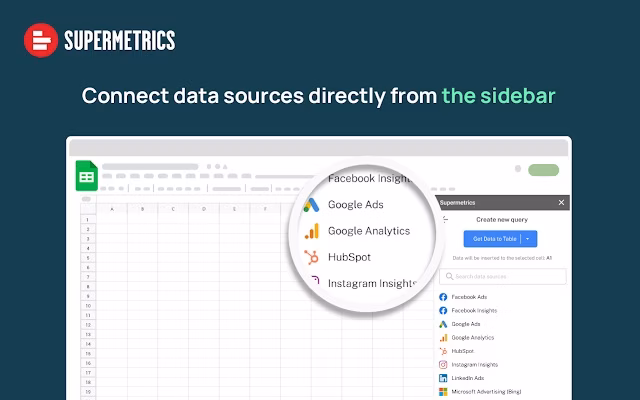
When it comes to seamlessly importing data, Supermetrics is another add on for sheets. They are specifically known for marketing analytics because they integrate with all major social media, SEM, PPC, SEO, and major advertising platforms. They also connect with web analytics and major payment platforms—making it a perfect tool for the initial stages of SKU rationalization or inventory planning.
Along with setting up regular data refreshes, you can also schedule those data reports to come to your inbox on an hourly, weekly or monthly basis.
Try Supermetrics today with their 14-day free trial.
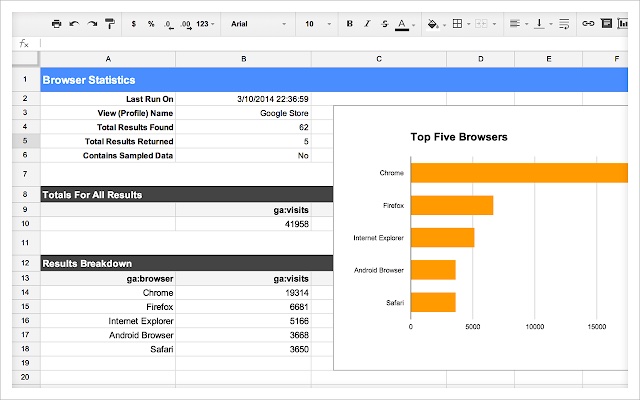
If you’re anything like me and are struggling to adapt to the new dashboards in GA 4, you might have an easier time analyzing your marketing data in Sheets. It’s no surprise that Google made a seamless integration with their official Google Analytics add-on.
As you might infer, Google Sheets add-on allows you to import data directly from Google Analytics into your spreadsheets. You can create custom reports, analyze website traffic, and track key metrics—all without leaving Google Sheets.
Install the add-on here. Note: you may need to talk to your administrator admin about adding this application to your allowlist.

Whether you’re a programmer, product builder, or email campaign manager, you’ve probably worked with Lucidchart, or a program like it, in the last few years. Essentially, a Lucidchart is a diagramming application that allows you to visualize process, information, or relationship flows. One of the major benefits of using a program like Lucidcharts is its communication features. It allows you to visualize, share, and collaborate on complex ideas.
Their Google Sheets add-on works in a similar way, allowing you to convert your complex data sets into one easy-to-read chart. There are ample use cases including visualizing databases, generating org charts from spreadsheet data, and turning your spreadsheet process sequences into something much more easy to follow.
Learn more about the Lucidchart add-on here.
AppSheet is another type of visualization tool, however it works by transforming your data into a no-code web application. Acquired by Google in 2020, AppSheet has a number of app templates that you can use in connection with your Sheets data. For example, you can create a project tracker, monitor inventory levels, create a timesheet tracker, or manage your campaign links.
By allowing you to visualize these complex data sets through a sharable application, you can build a resource that helps your team all stay on the same page. When compared to ThoughtSpot for Sheets, AppSheet does require substantial setup, is not localized within the Sheets application, and is only free up until a point. That said, if you’re looking for a data visualization tool that’s going to help you monitor/track a specific, ongoing project, this might be an interesting avenue to explore.
Learn how to build an app with Google AppSheet today.
If you, like so many of us, listed that you were proficient at Excel on your resume, but didn’t actually know what all that entails, this one's for you. Instead of memorizing, searching, or asking ChatGPT for every function, this easy-to-use add-on offers a collection of tools ranging from easy to advanced.
Let’s say you need to perform a find and replace, split columns, or combine columns, the Power Tools add-on is here to help. It also has data analysis functions like conditional and numeric operations, and it will allow you to customize your formulas in bulk. You can even save your table styles so that they match with your company’s branding. With more than 7M reviews and an average 4-star rating, it’s definitely worth checking out.
Learn more and install the Power Tools add-on here.
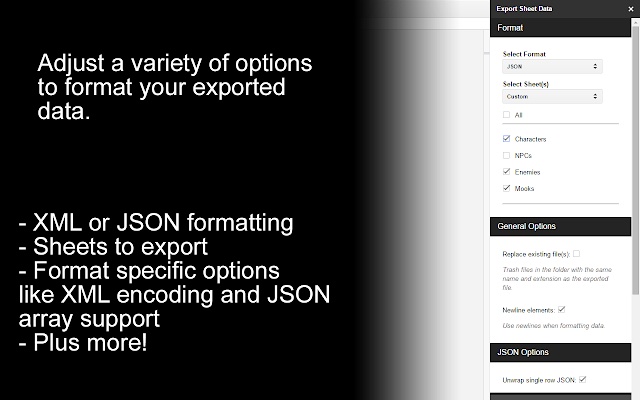
If you’re tired of downloading individual sheets as CSVs and compiling them later, Export Sheet Data is one add-on you need to know. Once installed, you simply navigate to the Sheet in question, open the Export Sheet Data add-on, select the desired format (XML, JSON, or others), configure your specific settings, and then export the file. You can also view and copy the file instead of exporting.
Because this add-on is open source, you can also collaborate with other users to improve the add-on functionality.
Learn more and install Export Sheet Data here.
Last, but certainly not least, we couldn’t wrap up an article in 2023 without mentioning the power of GPT. GPT for Sheets™ (and Docs™) empowers you to use GPT directly in your work applications. You can use it for all sorts of text tasks: writing, editing, extracting, cleaning, translating, outlining, explaining, summarizing—just to name a few from their Google Workplace listing. It’s no wonder it has over 3 million installs to date.
To use the application, you need to insert your OpenAI api key. Then, simply write your custom function using natural language text. This is incredibly useful for cleaning up lists, writing procedures or translations, managing product catalogs, and in my cas, coming up with article ideas. No matter what side of the business you work in, GPT for Sheets is a great opportunity to operationalize the power of generative AI for your business operations.
Get started using GPT for Work.
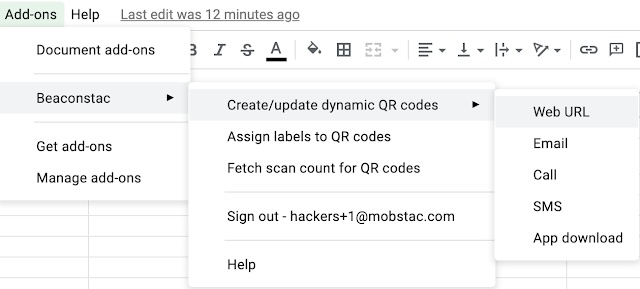
Nowadays, every business uses QR codes for different purposes. Using the Uniqode add-on to Google Sheets, you can create QR codes, assign labels to them, and, most importantly, fetch scan counts and numbers to analyze your QR Code engagement campaigns. Once you’ve fetched your data, you can use Google Sheets to create various reports, dashboards, and visualizations to track engagement levels and optimize your campaigns.
Learn more about the Uniqode add-on here
Going beyond Google Sheets
While there is no doubt that Google Sheets is a revolutionary tool and these add-ons open up a world of functionality possibilities, there are still some things that can’t be solved in a spreadsheet. These tools aren’t designed to handle the massive quantities of data and sources generated by a modern business. To be a truly innovative company, you need to be able to connect all of the dots between all of your business data, and you can’t do that if it’s housed in siloed spreadsheets.
That’s where a true business intelligence solution like ThoughtSpot can help. Our platform allows you to search, share, and drill down into your data—empowering you to see the forest and the trees. And with AI-Powered Analytics, you can find the anomalies, insights, and potential savings that are currently hiding in those spreadsheets.
Best of all, our Teams Edition is only $95/month, and our 14-day free trial lets you get your analytics up-and-running before you ever pay a penny. Try it out today, or schedule your one-on-one demo to see how ThoughtSpot can improve your data workflows.


