Much is celebrated in the month of March. Devout Christians mark the arrival of Lent with a period of penitence. Countless revelers around the world don green costumes outfitted with good luck charms to celebrate Irish culture on St. Patrick’s Day. College basketball fans root for the next bracket buster cinderella team during March Madness. And millions of us living in the Northern Hemisphere look forward to welcoming the arrival of Spring.
For those us in analytics, March is the time of year when we join thousands of our peers at the Gartner Data and Analytics Summit to learn about emerging data and analytics trends, explore networking opportunities, and be inspired by Gartner analysts and guest experts.
This year’s summit was a special one for ThoughtSpot for several reasons. For starters, this is the first major industry event since Gartner named ThoughtSpot the first new leader in the Magic Quadrant for Analytics and BI Platforms in six years.
It is an honor to be fastest analytics company to ever make it to the Leaders quadrant, and we set the bar pretty high for ourselves to live up to those expectations at the show. We were also thrilled to participate as one of four vendors in the 5th annual BI Bake off. This gave us the opportunity to showcase our disruptive approach to analytics next to larger, more established vendors like Microsoft, Tableau, and Qlik - live, and in front of 800 people.
As the week ended, I stopped to reflect on how the industry has evolved, and how far ThoughtSpot has come. The Summit has always been my favorite show to attend. With so many learnings to take away from the event, here are my top highlights.
BI Bake Off Welcomes a New Contestant
For years, I’ve attended the bake offs to witness key vendors show off very similar capabilities in a controlled setting with a prescribed use case and data set. Always entertaining, this session always gets top billing, even when it is scheduled on a Sunday afternoon. This year, Gartner decided to invite ThoughtSpot, knowing that while our solution may not necessarily compare apples-to-apples with the likes of Tableau or Power BI, we offer a novel approach to analytics that the audience will find differentiated and interesting.
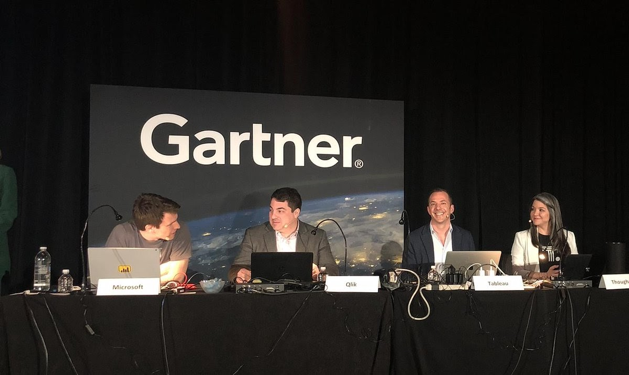
This year’s topic - the impact of technology and other contributing factors of loneliness and happiness. Angela Hooper, director of systems engineering at ThoughtSpot, represented us brilliantly (and valiantly). If you are curious to learn more about her experience, check out Angela’s blog.
Lead with Purpose to Achieve Clarity in a World of Ambiguity
I’m shamelessly copying the main theme from Gartner’s keynote address. Gartner predicts that by 2022, worldwide spending on data and analytics software will reach $104.1 billion. If you add services to the equation, that number balloons to $370 billion.
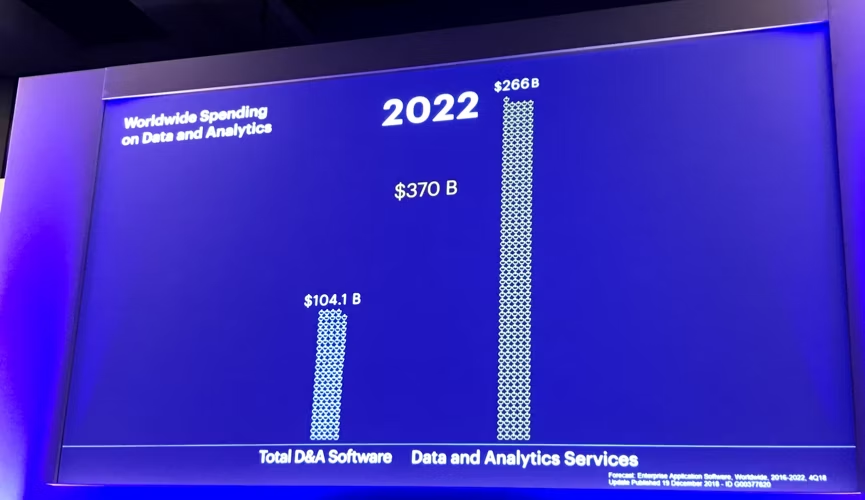
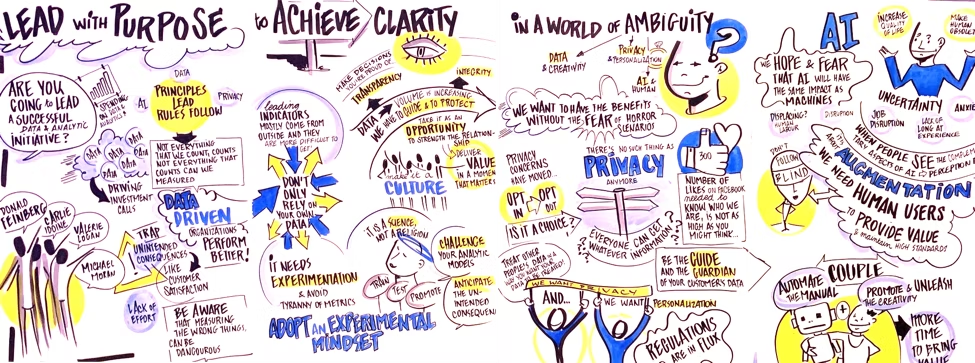
With so much investment, how do analytics leaders find purpose in driving their business forward with data? The keynote drilled down in three leading principles:
Data driven - adopt an experimental mindset. While data is an extremely critical asset for your business, you should take the opportunity to challenge data driven decision making. Otherwise, too much data may lead to unintended consequences. Experimentation is required to ensure that the metrics you use to drive decisions are meaningful.
Privacy - be the guide and guardian of your customer’s data. In a world where each of us strive for personalized digital experiences, privacy as we know it no longer exists. We must therefore treat our customers data the way they want it to be treated, and leverage transparency to create trust with our customers.
AI - automate the manual and promote the creative. With so much data being collected, there is no question that smart and powerful machines can help uncover insights to help drive decisions. While there is hope, there is also anxiety that machines may someday replace humans. The key is to play to AI and human’s respective strengths, and augment the human’s capabilities, rather than replace them.
BI Adoption Has Increased, But There’s More to be Done
In Cindi Howson’s session, The Foundation of Modern Analytics and BI, Cindi revealed an interesting stat. Back in the traditional BI days in 2009, BI adoption was pegged at 24%. Fast forward to 2019, and with the help of modern analytics and business intelligence solutions, adoption has increased to 35%. That’s an increase of only 11% over a period of 10 years.
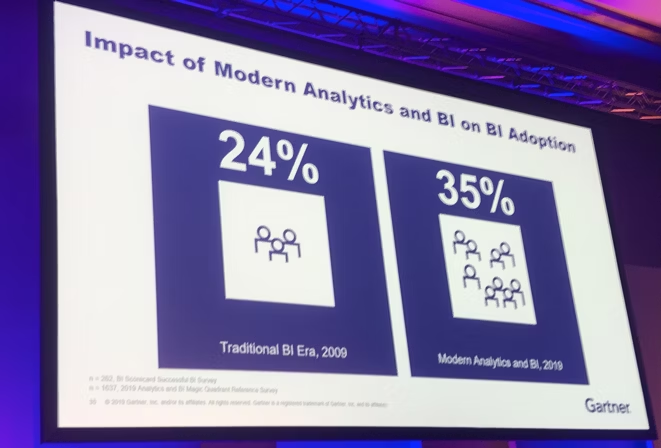
While adoption is headed in the right direction, there’s still a lot to be done if the industry wants to enable non-technical users to easily get the answers to their data questions. She called on all organizations to modernize, but with new technologies and shifts in roles and responsibilities, she recommended they assess their readiness and put on their training wheels before speeding down the race track.
Augmented Analytics, the Future State of the Art
Gartner predicts that "By 2020, augmented analytics will be a dominant driver of new purchases of analytics and BI as well as data science and machine learning platforms, and of embedded analytics."
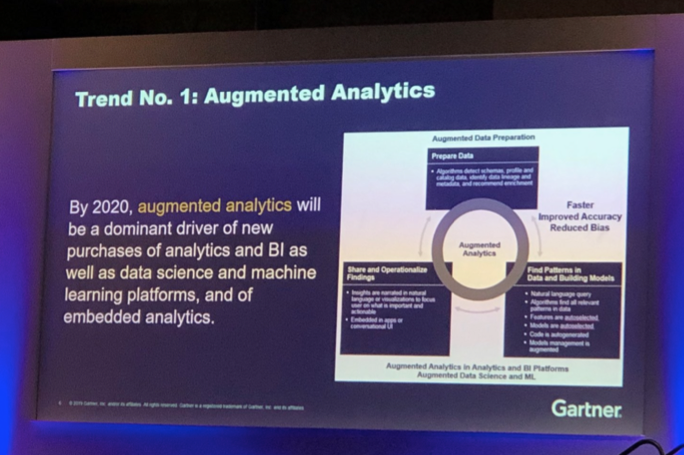
Data is more complex than ever before. It's virtually impossible to find answers all on your own. In a few years the static KPI dashboard will be a thing of the past. We will experience a paradigm shift where relevant insights that are auto-generated are served to the user in a dynamic dashboard in context to each user.
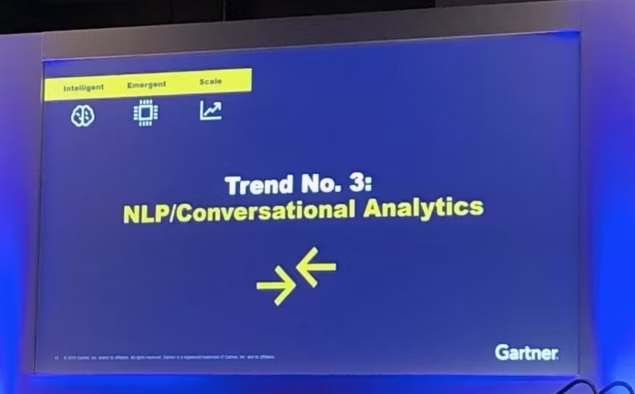
Similarly, just as Google has had a tremendous impact on accessibility to the Internet with NLP, the same is happening in the analytics space with search and NLP. NLP, together with augmented analytics and conversational analytics will allow more people to get insights at a fraction of the time, which in turn will drive more impact across an organization.
There’s Clear Momentum in Data for Good
Another key theme around the conference was the use of data to make a positive impact on society. This started with the bake off when all four vendors, including ThoughtSpot, used data from the Kaiser Family Foundation and the Economist’s survey on loneliness, and the Gartner’s Consumer Values Survey data, to analyze factors impacting our well-being.
From saving shelter dogs to driving action to affect climate change, Cindi gave many examples where data and analytics can be used for social purpose and philanthropic initiatives. Across the industry, there’s clear momentum in this movement. While she cautioned against possible missteps, she everyone to be active to donate our skills and time to specific causes that we may be passionate about.
Secrets to Our Customers’ Success
Nothing inspires us more than hearing our customers share their success stories. At the event, we were fortunate to have four of our marquee enterprise customers share the stage with us to share their experiences.
Catherine Beley, Sr. Manager of Data Insights at Hulu discussed their Subscriber 360 use case in which Hulu marketing teams needed granular insights on campaign efficacy, churn, and more. Existing dashboard and visualization tools were unable to scale to meet the requirements to get a granular view of subscriber insights over billions of rows across disparate data sources. With Search & AI, Hulu was able to boost efficiency and reduce 50% of their BI reporting backlog, freeing up their analyst resources to focus on value-add projects.
Amanda Delgado Recke, from the ExxonMobil Upstream IT Business Analytics team told the audience that existing business analytics tools were too cumbersome for business units, and data was trapped preventing insight from energy production data. They have since increased data access of oil and gas production trends across multiple business units including Operations, Field Engineers and more, with the help of ThoughtSpot’s Search & AI-driven Analytics capabilities.
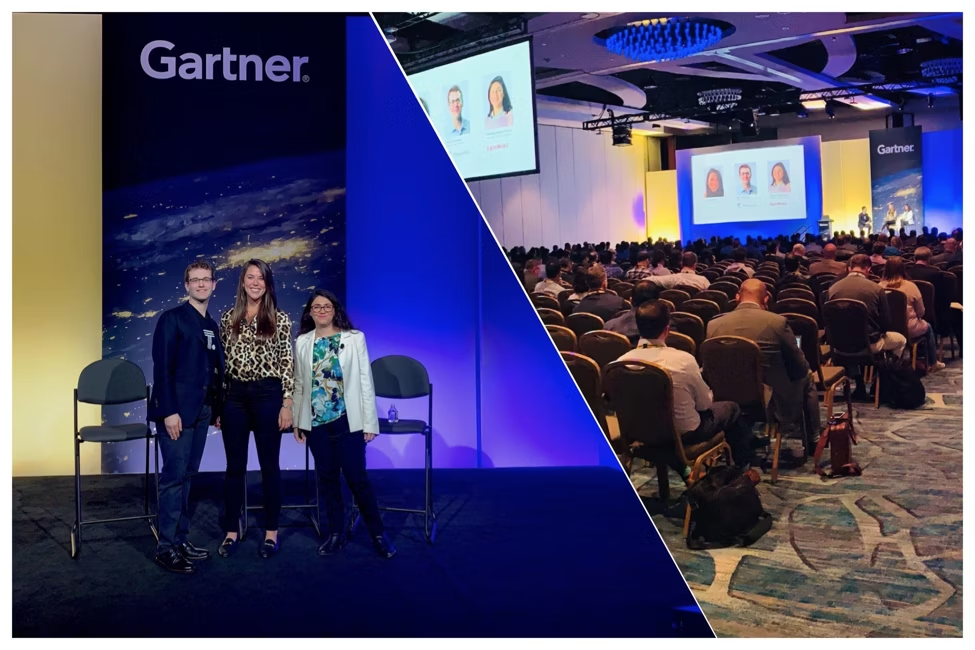
Cisco collects Customer Support data from the thousands of products they sell and service all over the world. According to Sandeep Tilak, Sr. Manager of BI & Analytics, Cisco’s biggest challenge was the volume and variety of data which generated billions of potential questions business people might ask. Now, the Support Team can easily use search to rapidly understand support trends, and get granular details around customer support cases, service category and net satisfaction score. They are also using AI-driven analytics with SpotIQ to automatically surface outliers and anomalies they didn't know surrounding a specific service category and service offering.
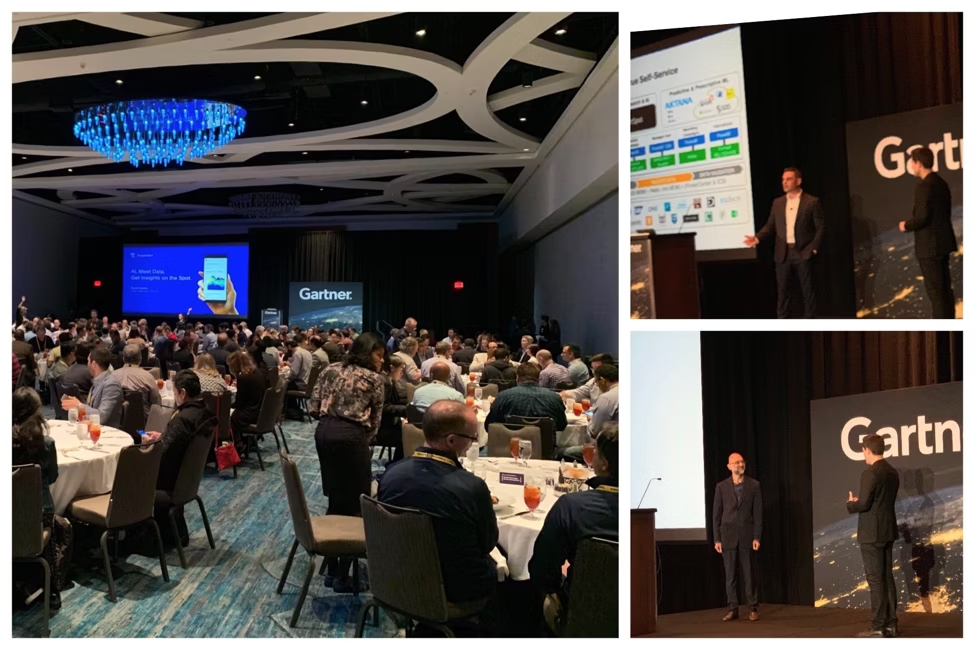
Always enlightening and entertaining, Vincent Ciro, Executive Director of Commercial Intelligence at Allergan, discussed how they use market information from IMS to get granular insight on brand performance. The most fascinating use cases were around the analysis of patient consumption habits for Aesthetics such as Botox, Juvederm, and CoolSculpting products. They use ThoughtSpot to analyze patient trends, upsell/cross-sell,as well as gain complete visibility into the patient journey from consumption habits to loyalty programs and more.
Our New Logo is a Hit
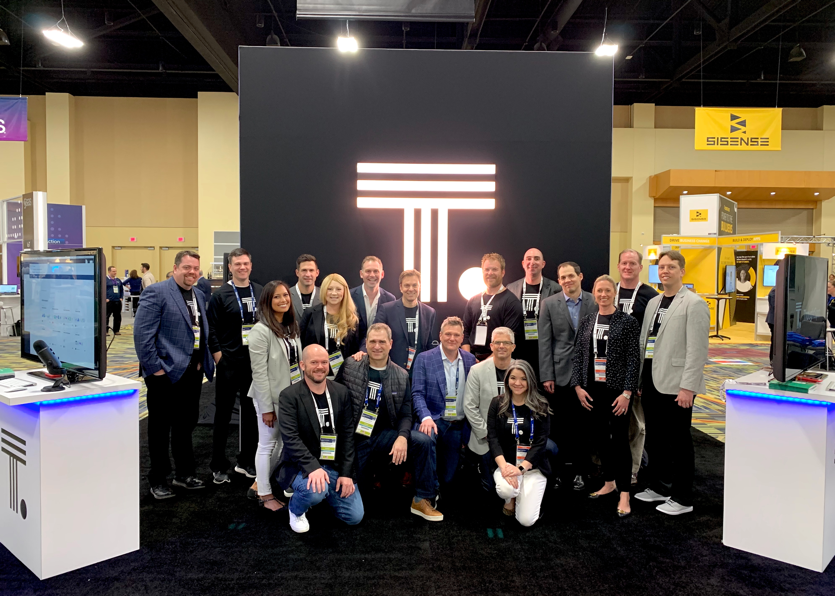
Having unveiled a new brand identity just weeks before, the Gartner Summit was the perfect opportunity for us to promote our new logo mark and brand experience more broadly. Everyone who swung by our booth remarked how fitting and unique our new logo is. It’s simple, yet effective, and reinforces our company name. And our swag? Those were a hit too!
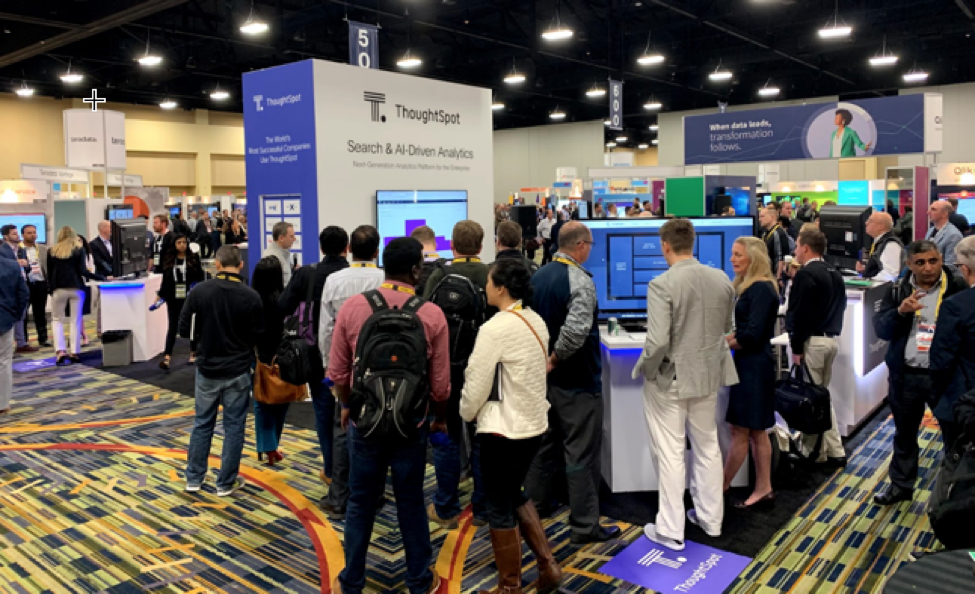
And so ends another Data and Analytics Summit. From the BI Bake Off to standing room only customer sessions, this year’s summit was one for the ages for ThoughtSpot. We thank Gartner for hosting such a special event. We’ll see you back in Grapevine, TX next year!
