

As the SVP for User Growth at ThoughtSpot, my job is to optimize our product features to reduce friction and encourage more user engagement. I spend my days analyzing our user data to answer questions like:
Which user behaviors are correlated with positive outcomes (e.g. user engagement, retention, and conversion)?
How can we encourage users to get more value out of the product?
Where are users running into sticking points, and how can we fix them?
The key to product-led growth is to identify measurable success metrics both for the product overall (your North Star metric) and for each product feature.
Choosing the right North Star metric is crucial. You’ll want to choose a metric that represents value delivered to users and correlates with revenue. (For example: DocuSign uses signed documents, Uber uses number of rides, and YouTube uses time spent watching videos.)
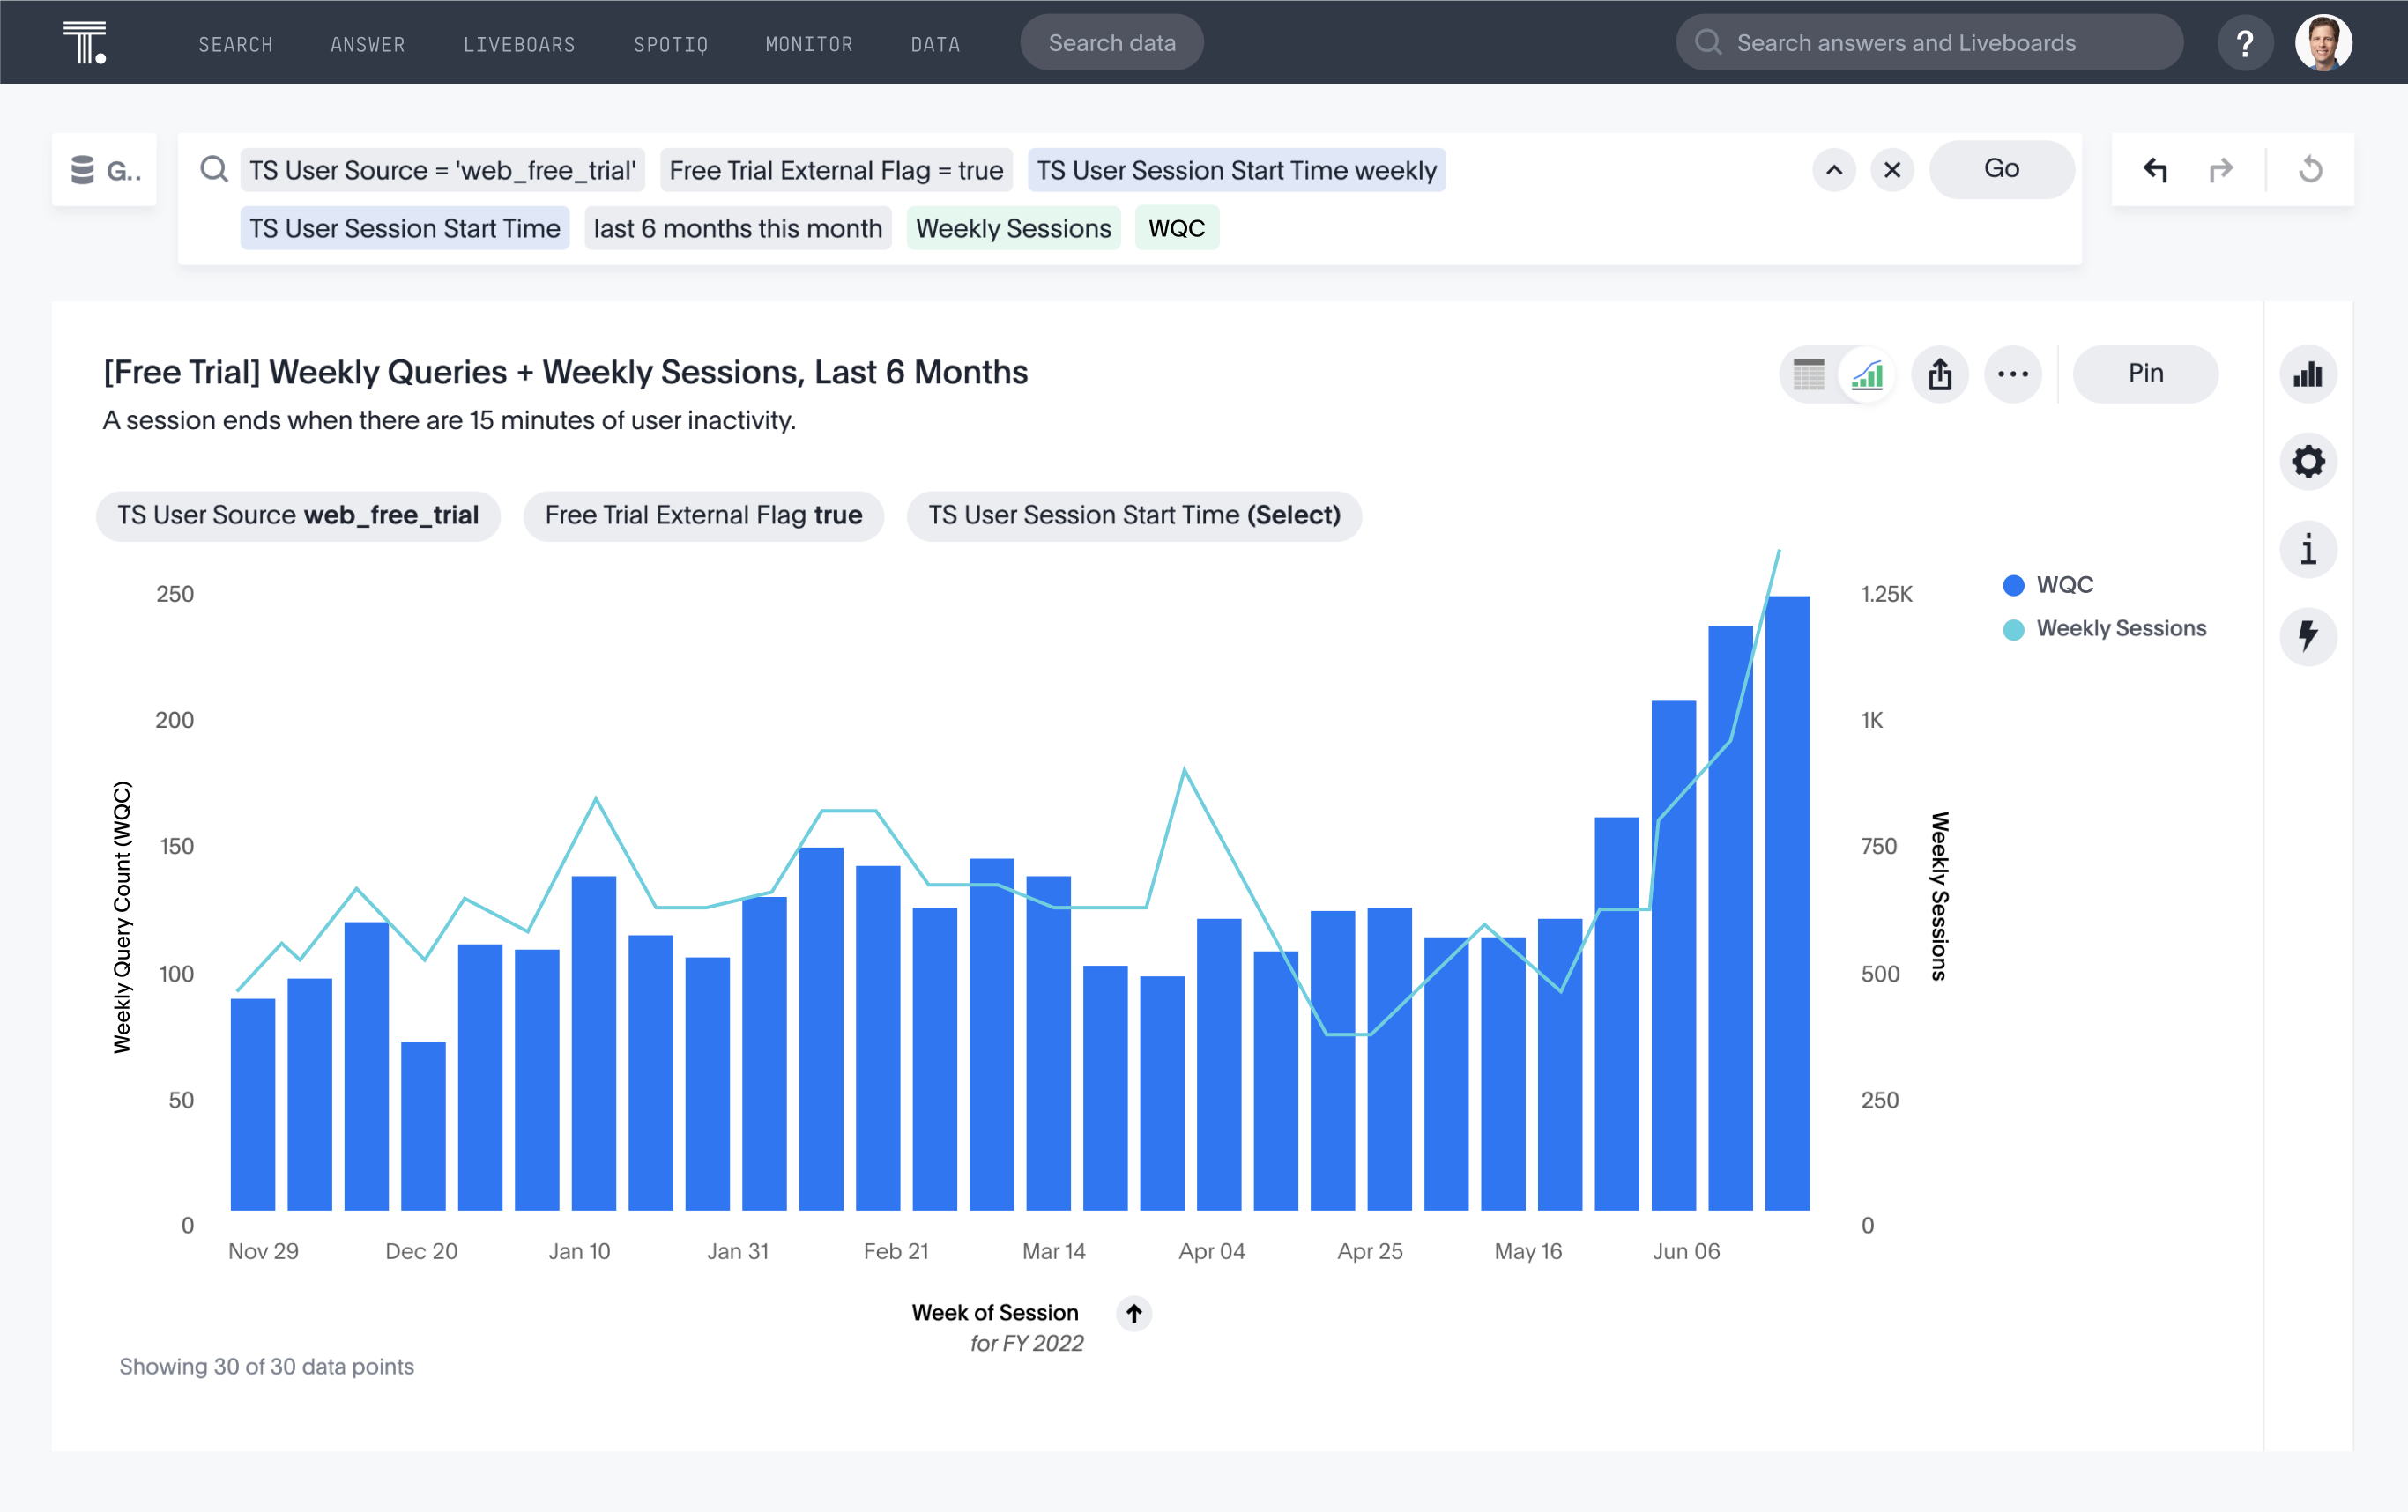
For ThoughtSpot, our North Star is number of weekly queries. When users query data and get results, they’re getting value. Plus, our pricing model for our Pro and Enterprise editions is based on number of queries, so it correlates with revenue, too.
But your North Star metric is top-level. You also need to identify measurable success metrics for product features. It means you have to stop thinking about features in binary terms, and instead shift to a truth-telling question: “Did I hit my success metric target for my feature?”
If you haven’t, then you need to continue to iterate on that feature, optimizing it until you hit your goal.
Finally, you also need to identify how the success metric for a feature influences your overall North Star metric. Another example: for our Monitor feature (used to send alerts when a data value crosses a certain threshold), our success metric is the number of metrics being monitored. Since monitoring a metric requires running a query to get its current value, the more metrics being monitored, the more queries are being run each week.
(Say that ten times fast!)
To be a truly data-driven organization, you should be gathering and analyzing data across the entire user funnel:
User acquisition
User activation
User engagement and retention
Conversion / Monetization rates
Your North Star Metric and feature-level success metrics
Ultimately, the focus of Product Led Growth is to use data to deeply understand user behavior, and then use that understanding to continually make it easier to try, buy, and use your product. Through all this, you ensure that users are getting as much value out of your product as possible.
Here’s how we use self-service analytics at ThoughtSpot.
Put data directly into the hands of your product team
I recommend setting up Liveboards for every feature team, and sharing it with everyone in that team, including Product Managers, Engineers, and Designers. A best practice we use is to start with a standardized Liveboard to create some consistency across the whole product team — then each feature team can copy the template and modify it for their own feature area. That way, they become deeply familiar with their data.
ThoughtSpot’s self-service analytics makes this incredibly easy for anyone to do.
Once you’ve got your Liveboards set up, it’s critical that you make sure that everyone keeps that data top of mind. For example, I have a weekly scheduled delivery of the trial user Liveboard that goes out to my team every Monday morning using a feature called Monitor.
You can also share ThoughtSpot insights with your team via email or Slack. This gives people a quick snapshot of what’s going on—then if they see anything interesting, they can click on the link to dive in deeper and interact with the data.
Because Liveboards are dynamic, you can drill into the most granular details to understand user behaviors at the deepest level. If a new question comes up, then you can use search to quickly get the answers you need—and then easily add them to your Liveboard if you like.
Surface insights into user behavior with SpotIQ
My team uses ThoughtSpot extensively to run correlation analyses. Our goal is to understand what leads to user engagement, retention, and user monetization.
SpotIQ is really handy here — that’s our augmented analytics tool that surfaces data insights for you, even when you don’t even really know what question you’re asking.
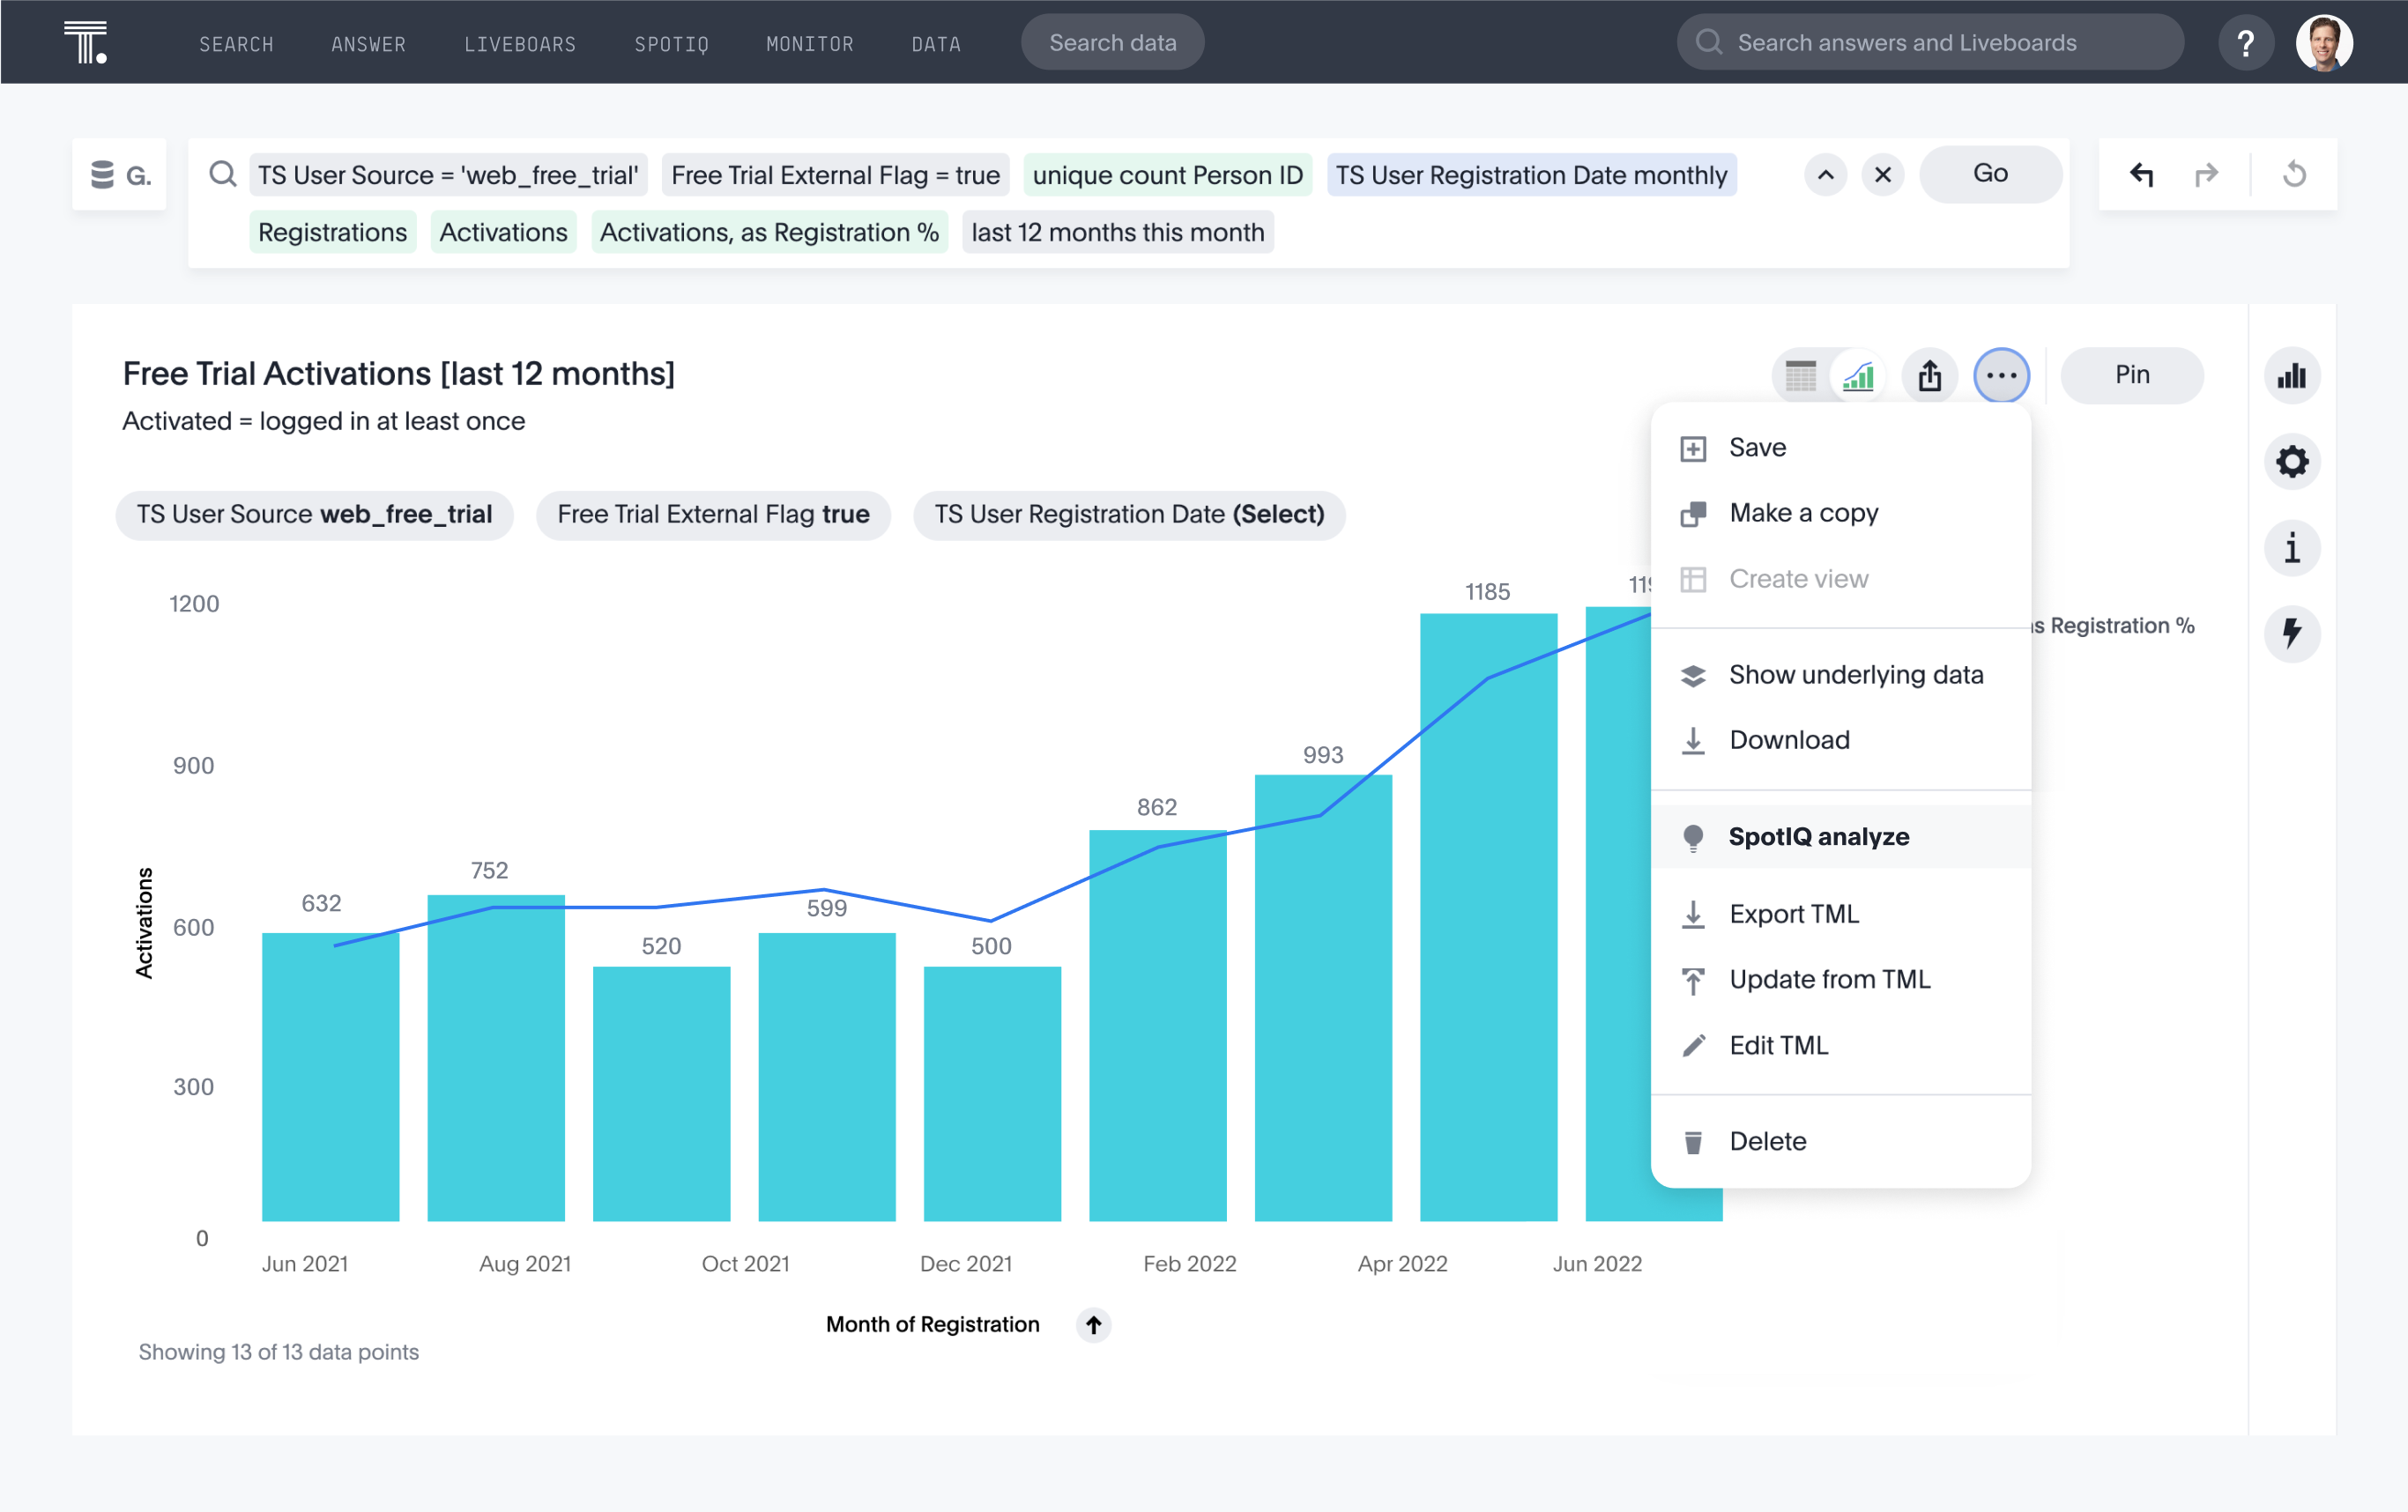
For example, we dumped a whole bunch of behavioral data from free trial users into ThoughtSpot, and SpotIQ was able to tell us which events made it more likely that a user would become a paying customer. With that information, we simplified and optimized the user experience to make it as easy as possible for them to find and use the features that would encourage them to buy.
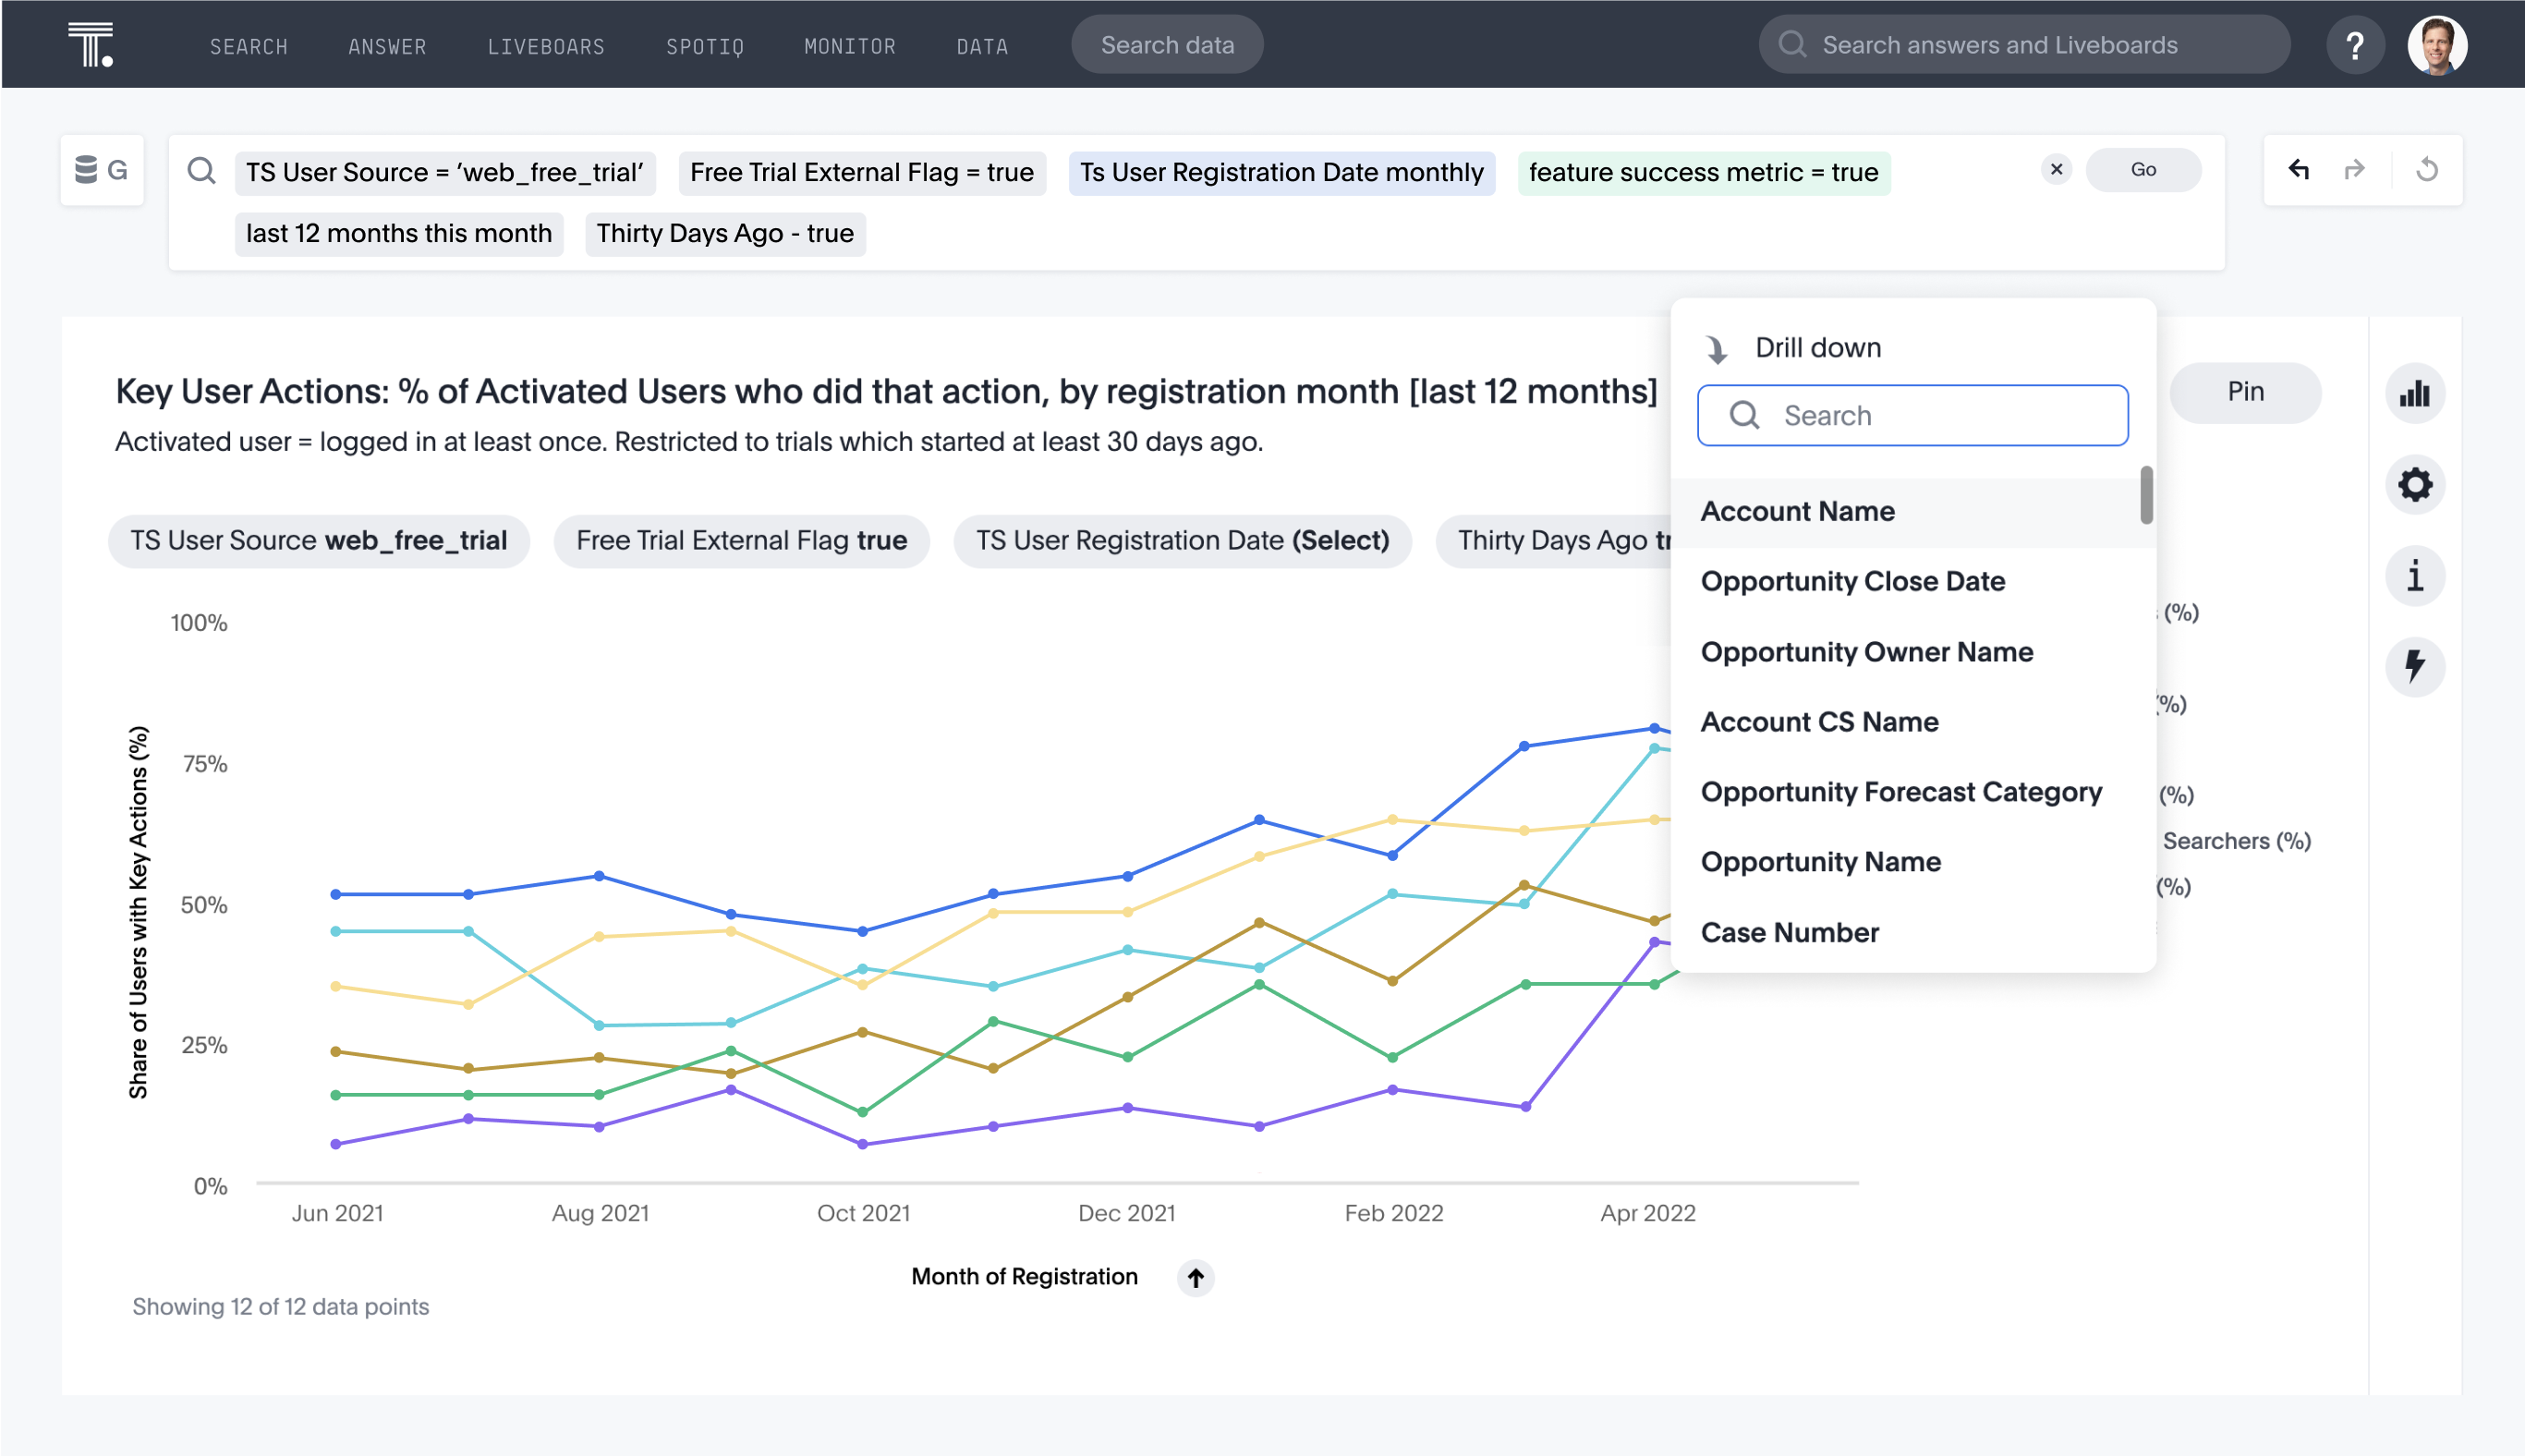
One point: you can make the biggest impact by looking for actions that are correlated with user engagement and retention, and which also currently have relatively low adoption. If an action is already being done by nearly every user, there’s not much headroom for improvement. But if the action has low adoption, you have more potential to increase its usage, driving more engagement as a result.
For example, our analysis showed that you are more likely to buy ThoughtSpot if you add a chart to a Liveboard during your free trial. However, when we ran the data, we found that less than 30% of users were adding items to Liveboards during their trial. So we knew there was room to grow, and it would be worth working with the product team to increase that number, by making the “add to Liveboard” feature more prominent (and simpler to use).
Build a product-led sales funnel
These days, our sales process is extremely product-driven. When a user comes in via a self-service free trial, they’re presented with a step-by-step process that’s built into the product to quickly help them set up their data without needing to reach out to anyone at ThoughtSpot.
Once their data is set up, we use ThoughtSpot to automatically identify free trial users who are most likely to convert to customers. To do this, we analyze which user actions are the best predictors of conversion, and assign a value to those actions. For example, if the user invites a colleague to join them in the trial, that’s 5 points. If they add a chart to a Liveboard, that’s 2 points. And so on.
Once they hit a certain threshold, the product automatically alerts the Sales team. This means that the user is already familiar with our product before they’re talking to Sales, and the discovery conversation becomes far more productive.
Analysis of this process shows that this process works: Thoughtspot users who use the free trial before they talk to the Sales team are more likely to convert to paying customers. Based on that, we now advise the Sales team to encourage every lead to sign up for a free trial before engaging in a discovery conversation.
Great products are built with great data
When it comes to product-led growth, you need to keep the data top of mind all the time. Analyzing your users’ behavior should be at the core of your product development roadmap. That’s the only way you can make sure that users are getting the most value out of your products.
If you’re interested in taking a more product-led approach to growth, you can check out more information on our website here or sign up for a free trial here.


