


The difference between consuming data and actioning it often comes down to one thing: effective data visualization.
Case in point? The John Snow’s famous cholera map.

In 1854, John Snow (no, not that one) mapped cholera cases during an outbreak in London. Snow’s simple map uncovered a brand new pattern in the data—the cases all clustered around a shared water pump. One of the earliest examples of data visualization, the map led to the discovery that cholera was water-borne, transforming the medical profession’s understanding of microbes and saving innumerable lives.
So, yes, data visualization matters. But not all visualizations are helpful—in fact, without applying the key principles of data design, you may create more problems than you solve.
To create compelling data visualizations, you need to follow these key principles:
-
Know your audience
-
Keep things simple
-
Use the right chart type
-
Use colors wisely
-
Highlight the most important information
-
Avoid clutter
Here’s how to get it right.
Know your audience
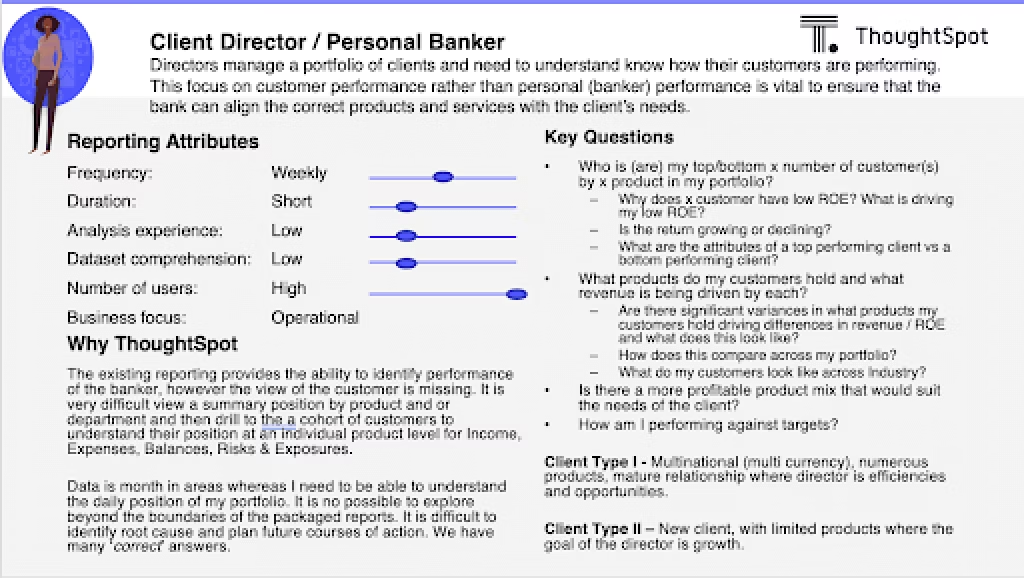
For successful data visualization design, you need to identify and describe the target user persona for your data. In other words, before you design a data visualization, start by asking yourself:
Who will be using this data?
What are their objectives?
How will they interact with the data?
What business questions do users need answered?
At ThoughtSpot, we create persona definition documents like the one below and capture business questions, so we can build effective Liveboards for each user group.
Keep it simple
Simplicity allows us to visually derive conclusions from data more easily. Ineffective visualizations (such as lengthy tables or complex charts) require more conscious thought to analyze information — slowing viewers down and reducing impact. To quote Stephen Few, one of the founders of modern data visualization, “A picture is worth a thousand words...but only when the story is best told graphically rather than verbally and the picture is well designed.”
Start Getting Better Insights
Use the right chart type
The primary purpose of data visualization is to help viewers discover actionable insights. When selecting a chart type, you need to ask yourself:
What story you’re trying to tell
Who your data visualization is for, and what their priorities are
What problem you’re trying to solve
What type of data you have (for instance, do you have categories of data? If so, how many categories?)
This information should give you a sense of which chart types will be most appropriate:
Pie charts are best for comparisons between a relatively low number of categories;
Bar charts are best for very precise comparisons between categories, and for when you want to show negative and positive values in the dataset;
Scatter charts are great to show correlation and clustering, especially if you have a lot of data to show;
Line charts emphasize trends over time;
Bubble charts showcase distribution or relationships in large data sets;
Area charts let you compare volumes of data easily.
💡 Relevant read: Histogram vs bar graph: Which should you use?
Use colors wisely
Color is a great way to focus your viewer’s attention. However, it’s best not to overwhelm people with too much of it.
When using color in data visualizations, you need to think about both hue (what color something is) and intensity (how saturated the color is.)
You should also keep your use of color consistent. For instance, only use a new color when it relates to a different meaning in the data.
Highlight the important information
Data visualizations tell a story. By highlighting the most crucial information first, your viewers can easily grasp what the story is all about.
You can also use the position of the data to create emphasis. For Western audiences, the top-left is considered prime real estate.
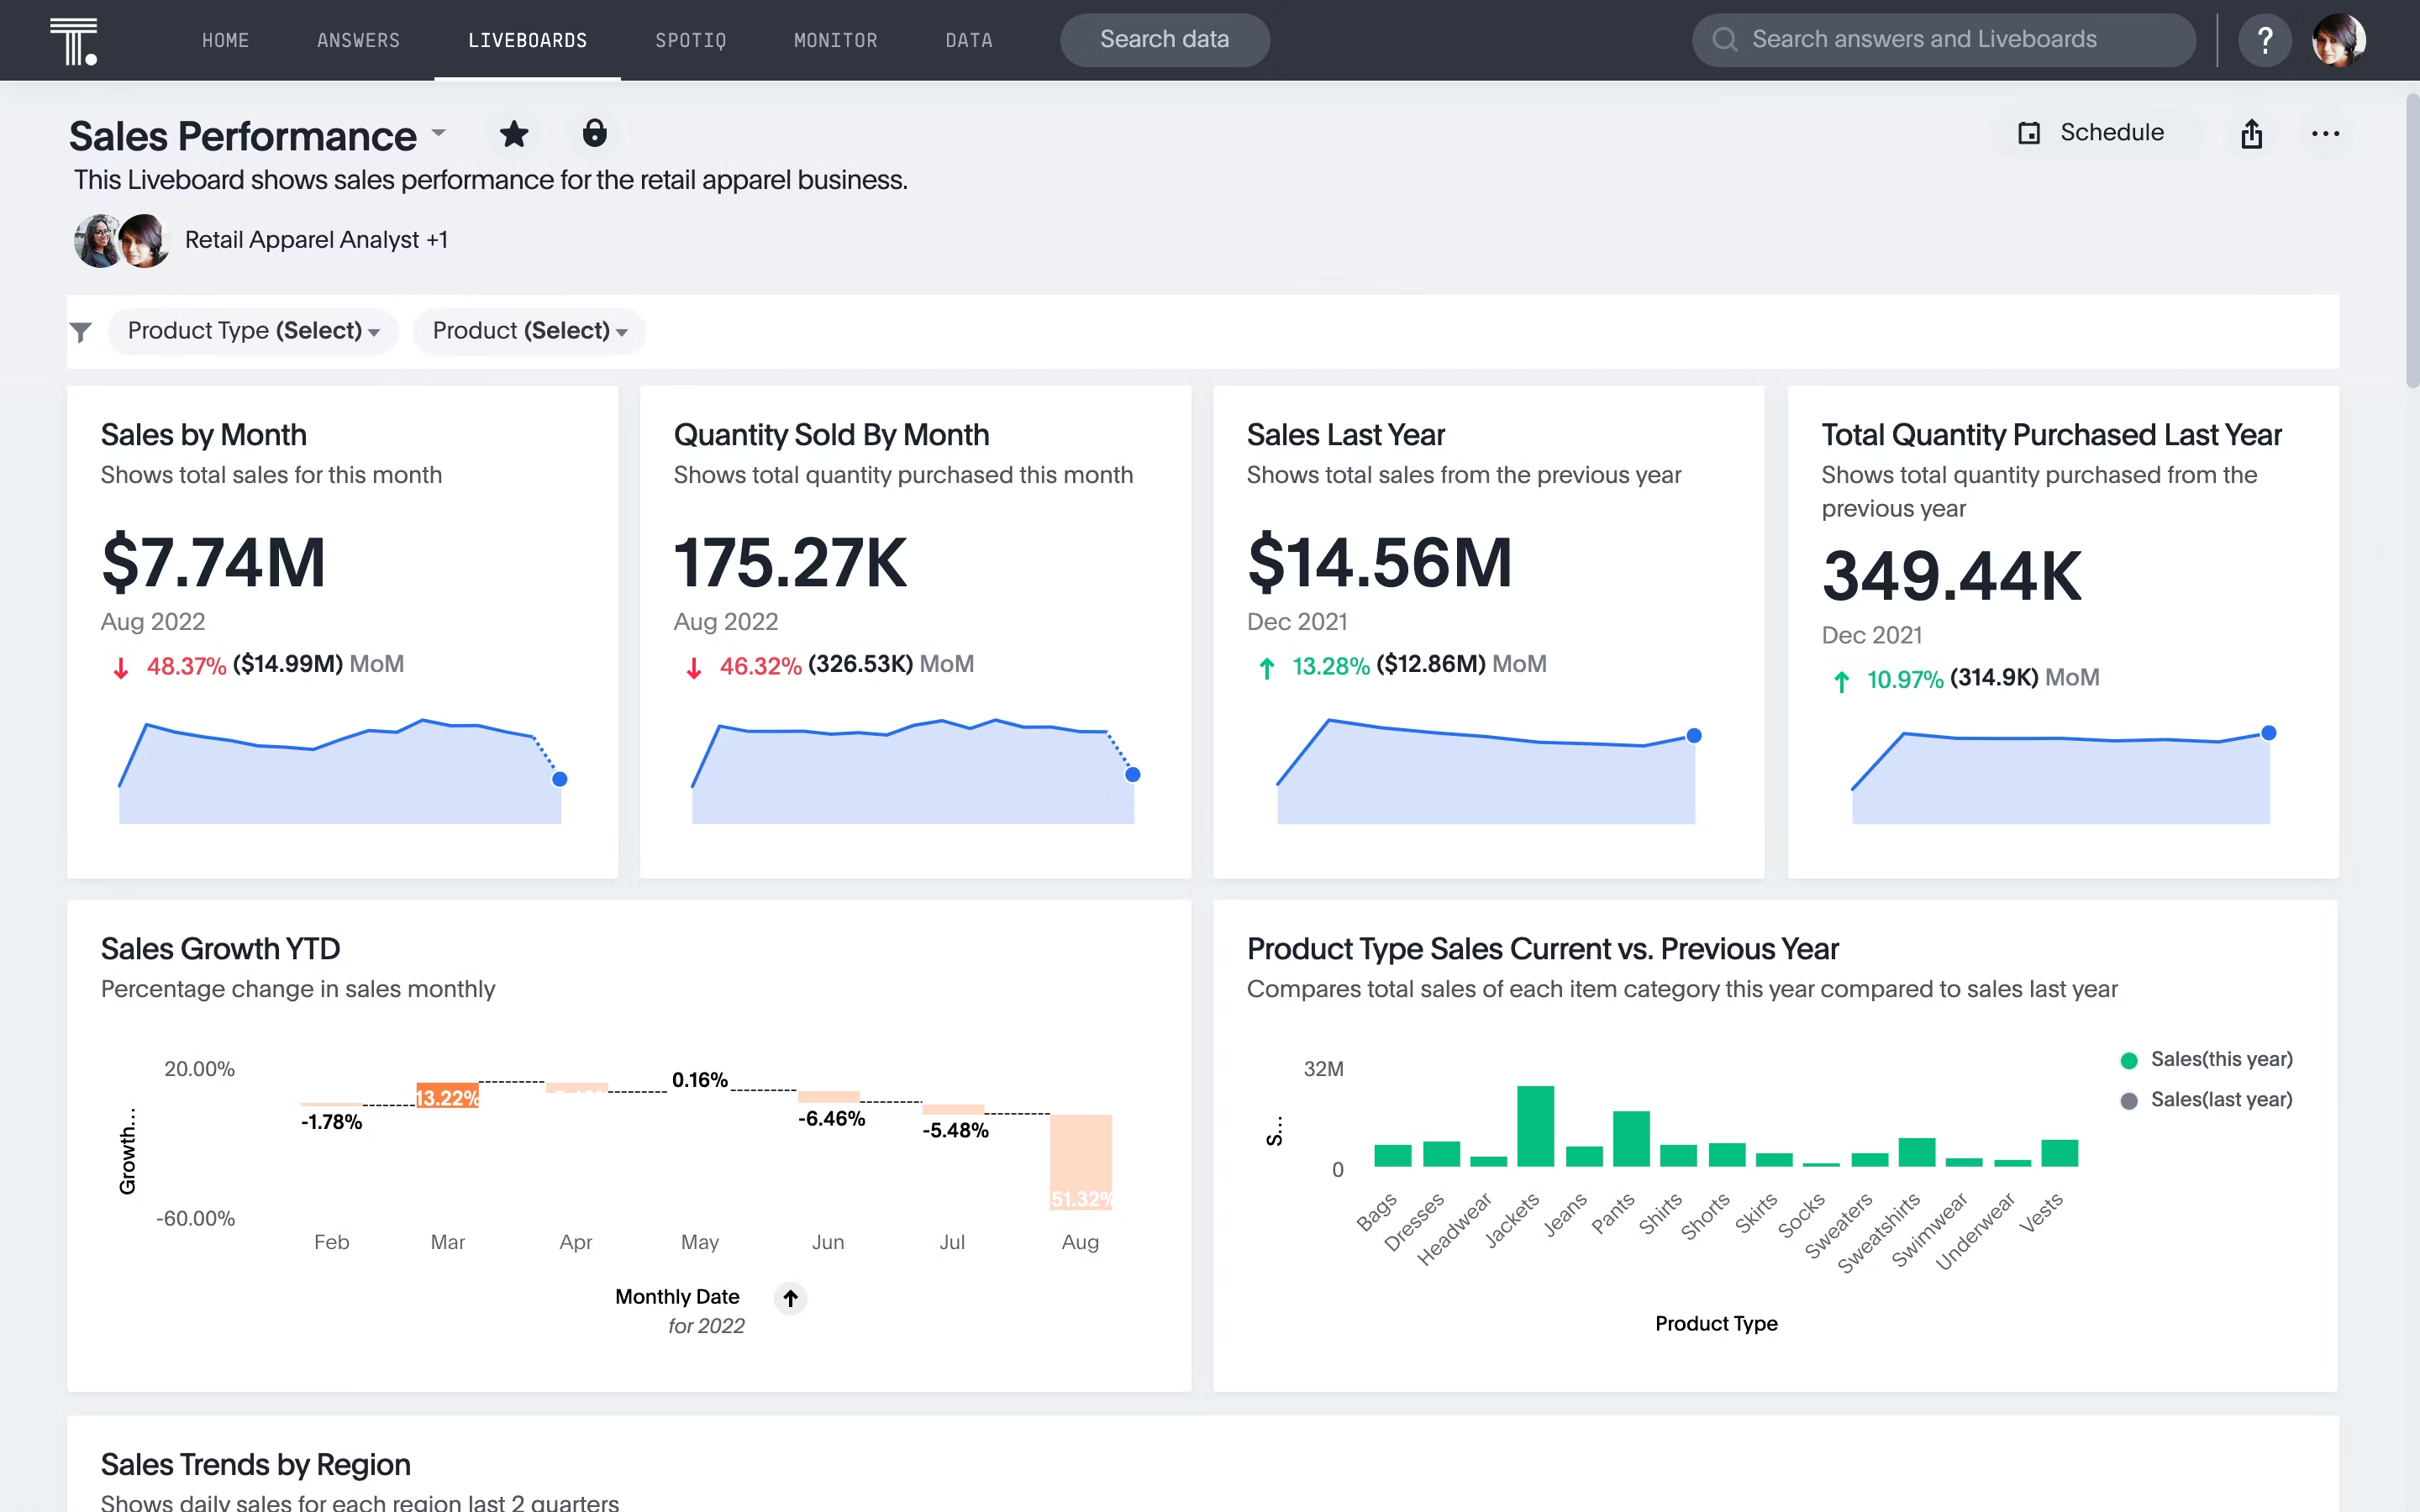
Here, for example, total sales by month is likely the most important information for our audience, so we’ve set up the Liveboard to show that data in the top-left.
Avoid clutter
If you try to cram in too much information in the same visualization, the actionable information gets lost in the noise.
Instead, it’s better to encourage the viewer to discover information through progressive disclosure–revealing each piece of information as you go to build a complete picture.
For instance, if you’re giving a presentation using ThoughSpot, start by just showing the highest level data in your presentation. Then progressively drill down into the data to answer questions from your audience or to illustrate a particular point you want to discuss during the meeting.
Great visualizations can transform your data into actionable business insights
To make the most of your data, you need to visualize it properly. Liveboards let you view and endlessly interact with all your live cloud data so you can create personalized, actionable insights at the point of impact. Sign up for a free trial of ThoughtSpot today and see how easy it is to tell a compelling story through data.


